
 ?Mathematical formulae have been encoded as MathML and are displayed in this HTML version using MathJax in order to improve their display. Uncheck the box to turn MathJax off. This feature requires Javascript. Click on a formula to zoom.
ABSTRACT
Through an analysis of total factor productivity for European regions using an econometric identification strategy, we find that significant impacts exist for both urban size and structure. A larger urban size positively affects regional productivity. Polycentric urban structures have no directly identified impacts on productivity. We find that an interaction between urban size and polycentricity has a negative effect, suggesting that polycentric regions are unable to substitute for the economic urbanization externalities associated with a single large city. These findings have important implications for the European Union-wide policy agenda on urban development and regional productivity.
INTRODUCTION
In a world where half the population lives in cities and generates approximately 80% of global output, urban dynamics play a pivotal role in the economic performance of regions at any scale. The reasons for the agglomeration of economic activity are thought to be associated with scale, which arises when a larger urban size and density enable productive clustering of firms and people (Glaeser, Citation2010). Firms and people profit from the micro-mechanisms of learning through the interactions and diffusion of ideas between proximate firms, the improved matching between a concentrated population of firms and the inputs they require, and the sharing of indivisible facilities and large labour pools located in the agglomeration (Duranton & Puga, Citation2004). Simultaneously, the negative consequences, namely, agglomeration diseconomies, have received an increasing amount of attention as well. A regional overreliance on the infrastructure and capacity of a single city could lead to disadvantages, such as congestion, pollution, and surging land rents and prices for localized labour (Fujita et al., Citation1997). However, an important debate focuses on the question of which spatial structures align with better economic performance and scaling in urban regions (Jong, Citation2021; Pumain & Rozenblat, Citation2019; Van Raan, Citation2020). Does critical economic mass imply that only firms and people in larger cities reap economic scale advantages (and profit from agglomeration economies), or can polycentric urban regions, with more complex morphological and functional fragmentation, have similar economic gains (Batty, Citation2013, pp. 256–257; Berry & Kim, Citation1993; Champion, Citation2001)? Second-tier or smaller cities could attempt to attain the same agglomeration advantages while mitigating the disadvantages through a different spatial structure in which their efforts and sizes are bundled. Reciprocity, knowledge exchange and creativity are then assumed to enable dynamic synergies of interactive growth for cooperating networks of proximate cities linked via a good infrastructure (Batten, Citation1995; Parr, Citation2004).
A rich research tradition of investigating spatial structures in relation to economic performance is present (‘the literature on urban form is huge’; Melpezzi & Guo, Citation2001, p. 2). Recently, however, empirical applications have focused on econometric identification methods, as ‘potential endogeneity at the left- and right-hand side variables’ obviously hampers identification (p. 2). The empirical debate is especially appropriate in a European context, where polycentric economic development and a lack of very large cities are apparent and explicit policies promoting polycentric development are gaining momentum (Espon, Citation2017; Van Zeben & Bobic, Citation2019). However, Vandermotten et al. (Citation2007), in this context, noted that:
it is necessary to prove that such a vague, inclusive and multiform concept as polycentrism could be the basis for alternative more valuable economic policies, or that it could lead to a better achievement of the Lisbon (competitiveness) objectives.
Despite the hypothesized importance of the spatial structure for European regional economies, the proof is fragmented and not always convincing. A general trend observed in Europe is that it is not the largest cities that perform strongest but rather the second-tier cities, which at times report higher gross domestic product (GDP) growth rates (Dijkstra et al., Citation2013). However, no consensus has been reached regarding polycentricity advantages, and endogeneity potentially remains an issue. Further important caveats apply to the measurement of economic development, and the impacts of various spatial scales, definitions of spatial structure, both morphological and functional focused. A pan-European analysis is lacking (there are quite some country-specific studies within Europe; see Van Meeteren et al., Citation2016, for an overview). This leads to many different interpretations (Brezzi & Veneri, Citation2015; Davoudi, Citation2003).
This paper adds to this empirical debate by introducing a novel, identifying analysis of spatial structures in European regions in relation to productivity in the period 2010–12, using hypotheses regarding urban size, polycentricity and the dispersion of urban centres in European regions. This analysis combines three innovative features. First, we introduce total factor productivity (TFP) as a superior measure of economic performance in European regions (Cortinovis & van Oort, Citation2019). Second, we use instrumental variables (IV) analysis to capture potential endogeneity in the structure–productivity relation. We build on the earlier research on the morphological polycentricity of urban centres within regions in the United States (Meijers & Burger, Citation2010) but develop specific European control and IV to test the relation. Third, this analysis is performed for a pan-European setting of urban regions, following delineations introduced by Brezzi and Veneri (Citation2015). These three aspects together have considerable advantages in terms of identifying the relationship between spatial structures and productivity in Europe.
The remainder of this paper is organized as follows. A selective overview of theoretical and recent empirical notions on polycentricity and regional productivity is presented in the next section. This is needed to formulate three testable hypotheses for the European Union (EU) spatial structure–productivity relation. The third section sets out the econometric method used to test these hypotheses, including a description of the measuring of urban structure and productivity. The fourth section discusses the data and variables used to quantify the econometric model. The empirical results are presented in the fifth section, and the sixth section concludes and presents a discussion of the main findings, implications and limitations. The three novel aspects (TFP, pan-European morphological polycentricity and IV analysis) also limit the in-depth interpretation of the study in terms of functional linkages (Batty Citation2018; Cervero, Citation2001; Veneri & Burgalassi, Citation2012), scale dependencies between inter- and intra-urban linkages (Wang et al., Citation2019), and time dependency (our research period is amidst the economic recession). Therefore, care is taken regarding the interpretation of these aspects; what we put central in the last section as well.
THEORETICAL BACKGROUND AND HYPOTHESES
To explain the effects of urban dynamics on regional economic performance, a great deal of empirical work within urban economics centred on the role of diverging spatial features has been conducted. The theoretical and empirical work within the urban economics and regional science field has typically focused on scale effects, that is, agglomeration economies. Economies of agglomeration can occur within a firm, which is generally known as internal returns to scale and scope, or between firms, which involves external returns to scale and scope. A substantial portion of the agglomeration benefits and costs are thought to be exchanged outside of the market, that is, buyer–supplier relations. Therefore, these are not priced and are known as externalities. These are key for understanding (changes in) locational patterns, as natural advantages only account for a minor part of industry agglomeration (Ellison & Glaeser, Citation1999).
Economies of agglomeration are the productivity gains experienced due to colocation. On the other hand, diseconomies of agglomeration are the extra costs resulting from the increased competition for scarce resources due to colocation, such as higher land prices, higher wages, congestion, pollution and noise levels. To clarify the understanding of the transmission channels of co-agglomeration forces, the literature distinguishes localization economies, that is, economies of agglomeration within the same industrial sector, from urbanization economies, that is, economies of agglomeration between sectors. Urbanization economies are passed on to all firms within a specific region and represent external economies arising from the size or density specifics of urban regions. The prime focus on density in this reasoning suggests that large and monocentric cities are best able to create economic advantages (Bertaud, Citation2018).
The impact of urban externalities on European economic performance has been convincingly shown in research (Ciccone, Citation2002; Graham et al., Citation2010). Notable externalities are found to be related to a well-developed infrastructure, a common labour pool, research and development (R&D) facilities, universities and other institutions accommodating increased economic performance (Dogaru et al., Citation2014). Furthermore, the diverse industry mix in European regions is likely to bring about firm interaction, generation, application, modification, and recombination of ideas and applications across sectors (Cortinovis & van Oort, Citation2015). The positive relation between urbanization externalities and productivity is well documented in the empirical literature, leading to our first hypothesis.
Hypothesis 1. Urbanization externalities in the form of a larger urban population positively affect regional productivity.
Meijers and Burger (Citation2010) argue that monocentric urbanization patterns alone do not correlate with density advantages on a regional level. Alternatively, polycentric urbanization may have a similar impact on the economic performance of an area. Over the years, the multitude of urban centres as an important dimension in analysing the economic performance of urban regions has been described by a diverse range of explanatory concepts, such as ‘multi-core city regions’ (Westin & Östhol, Citation1994), ‘network cities’ (Batten, Citation1995), ‘city networks’ (Camagni & Salone, Citation1993; Glaeser et al., Citation2016) and ‘polynucleated metropolitan regions’ (Batty, Citation2001; Dieleman & Faludi, Citation1998). In recent years, significant effort has been directed at a conceptual convergence of such frameworks through a monocentric–polycentric dimension (Burger & Meijers, Citation2012; Liu et al., Citation2016; Zhao et al., Citation2017). As we focus on the economic impacts related to urban structures in European regions, identifying appropriate scales and definitions becomes important. An abundance of different methods has been used in the empirical economic literature to measure polycentricity, which have provided diverging results across methods (Rauhut, Citation2017), and suggestions for harmonizing methods have been made, but no consensus has been reached (Hall & Pain, Citation2006; Peris et al., Citation2019; Van Meeteren et al., Citation2016). Our analysis will be subject to methodological choices as well.
The studies of polycentricity have been known to approach the concept from two different but closely related perspectives. The morphological perspective tends to focus on a region’s balanced development through the internal characteristics of urban centres, such as their distribution and size. On the other hand, functional polycentricity analyses the way in which urban centres ‘organize the rest of the territory by supplying the functions that shape territorial hierarchies’ (Brezzi & Veneri, Citation2015, p. 1131). Employment (in various industries and occupations), amenities (in types of goods and services consumed) and household living functions (by income classes and amenity preferences) may be heterogeneously spread across centres in the region, forming a complementary set of sorted specializations in which firms and people use the functions provided in their own and accessible neighbouring centres. On the regional scale, which is our focus, the morphological perspective equates polycentricity with the balanced distribution of a region’s city cores in space, while the functional perspective links it to a balanced, multidirectional set of relations (Burger & Meijers, Citation2012). As such, adjacent member cities and their populations of firms and individuals could benefit from mutual spillovers and supply streams, thereby exploiting the ‘borrowed size’ from their neighbours (Glaeser et al., Citation2016; Meijers et al., Citation2016). Agglomeration disadvantages such as congestion, pollution and fierce competition for production factors are likely to be more of an issue in highly concentrated, individual metropolitan cities and less so within urban networks consisting of multiple scattered but related nuclei (Parr, Citation2004).
Another aspect known to vary across the studies using the monocentric–polycentric dimension arises from the scale-dependent interpretation of the concept. Within spatial economics, three main scales tend to be used for the analysis of polycentricity, each with interchangeable labels. At the most local level, the micro- or intraurban scale views individual cities as polynuclear urban structures with each having their own internal hierarchical distribution of nuclei (Rauhut, Citation2017). The macro- or national scale is located at the other end of the spectrum and analyses the spatial structure of entire national urban systems, while it is also occasionally extended to the transnational or global level (Brezzi & Veneri, Citation2015; Dieleman & Faludi, Citation1998; Harrison & Hoyler, Citation2015). Between these two, the meso-, regional or inter-urban scale focuses on polycentric urban regions consisting of spatially and historically distinct cities with an assumed interaction between them that may influence the agglomeration externalities (Kloosterman & Musterd, Citation2001). All three levels of analysis are important for understanding polycentricity, and the relative weight of each view is determined by contextual circumstances (Burger et al., Citation2014; Rozenblat, Citation2009; Wang et al., Citation2019).
Our empirical analysis takes a morphological perspective focusing on the regional scale in Europe. This has two principal reasons. The first relates to the focus applied to policy initiatives at the level of the EU. As we want to conduct a pan-European analysis that is relevant for spatial policies regarding competitiveness and cohesion (Barca et al., Citation2012), we relate closely to the regional level, which is central in this debate. According to this debate, the sphere of influence of metropolitan areas has increasingly regionalized in recent decades due to the strong growth of these areas, which emphasizes the importance of a regional scale for a comprehensive analysis of their impacts on productivity (Brezzi & Veneri, Citation2015; Jong, Citation2021; Parr, Citation2004). The focus on the regional scale for our analysis of polycentricity does not mean that other scales are inappropriate to research; however, it is beyond the scope of our current policy-related research question. We will reflect on this in our concluding section.
Second, our analysis will mainly apply a morphological perspective. This perspective tends to focus on a region’s balanced development through the internal characteristics of urban centres, such as their distribution and size. This approach is adopted to allow comparability with existing studies and because our econometric identification strategy uses IV. Such variables, which are hypothesized to instrument for our spatial structure variables (size, polycentricity, dispersion and interactions of these variables), are constructed using historical data (see the fourth section). Opting for a functional approach would entail the inclusion of far more complex mutual linkages between the urban nuclei in the original and IV measurements. The exogenous effect of these linkages on regional productivity would be more difficult to isolate and would require data that are currently lacking. We will also reflect on this in our concluding section.
A notable difference from previous studies is that we choose our productivity measure carefully to optimally measure economic performance while controlling for the regionally varying factor inputs that, especially in Europe, can determine performance outcomes (Combes & Overman, Citation2004; Cortinovis & van Oort, Citation2019). The variations in the degree of polycentricity in US metropolitan areas have been found to correlate with labour productivity. In contrast to the relatively more monocentric outlay of cities in the United States, the European urban population mainly lives in small and medium-sized cities (Dijkstra et al., Citation2013); hence, the polycentricity hypotheses may fit the European situation better. An additional characteristic of the European urban landscape is its embedding in historically formed urban regions and city states (Brand, Citation2021; De Vries, Citation1984; Scott, Citation2012), creating a path-dependent evolution of the urban system (Vandermotten et al., Citation2007). As such development related to the urban structure is exogenous to present-day productivity (TFP), we use historical urbanization indicators in our IV estimation.
As the frequently stressed importance of agglomeration (size) for economic performance, thus, arguably holds less strongly for European urban regions, polycentricity on a regional level may substitute for a larger agglomeration size. We therefore hypothesize that the degree of polycentricity affects the productivity levels in European regions.
Hypothesis 2. A higher degree of polycentricity has a positive effect on regional productivity.
Urban network externalities are, according to some, only able to replace ‘simple’ urbanization externalities to a limited extent (Parr, Citation2004; Veneri & Burgalassi, Citation2012). Increased distances between separate city cores might entail logistical barriers while negating advantages related to the interactions inherent to a singular dense and centred metropolitan environment. The evidence from the US situation from Meijers and Burger (Citation2010) suggests that metropolitan economic performance benefits from increased polycentricity, while positive urbanization externalities diminish in more polycentric regions. That study also concluded that smaller urban areas profit the most from polycentricity – possibly because of the better functional relatedness (that was not measured) among smaller polycentric urban areas compared with larger polycentric areas where city cores might be large enough to function on their own. Borrowing size helps improve productivity when all the cities involved are small (‘together strong’). We formulate a third testable hypothesis, which expects an outcome similar to the US study:
Hypothesis 3. The positive effect of polycentricity on regional productivity diminishes as urbanization externalities increase.
A final hypothesis concerns the aspect of dispersion. Following the reasoning of Anas et al. (Citation1998), spatial organization is believed to go beyond the sizes of urban areas and the hierarchical distribution between them. Dispersion reflects the extent to which the population of a region is localized outside of its urban nuclei, while polycentricity captures the extent to which the population within those nuclei – that is, the non-dispersed population – is distributed. The degree of dispersion of a region’s population across its territory comprises a third dimension that is likely to have an impact on the productivity levels, as the dispersion of the regional population is likely to go hand in hand with a dispersion of economic productivity (Rossi-Hansberg & Wright, Citation2007). Thus, a high degree of dispersion indicates that a region is less agglomerated and, therefore, more unlikely to benefit from agglomeration economies. In addition, it can also mean that the dispersed urban population and economic production underutilize the centralized production factors, such as human capital (Rauch, Citation1993).
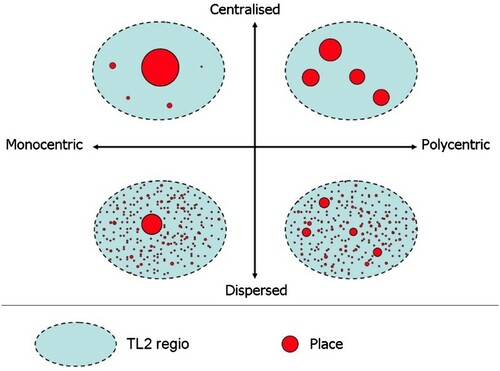
Although the dimensions of polycentricity and dispersion are intuitively associated with each other, their correlation is usually low (Meijers & Burger, Citation2010). The same holds for our European sample, where we find a low correlation of 0.151 between the two dimensions (see Table A2 in Appendix A in the supplemental data online). Instead, several combinations of the two spatial dimensions can exist to reflect diverging spatial structures, as displayed in . In addition to the spatial dimension of polycentricity, we include another testable hypothesis concerning the direct effect of dispersion:
Hypothesis 4. A higher degree of dispersion has a negative effect on regional productivity, independent of urban size.
Figure 1. Dimensions of regional urban form.
Source: Meijers and Burger (Citation2010).
MODELLING AND MEASUREMENT METHODS
For comparability, we measure the three dimensions of regional spatial structure, size, polycentricity and dispersion largely the same as Meijers and Burger (Citation2010). Similar to their US study, our study considers morphological rather than functional measurements by examining the presence and distribution of urban populations within regions. Our first variable capturing urbanization externalities is measured in a relatively straightforward way by taking the size of the population living in all the city cores of European regions (Ciccone, Citation2002). Regarding the measurement of morphological polycentricity and dispersion, there is little consensus on how to measure this, and the literature provides a detailed overview of measurement options (theoretically benchmarked by Fujita & Ogawa, Citation1982). An overview of Galster et al. (Citation2001) on sprawl, for instance, distinguishes eight dimensions of an urban structure in a regional setting as follows: density, continuity, concentration, clustering, centrality, nuclearity, mixed uses and proximity. Including all these dimensions in an econometric identifying framework is difficult to accomplish. Recently, Tsai (Citation2005) presented four different urban structure simulations, as follows: metropolitan size, activity intensity, the degree of evenly distributed activities and clustering of high-density subareas. All indicators preferably need small-scale delineations, which are not available in our research. Taubenbock et al. (Citation2017) used remote sensing data to measure morphological polycentricity. This results in accurate delineations but is not very helpful for our intended use of creating similar variables in the past that can be used as IV. The interesting approach of Roth et al. (Citation2011), that is, measuring the network usage of digital travel cards by mixing morphological and functional polycentricity measurements, has the same limitation.
For the sake of constructing (instrumental) variables for polycentricity and dispersion, we rely on simple indicators and take the urban population within regions as a starting point for our calculations. For our second variable, that is, polycentricity, to express the balance and hierarchy between urban nuclei, we use the rank-size distribution computed as shown in equation (1). In equation (1), the adjusted log rank (taken from Gabaix & Ibragimov, Citation2011) – the term on the right-hand side, which denotes the ranking of a city core within its region based on its population – is regressed on log size – measuring the total population of a given city core (c) within a region (r). The resultant coefficient β reflects the degree of polycentricity/monocentricity (); the steeper the line interpolating the relation between the log rank and log size data, the more uneven the balance between the cities included and the more hierarchical their distribution, meaning a more monocentric structure. Conversely, a flatter line means a smaller coefficient, a more even spread and less of a hierarchical distribution of the urban population within a region, characterizing it as being more polycentric. We transform and interpret the smaller coefficients as a higher ‘degree of polycentricity’.
(1)
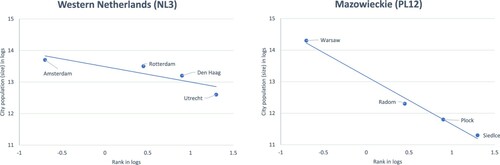
(1) The fact that some regions are home to a larger number of city cores than others could already hint at a higher degree of polycentricity, as the population is spread out over more nuclei (Burger & Meijers, Citation2012). To prevent such characteristics from affecting the outcome, we follow recent studies and incorporate a fixed number of city cores in our computation of polycentricity (Brezzi & Veneri, Citation2015; Meijers & Burger, Citation2010). According to Meijers (Citation2008, p. 1320), basing the sample size on a fixed number of city cores is advantageous, as ‘the extent of mono- or polycentricity is generally judged on the basis of the size and spatial distribution of just the handful of largest cities’. The final degree of polycentricity is calculated based on the average of the rank-size distributions calculated for the two, three and four cities included. Taking more places per region, when available, did not significantly change the resulting outcomes. Two examples of the rank-size distributions with four cities included are given in , which shows the fitted lines for West Nederland (which is more or less equal to the Randstad area, the traditional showcase of a polycentric urban region) and Mazowieckie, a Polish region dominated by the large city of Warsaw. As expected, the fitted line of the rank-size distribution line of the Randstad area is relatively flat compared with that of Mazowieckie, reflecting a relatively high degree of polycentricity for the Randstad region.
Figure 2. Rank-size distribution for the Western Netherlands (left) and Mazowieckie (right).
Source: Authors’ own calculations (see the fourth section).
Finally, we include a supplementary spatial dimension that reflects the degree of dispersion – measured as the share of the regional population not located within its city cores – to test Hypothesis 4. Other, more sophisticated measures for this indicator are presented in earlier research (see above) but were not perused in our analysis so that optimal comparison with the US study of Meijers and Burger (Citation2010) could be obtained.
Apart from the hypothesized influences of the three main spatial dimensions, several other factors have been found in the literature that affect regional productivity and should, therefore, be considered in our models. First, human capital plays an important role in the production function of a region and should, thus, be controlled for. Failing to control for human capital could lead to an upward bias in the outcomes of estimating the effect of agglomeration economies, as the time-variant quality of the labour force tends to be positively associated with the size of an urban agglomeration (Cortinovis & van Oort, Citation2015, Citation2019). Another important control concerns the quality and availability of the infrastructure. Connectivity via infrastructural resources facilitates efficient economic production within a region and represents a prime factor in the location decisions of firms (Liu et al., Citation2016; Westin & Östhol, Citation1994). Furthermore, rapidly innovating and growing industries could display different productivity levels than their relatively more stable and traditional counterparts. Consequently, the industry mix, expressed as the dependence on high-value and high-growth industries (consisting of value adding sectors of modern manufacturing and business services; Dogaru et al., Citation2014), has also been treated as a relevant factor influencing regional productivity. Last, the macrogeographical characteristics related to climate and nature could contribute to further differences in the productivity levels between regions and are controlled for in our models.
In addition to the bias due to omitting crucial control variables, there is a potential bidirectionality inherent to the structure-agglomeration relation, as regional productivity in itself could influence a region’s growth or its spatial organization (Ciccone, Citation2002; Di Addario & Patacchini, Citation2008; Vandermotten et al., Citation2007). As long as at least some production factors are mobile, higher productivity levels attracting firms and people could run very much in parallel with the traditional assumption that the city size leads to urban or industrial clustering, thus benefiting productivity (Graham et al., Citation2010). Likewise, the high land and real estate prices characterizing highly productive urban areas might cause people to move away from the main city cores to neighbouring areas, which subsequently experience growth and clustering in their urban areas. As a means to achieve an identified estimate, this paper relies on an IV estimation. The next section explains how we constructed the IV for size, polycentricity and dispersion.
The dependent variable used in previous studies (Meijers & Burger, Citation2010; Wang et al., Citation2019) is labour productivity. Rather than predicting output per worker via the combination of production factors with exogenous influences from spatial structure, the model we develop captures factors influencing a region’s TFP, which is defined as the portion of output not explained by the amount of inputs used in production. As a result, the level of TFP reflects the efficiency and intensity with which inputs are put to use in production. This has generally been argued to be a more accurate measure of productivity (Cortinovis & van Oort, Citation2019), and the change from labour productivity to a TFP measure, which control for the use of capital resources, can be seen as an important methodological improvement. The computation of TFP is the result of predicting the residuals of equation (2a):
(2a)
(2a) where capital (K) and labour (L) together with region (r) and year fixed effects (y) predict gross value added (GVA) for each region j. In turn, these residuals reflecting TFP are the dependent variable for the main model of this paper predicting regional productivity in European regions, which is show in equation (2b). Differently from the work of Meijers and Burger (Citation2010), our measure of TFP encompasses all sectors present in the region, rather than focusing on certain industries or discarding others. We argue this choice allows us to obtain more generalizable conclusions.Footnote1
(2b)
(2b) Since the production factors of capital and labour are already incorporated in the computation of TFP itself, these are no longer explicitly included in the model. The remaining factors taken into consideration are as presented above. H denotes human capital, the production factor that was not included in the computation of TFP, in the form of education. To account for exogenous influences on productivity beyond traditional production factors, a set of variables X with parameters θ supplements the model. Included in X are the spatial characteristics of size, polycentricity and dispersion, as well as infrastructural connectivity and an emphasis on high-added value employment in a region. Last, geographically bounded differences, such as climate and price levels, are controlled for by including a regional dummy r.
DATA AND VARIABLES
We analyse a cross-section of 168 regions spread out over 16 countries, predominantly those with long-standing EU membership. The regions are defined at Organisation for Economic Co-operation and Development (OECD) territorial level 2 (TL2). The OECD classification utilizes the NUTS-2 and NUTS-1 levels of Eurostat in such a way that each TL2 represents regions in the first tier of the subnational government while ensuring that the regions are large enough to be subject to an analysis where cities do not cross interregional borders (Brezzi & Veneri, Citation2015). Furthermore, TL2 regions account for similar geographical and demographic dimensions, which ensures a comparison that is as homogeneous as possible (D’Agostino et al., Citation2013). A few regions were not included in our analysis because they did not have sufficient data across the variables included in this study or at the level at which the empirical analysis was conducted.Footnote2 The descriptive statistics for all our main variables are presented in . For a detailed overview of the countries and regions included in our sample, see Table A1 in Appendix A in the supplemental data online.
Table 1. Descriptive statistics of variables (N = 168).
Although increasing attention is being paid to the economic performance and sizes of cities in Europe (Frick & Rodrigues-Pose, Citation2016), the previous contributions did not always clearly motivate their preferred measures of economic performance. We argue that using TFP (including GVA in all activities in regions) enables us to draw meaningful conclusions regarding the impact of spatial dimensions and local economic dynamics, as differentials in TFP account for most of the cross-country differences in per capita income. The computation of TFP was based on data from Cambridge Econometrics, in which (1) regional GVA is reported; (2) capital was estimated by using the perpetual inventory method on the gross fixed capital formation variable; and (3) labour was given as the number of hours worked by the regional population. Our TFP measure was computed at the NUTS-2 and NUTS-1 levels by regressing the GVA in a region on the production factors of capital and labour, as well as time-fixed effects and subsequently predicting the residuals of this regression as in Cortinovis and van Oort (Citation2019). All the variables included were log transformed to ensure more normal distributions.
Constructing the variables needed to test the main hypotheses of this paper related to spatial structure required a multi-step process. To mitigate the risk of analysing cities transgressing regional borders, a modular approach is chosen to estimate the sizes of the cities within each TL2 region. We first collected data from Eurostat’s Urban Audit project on 104,179 municipalities, which are defined at the local administrative unit 2 (LAU-2) level. Where applicable, a LAU-2 contains a code linking it to a city if the unit is within the boundaries of a core city. Additionally, to focus specifically on morphological polycentricity, only the city cores that have a minimum threshold of 40,000 inhabitants are included. The application of these rules minimizes inconsistencies and biases potentially arising from larger cities, such as functional urban areas crossing TL2 boundaries (Brezzi & Veneri, Citation2015). The total population of a city core is, thus, determined by aggregating the population of its LAU-2 components for the TL2 region where the majority of a city core’s population is located. For France, Greece, Sweden and the UK, this linkage between LAU-2 and city cores proved problematic due to a lack of city core codes connecting the two, forcing us to use non-modular aggregated data on city core populations from the Urban Audit project to supplement our dataset.Footnote3 After determining the number of people living in the 730 city cores in the sample, the next step was to compute polycentricity and dispersion, as explained in the third section. Polycentricity relies on the rank-size distributions estimating the size-based hierarchy of city cores within a region. The negative β-values resulting from equation (1) were made absolute and were subsequently inversed so that a larger coefficient ended up representing a higher degree of polycentricity. Finally, to calculate dispersion, the size variable – representing the total number of people living in the city cores of a TL2 region – was divided by the total TL2 population, as collected from Eurostat’s NUTS-2 and NUTS-1 data to obtain the share of people living in a region’s city cores. Next, this measure was subtracted from 1 to obtain the share of people not living in the city cores as a more apt proxy for dispersion.
To correctly identify the relation between urbanization economies and productivity, a number of control variables is included in the analysis. The level of human capital at the regional level is measured in our dataset as the percentage of the active population (aged 15–65) with a tertiary education. We also control for the infrastructural connectivity and accessibility of each region, as this could naturally affect the logistic efficiency and intensity with which a region can organize its production. As a proxy for this factor, a connectivity variable combining road, airport and seaport connectivity on a 1–10 scale (PBL, Citation2014) was included. This indicator reflects mostly the external accessibility of a region (by road, airport and seaport) and, to a lesser extent, its internal logistic efficiency and the intensity with which a region can organize its production. The latter may be important for the regional organization of production but was not available for our analysis. Given that the sample set covers 16 different countries, significant differences may also exist in terms of the local technological and industrial bases. In addition to the use of dummy variables for macrogeographical regions, as discussed below, we included an additional dummy variable that takes a value of 1 when a region includes specialized high-value industries (both in modern production sectors and business services).Footnote4 Finally, to control for disparities in climates, price levels or political systems, the sample set is divided into four macro-areas – North, Centre, South and East – with comparable countries in these respects, in accordance with Broadberry and O’Rourke (Citation2010).
To test the validity of our results in a two-stage least square setting (TSLS), we constructed instruments for our variables of interest. For this purpose and similar to other studies (Ciccone, Citation2002; Meijers & Burger, Citation2010), we use the historical data collected by Bairoch et al. (Citation1988), which provide population figures for European urban settlements from 800 to 1850. For the purpose of our analysis, the data on a total of 1732 European settlements in the year 1850 were used to estimate size and polycentricity in the same way as the endogenous contemporary variables included in our baseline, as follows: (1) size was calculated by aggregating the total population of a TL2 region’s urban settlements in 1850, which results in a reasonable estimate of the total urban population within a TL2 region; and (2) polycentricity was computed by taking the average of the rank-size distributions for the two, three or four largest urban settlements within a TL2 region and subsequently taking the inverse of its absolute value. Finally, we could not rely on the same lagged population data for a reasonably exogenous and relevant instrument for dispersion, given that no historical estimates for total TL2 populations were available. Alternatively, this last spatial dimension is instrumented through the use of contemporary data on total land area in square kilometres, a variable that is reasonably exogenous, as it is largely historically predetermined (Ciccone, Citation2002). It can be argued that (1) the establishment of regional borders in the past and (2) the absence of notable changes in a region’s land area in recent times make it unlikely that land area is endogenous to our model, while it does predict regional dispersion patterns. This historical predetermination of regional land area becomes apparent when examining the specific NUTS areas and their borders, as defined by the EU member countries, of which the majority relies on long-standing divisions. For example, German Regierungsbezirke returned to Germany’s unification in 1871, and Spain’s communidades autónomas or Italy’s Regioni are characterized by strong regional identities and relatively high degrees of autonomy (Roses & Wolf, Citation2019). The problems that arise from using the NUTS-2 classification are mitigated through the use of the OECD’s TL2 classification.
Given that the interest of this paper is in the interactions between spatial dimensions in addition to their standalone effects, instruments for the interaction terms are also required. A method to construct IV is to perform separate first-stage regressions that take the endogenous variables as the dependent variable, after which the predicted values from these regressions are saved as new variables. Subsequently, interaction terms can be created based on these predicted values, which can then be used as instruments for the endogenous interaction terms, as was done in Bloom et al. (Citation2013). Here, the predicted values obtained from the first-stage regressions represent the extent to which the main instruments – size in 1850, polycentricity in 1850 and the average total land area from 2010 to 2012 – predict the endogenous variables of size, polycentricity and dispersion for the 2010–2012 cross-sectional period. Subsequently, the predictive power of these main instruments is reutilized when constructing the interactions between the predicted values resulting from the first-stage regressions.
EMPIRICAL RESULTS
Basic results using ordinary least squares (OLS)
As a first step towards isolating the effects of our spatial factors on TFP, we present the results of the estimation of seven different models in . All these models estimate the effect of three spatial factors on regional TFP for the 2010–12 cross-sectional period average using OLS and including controls. What separates them is the inclusion of specific spatial structure factors. The numbers displayed at the top of each column in represent the model specifications used for the estimations. Columns 1–3, thus, display the results from the models containing only one of the three spatial dimensions, columns 4–6 show the results pertaining to models with combinations of two of the three dimensions, and the results from the full model including all three dimensions can be observed in the last column.
Table 2. Ordinary least squares (OLS) results for the effect on regional total factor productivity (TFP) (2010–12) for models with one, two or all three spatial factors.
The results presented in suggest several associations between spatial characteristics and regional productivity. First, size – measured as the log of the population living within the city cores of a TL2 region – is strongly positively associated with regional TFP and remains statistically significant at the 1% level when adding other spatial dimensions to the model. Regarding polycentricity, it can be observed that the sign of its coefficient is negative across all the model specifications and is only significant when controlling for size. This could be because size is an important predictor that should be included in the model to increase its predictive ability. As hypothesized, the external economies of structure associated with polycentricity could provide a substitute for urbanization externalities, which is why we consider it important to control for both types of external economies simultaneously; failing to control for size could, thus, lead to an incorrect estimation of the actual effect of polycentricity. Finally, the coefficient for dispersion is negative but never significant. Although not the main interest of our analysis, we notice that the control variables of education and high-value employment specialization are insignificant in the models. While we do not detect a problem with multicollinearity (see Table A2 in Appendix A in the supplemental data online for a correlation matrix), there are two main explanations: (1) our TFP is estimated through a model with regional fixed effects, that may capture – at least to some extent – the knowledge and human capital endowment of regions (since the amount of highly educated people is unlikely to change drastically from one year to the next); and (2) (log) counts of educated people tend to occur in regions with high level of population and connectivity, suggesting the positive coefficient of those variables may absorb some of the variation of the education variable. Ultimately, the results on regional productivity appear to be more driven by spatial structure variables and less by conditioning factors. More in-depth research on this may be needed (we reflect on this in our conclusions section).
Interactions between urbanization externalities and spatial structure
The next step is to examine how these three spatial dimensions interact. Urbanization externalities could benefit a region’s productivity differently depending on its degree of polycentricity or dispersion. To test this, we add interaction terms between size and polycentricity and dispersion. The results from these regressions are displayed in , where the first two columns display the outcomes when including one additional interaction term (Size × Polycentricity and Size × Dispersion). The column on the far right shows the results when estimating the effects of both interactions at once. As shown in , size and polycentricity remain statistically significant predictors of regional productivity in a model where all three spatial factors are included. Upon the addition of interaction variables between the three factors, their standard errors and coefficients barely change. Furthermore, the interaction between size and polycentricity seems to be negatively associated with regional productivity, as its coefficient is statistically significant at the 1% level in both models in which it is included. By contrast, interacting dispersion with urbanization externalities does not yield any statistically significant results, indicating that the effect of dispersion does not depend on the size of the urban population. What is particularly notable in is the fact that dispersion only appears to be positively associated with regional productivity when controlling for all spatial factors and their interactions with size simultaneously. Upon inspection of the pairwise correlation scores, the cause of this could be rooted in the high collinearity between dispersion and its interaction with size (see the correlation matrix in Table A2 in Appendix A in the supplemental data online).
Table 3. Ordinary least squares (OLS) results for models including interactions between the spatial factors and their effect on regional total factor productivity (TFP) (2010–12).
TSLS results
To ensure that the causality in our estimations runs from the spatial factors to regional productivity instead of the other way around, we test the robustness of our baseline results in a TSLS model. While we justified the use of our three instruments from a theoretical stand, it is also necessary to test their power empirically. For this purpose, we start by checking the Sanderson–Windmeijer F-statistics on the excluded instruments, which are reported at the bottom of (for a detailed overview of the first-stage regression results see Tables A3 in Appendix A in the supplemental data online). All the F-statistics in are comfortably above the rule-of-thumb threshold of 10, confirming the validity of our approach.Footnote5
Table 4. Two-stage least square setting (TSLS) results for the effects of urbanization externalities (size), structure (polycentricity and dispersion) and their interactions on regional total factor productivity (TFP) for the 2010–12 cross-section period average.
The results in are robust to our OLS estimations, as follows: (1) the size of the urban population is a strong, statistically significant predictor of regional TFP; and (2) polycentricity has a statistically significant negative effect on TFP, and dispersion does not seem to have any significant effect on productivity. Moreover, the coefficients for the interaction terms are robust and provide additional information about the dynamics of the effects of structural dimensions for given levels of urbanization externalities. Models 12 and 13 are the most detailed specifications. As in our OLS estimations, the negative effect of polycentricity on productivity is found to apply, especially for larger regions, as evidenced by the statistically significant negative coefficient of its interaction with size. The coefficient of the direct effect of polycentricity is no longer significant when controlling for its interaction with size, which suggests that the negative effect is predominantly present in regions with larger urbanization externalities. By contrast, in addition to the effect of dispersion being insignificant in itself, so is its interaction with urbanization externalities. This suggests that there is no mediating effect of size on dispersion. Although this finding is in line with the study by Meijers and Burger (Citation2010), who also found no significant effects related to dispersion, the rather limited method of measurement (and instrumenting) may be related to this result.
DISCUSSION AND CONCLUSIONS
This paper contributes to the debate on spatial structure and economic performance in European regions, a highly policy-relevant topic that hypothesizes that polycentricity can substitute for large cities in providing agglomeration economies, leading to improved productivity. This paper has explored both the potential impacts of scale and structure through an estimation of the effects of the following three spatial dimensions on regional productivity: size, polycentricity and dispersion. Despite the often-argued higher dependency on polycentrism in Europe compared with other continents for regional productivity gains, the empirical evidence on the impact of polycentricity and dispersion vis-à-vis urban size in a pan-European setting is scarce.
Our analysis combined several innovative features. First, we introduced TFP as a superior measure of economic performance in European regions, inherently controlling for capital and labour endowments in the regions. Second, we use IV analysis to capture the potential endogeneity in the structure–productivity relation. We built on the earlier research on the morphological polycentricity of urban centres within regions in the United States (Meijers & Burger, Citation2010) but developed specific European control and IV to test the relation. Third, we did this for a pan-European setting of urban regions, following the delineations introduced by Brezzi and Veneri (Citation2015). These three aspects together have considerable advantages in terms of identifying the relationship between spatial structure and productivity in Europe.
We hypothesized the following four relations: (1) the impact of urban size on regional TFP; (2) the impact of polycentricity on regional TFP; (3) the interactive impact of size and polycentricity on regional TFP; and (4) the impact of dispersion on regional TFP. The results obtained from estimating several OLS and TSLS models translate into four main findings. First, the size of the urban population is a highly significant predictor of regional TFP across all estimations (and Hypothesis 1, thus, is accepted). While this result is probably the least surprising given the well-documented strong link between urban size and productivity in the economic literature, it provides the foundation for the interpretation of the results relating to the spatial structure dimensions of polycentricity and dispersion. Second, we do not find that polycentricity has a significant direct positive effect on productivity in European regions (rejecting Hypothesis 2). The different OLS models with a variety of spatial dimensions included yielded a significantly negative coefficient as long as size was controlled for. In the preferred IV model, the coefficient for the direct effect of polycentricity becomes insignificant when including an interaction with size. This finding contradicts the US study by Meijers and Burger (Citation2010), who found this effect to be significantly positive (on labour productivity). Our outcomes are similar to those of the OECD study by Brezzi and Veneri (Citation2015), whose empirical results pointed in several directions depending on the scale of the analysis, that is, polycentricity was found to be associated with higher GDP per capita at the national scale, though with lower GDP per capita at the regional scale. Third, polycentricity negatively impacts regional productivity as size increases. Polycentricity in itself is not necessarily a significant negative predictor of productivity, but it works hand in hand with size. The significantly negative coefficient of the interaction term we find is similar to that in Meijers and Burger (Citation2010), with the only important difference being a baseline insignificant effect of polycentricity. Instead of concluding that polycentricity works better for regions with smaller urban populations (the conclusion in Meijers & Burger), the insignificant direct effect and significant negative interaction term suggest that polycentricity does not work for urban regions with a relatively larger population in particular. As in the work of Meijers and Burger, we also conclude that – for European regions with similar urban populations – the urbanization externalities derived from multiple city cores do not substitute for those achieved with a structure relying on singular, larger cities. Last, the estimation of the effect of dispersion did not yield any significant results, as its effect was insignificant or ambiguous at best across all our estimations. Our results suggest that it is, thus, the way in which the population is distributed across the city cores that matters and not the way in which the population is spread between the city cores and the rest of the regional area.
Although this paper is the first to explore the relation between productivity and urban spatial structures in a pan-European policy-rich regional setting, several limitations are attached to the research. Although firmly embedded in the existing theoretical and empirical literature, the choices and assumptions made in the setup of the research are generally arbitrary. First, the emphasis on morphological polycentricity does not exclude the possibility that a functional approach would lead to different outcomes. However, analysing polycentricity from a functional perspective in Europe remains hampered by a lack of sophisticated data at the European interregional level. Second, we focused on a regional scale in our analysis, as this is the level at which pan-European policy initiatives initially focus, but a multiscalar perspective proved fruitful in previous research, as well (Wang et al., Citation2019). Further, our choice for the administratively based TL2-regional scale of analysis may well be arbitrary, with actual processes of interlocal (polycentric) relations taking place within parts of these regions. We were not able to test this sensitivity due to a lack of harmonised regional data needed to construct our variables of interest, including control variables, and we recommend that our outcomes should therefore be interpreted with care. Third, the measurement of dispersion in our research is relatively crude for comparison and fitting with IV estimation reasons. As we do find few results on this indicator, the development and use of a more sensible indicator can be perused. Fourth, certain variables may be sensitive to measurement, especially the control variable of accessibility (measuring regional–external connectivity mainly). The controls on the specialization and education variables did not show significant relations with productivity. While we provide some tentative explanations for those results, the reasons for that remain uncertain. Urban audit data collection is marked by frequent changes in the ways in which variables are defined, included and measured (Eurostat, Citation2017), and more transparency would foster more consistent research. All the variables would potentially have benefitted from a collection of longitudinal (panel) data, although degrees of polycentricity, dispersion and size do not change rapidly over time. However, more time variation in the controls can be assumed to be important, especially as our research period is amidst a time of economic decline (2010–12). Variations in regional economic resilience may, therefore, interact with the presented outcomes.
These caveats notwithstanding, our results suggest a larger role for urbanization vis-à-vis polycentricity and dispersion than suggested until now in the pan-European policy debate. This implies that place-based regional development strategies (Barca et al., Citation2012) may benefit from a larger integration with urban economic agendas, with arguably less confident reliance on polycentricity as a panacea for reducing regional economic inequalities (Davoudi, Citation2003).
Supplemental Material
Download PDF (201.7 KB)ACKNOWLEDGEMENTS
We thank Paulo Veneri for data sharing and Ben Derudder, Evert Meijers, Martijn Burger and Alain Thierstein for valuable feedback on an earlier version of the paper.
DISCLOSURE STATEMENT
No potential conflict of interest was reported by the authors.
Notes
1. The characteristics of a region which are relatively time constant (e.g., being the capital of a country, hosting a large public sector, etc.) are likely to be controlled for by the regional fixed effects in our TFP estimate. Even if not fully controlled, the bias introduced in our estimates by keeping non-market activities and public administration in our sample is likely to be downward (i.e., estimating a level of TFP lower than the real one). This means our findings should be interpreted as lower bound estimates and are unlikely to be biased upwards. For these reasons, we believe focusing on the aggregate GVA is a better approach than removing industries which are arguably less relevant for our analysis. While this option remains a valid choice, it reduces the general nature of the findings and it may introduce a bias in the estimates and arbitrariness in the selection of industries.
2. The countries with incomplete data from the Eurostat or Urban Audit databases were Bulgaria, Croatia, Cyprus, Denmark, Estonia, Finland, Iceland, Latvia, Macedonia, Norway, Romania and Switzerland. Regions excluded because of data limitations were those located on other continents or remote islands (e.g., Guadeloupe for France, the Canary Islands for Spain or the Azores for Portugal). Regions that had data available in the databases but did not include sufficient cities to calculate polycentricity between 2010 and 2012 were Valle d’Aosta (Italy), Alentejo (Portugal), Norra Mellansverige (Sweden) and the Highlands & Islands (UK). Similarly, excluded regions with no polycentricity calculation possible in 1850 were Střední Čechy (Czech Republic), Severozápad (Czech Republic), Łódzkie (Poland), Mellersta Norrland and Övre Norrland (both Sweden).
3. UK, Swedish and Greek data were taken directly from the Urban Audit, all for C1-level cities. These are non-modular LAU-2 units that were aggregated. For French cities, communauté de communes en communauté d’agglomeration are distinguished. The latter are included only when large enough (more than 40,000 inhabitants).
4. As is customary in economic geography (Cortinovis & van Oort, Citation2015), we consider a region as being specialized in high-value industries when the location quotient for those industries in that region is > 1.
5. The first-stage regressions shown in Tables A3 in Appendix A in the supplemental data online are in line with these results; when only including the three spatial dimensions, the first-stage coefficients of the instruments significantly predict their endogenous variable of interest. However, when including interaction terms, only the endogenous interaction term as a dependent variable is significantly predicted by all variables included in the first-stage regression. The insignificance of the first-stage coefficients predicting the spatial dimensions (and not the interactions) could be due to collinearity between the instruments, evidenced by the relatively high correlations shown in Table A2 online.
REFERENCES
- Anas, A., Arnott, R., & Small, K. A. (1998). Urban spatial structure. Journal of Economic Literature, 36(3), 1426–1464.
- Bairoch, P., Batou, J., & Chevre, P. (1988). La population des villes Européenees de 800 à 1850: Banque de données et analyse sommaire des résultats. Centre d’histoire économique Internationale de l’Université de Genève, Libraire Droz.
- Barca, F., McCann, P., & Rodríguez-Pose, A. (2012). The case for regional development intervention: Place-based versus place-neutral approaches. Journal of Regional Science, 52(1), 134–152. https://doi.org/https://doi.org/10.1111/j.1467-9787.2011.00756.x
- Batten, D. F. (1995). Network cities: Creative urban agglomerations for the 21st century. Urban Studies, 32(2), 313–327. https://doi.org/https://doi.org/10.1080/00420989550013103
- Batty, M. (2001). Polynucelated urban landscapes. Urban Studies, 38(4), 635–655. https://doi.org/https://doi.org/10.1080/00420980120035268
- Batty, M. (2013). The new science of cities. MIT Press.
- Batty, M. (2018). Inventing future cities. MIT Press.
- Berry, B. J. L., & Kim, H. M. (1993). Challenges to the monocentric model. Geographical Analysis, 25(1), 1–4. https://doi.org/https://doi.org/10.1111/j.1538-4632.1993.tb00275.x
- Bertaud, A. (2018). Order without design. How markets shape cities. MIT Press.
- Bloom, N., Schankerman, M., & van Reenen, J. (2013). Identifying technology spillovers and product market rivalry. Econometrica, 81(4), 1347–1393. https://doi.org/https://doi.org/10.3982/ECTA9466
- Brand, N. (2021). The making of the urban structure of the Randstad. In W. Zonneveld, & V. Nadin (Eds.), The Randstad. A polycentric metropolis (pp. 29–49). Routledge.
- Brezzi, M., & Veneri, P. (2015). Assessing polycentric urban systems in the OECD: Country, regional and metropolitan perspectives. European Planning Studies, 23(6), 1128–1145. https://doi.org/https://doi.org/10.1080/09654313.2014.905005
- Broadberry, S., & O’Rourke, K. H. (2010). The Cambridge economic history of modern Europe: Volume 1, 1700 1870. Cambridge University Press.
- Burger, M. J., & Meijers, E. (2012). Form follows function? Linking Morphological and Functional Polycentricity. Urban Studies, 49(5), 1127–1149. https://doi.org/https://doi.org/10.1177/0042098011407095
- Burger, M., Meijers, E., & van Oort, F. (2014). Multiple perspectives on functional coherence: Heterogeneity and multiplexity in the Randstad. Journal of Economic and Social Geography (TESG), 105(4), 444–464. https://doi.org/https://doi.org/10.1111/tesg.12061
- Camagni, R. P., & Salone, C. (1993). Network urban structures in northern Italy: Elements for a theoretical framework. Urban Studies, 30(6), 1053–1064. https://doi.org/https://doi.org/10.1080/00420989320080941
- Cervero, R. (2001). Efficient urbanisation: Economic performance and the shape of the metropolis. Urban Studies, 38(10), 1651–1671. https://doi.org/https://doi.org/10.1080/00420980120084804
- Champion, A. G. (2001). A changing demographic regime and evolving polycentric urban regions: Consequences for the size, composition and distribution of city populations. Urban Studies, 38(4), 657–677. https://doi.org/https://doi.org/10.1080/00420980120035277
- Ciccone, A. (2002). Agglomeration effects in Europe. European Economic Review, 46(2), 213–227. https://doi.org/https://doi.org/10.1016/S0014-2921(00)00099-4
- Combes, P. P., & Overman, H. (2004). The spatial distribution of economic activities in the European Union. Chapter 64. In J. V. Henderson, & J. F. Thisse (Eds.), Handbook of regional and Urban Economics – cities and geography (pp. 2846–2909). Elsevier.
- Cortinovis, N., & van Oort, F. G. (2015). Variety, economic growth and knowledge intensity of European regions: A spatial panel analysis. The Annals of Regional Science, 55(1), 7–32. https://doi.org/https://doi.org/10.1007/s00168-015-0680-2
- Cortinovis, N., & van Oort, F. G. (2019). Between spilling over and boiling down: Network-mediated spillovers, absorptive capacity and productivity in European regions. Journal of Economic Geography, 19(6), 1233–1260. https://doi.org/https://doi.org/10.1093/jeg/lby058
- D’Agostino, L. M., Laursen, K., & Santangelo, G. D. (2013). The impact of R&D offshoring on the home knowledge production of OECD investing regions. Journal of Economic Geography, 13(1), 145–175. https://doi.org/https://doi.org/10.1093/jeg/lbs012
- Davoudi, S. (2003). European Briefing: Polycentricity in European spatial planning: From an analytical tool to a normative agenda. European Planning Studies, 11(8), 979–999. https://doi.org/https://doi.org/10.1080/0965431032000146169
- De Vries, J. (1984). European urbanization 1500–1800. Harvard University Press.
- Di Addario, S., & Patacchini, E. (2008). Wages and the city. Evidence from Italy. Labour Economics, 15(5), 1040–1061. https://doi.org/https://doi.org/10.1016/j.labeco.2007.09.003
- Dieleman, F. M., & Faludi, A. (1998). Polynucleated metropolitan regions in northwest Europe: Theme of the special issue. European Planning Studies, 6(4), 365–377. https://doi.org/https://doi.org/10.1080/09654319808720468
- Dijkstra, L., Garcilazo, E., & McCann, P. (2013). The economic performance of European cities and city regions: Myths and realities. European Planning Studies, 21(3), 334–354. https://doi.org/https://doi.org/10.1080/09654313.2012.716245
- Dogaru, T., van Oort, F., Diodato, D., & Thissen, M. (2014). Agglomeration and knowledge in European regional growth. In S. Conventz, B. Derudder, A. Thierstein, & F. Witlox (Eds.), Hub cities in the knowledge economy (pp. 181–201). Ashgate.
- Duranton, G., & Puga, D. (2004). Micro-foundations of urban agglomeration economies. In V. Henderson, & J. F. Thisse (Eds.), Handbook of regional and urban economics (pp. 2063–2117). North-Holland: Elsevier.
- Ellison, G., & Glaeser, E. L. (1999). The geographic concentration of industry: Does natural advantage explain agglomeration? American Economic Review, 89(2), 311–327. https://doi.org/https://doi.org/10.1257/aer.89.2.311
- European Observation Network for Territorial Development and Cohesion (ESPON). (2017). Between cooperation and competition: Why polycentric development matters.
- Eurostat. (2017). Methodological manual on city statistics (2017 edition). Publication Office of the European Union.
- Frick, S. A., & Rodrigues-Pose, A. (2016). Average city size and economic growth. Cambridge Journal of Regions, Economy and Society, 9(2), 301–318. https://doi.org/https://doi.org/10.1093/cjres/rsw013
- Fujita, M., & Ogawa, H. (1982). Multiple equilibria and structural transition of non-monocentric urban configurations. Regional Science and Urban Economics, 12(2), 161–196. https://doi.org/https://doi.org/10.1016/0166-0462(82)90031-X
- Fujita, M., Thisse, J. F., & Zenou, Y. (1997). On the endogenous formation of secondary employment centres in a city. Journal of Urban Economics, 41(3), 337–357. https://doi.org/https://doi.org/10.1006/juec.1996.2002
- Gabaix, X., & Ibragimov, R. (2011). Rank −1/2: A simple way to improve the OLS estimation of tail exponents. Journal of Business & Economic Statistics, 29(1), 24–39. https://doi.org/https://doi.org/10.1198/jbes.2009.06157
- Galster, G., Hanson, R., Ratcliffe, M. R., Wolman, H., Coleman, S., & Freihage, J. (2001). Wrestling sprawl to the ground: Defining and measuring an elusive concept. Housing Policy Debate, 12(4), 681–717. https://doi.org/https://doi.org/10.1080/10511482.2001.9521426
- Glaeser, E. L. (2010). Introduction to the economics of agglomeration. In Agglomeration economics (pp. 1–14). University of Chicago Press.
- Glaeser, E. L., Ponzetto, G. A., & Zou, Y. (2016). Urban networks: Connecting markets, people, and ideas. Papers in Regional Science, 95(1), 17–59. https://doi.org/https://doi.org/10.1111/pirs.12216
- Graham, D. J., Melo, P. S., Jiwattanakulpaisarn, P., & Noland, R. B. (2010). Testing for causality between productivity and agglomeration economies. Journal of Regional Science, 50(5), 935–951. https://doi.org/https://doi.org/10.1111/j.1467-9787.2010.00676.x
- Hall, P., & Pain, K. (2006). The polycentric metropolis. Learning from mega-city regions in Europe. Earthscan.
- Harrison, J., & Hoyler, M. (2015). Megaregions. Globalization’s new urban form? Edward Elgar.
- Jong, D. M. O. (2021). Local autonomy, fragmentation and quality of government: the urban productivity effects of local governments in Europe. Paper presented at NARSC, Pittsburgh.
- Kloosterman, R. C., & Musterd, S. (2001). The polycentric urban region: Towards a research agenda. Urban Studies, 38(4), 623–633. https://doi.org/https://doi.org/10.1080/00420980120035259
- Liu, X., Derudder, B., & Wu, K. (2016). Measuring polycentric urban development in China: An intercity transportation network perspective. Regional Studies, 50(8), 1302–1315. https://doi.org/https://doi.org/10.1080/00343404.2015.1004535
- Meijers, E. J. (2008). Measuring polycentricity and its promises. European Planning Studies, 16(9), 1313–1323. https://doi.org/https://doi.org/10.1080/09654310802401805
- Meijers, E. J., & Burger, M. J. (2010). Spatial structure and productivity in US metropolitan areas. Environment and Planning A: Economy and Space, 42(6), 1383–1402. https://doi.org/https://doi.org/10.1068/a42151
- Meijers, E. J., Burger, M. J., & Hoogerbrugge, M. (2016). Borrowing size in networks of cities: City size, network connectivity and metropolitan functions in Europe. Papers in Regional Science, 95(1), 181–198. https://doi.org/https://doi.org/10.1111/pirs.12181
- Melpezzi, S., & Guo, W. K. (2001). Measuring ‘sprawl’: alternative measures of urban form in US metropolitan areas. The Center for Urban Land Economics Research, University of Wisconsin.
- Parr, J. B. (2004). The polycentric urban region: A closer inspection. Regional Studies, 38(3), 231–240. https://doi.org/https://doi.org/10.1080/003434042000211114
- PBL. (2014). Regional quality of living in Europe. Netherlands Environmental Assessment Agency.
- Peris, A., Meijers, E., & van Ham, M. (2019). The evolution of the system of cities literature since 1995: Schools of thought and their interaction. Networks and Spatial Economics, 18(3), 533–554. https://doi.org/https://doi.org/10.1007/s11067-018-9410-5
- Pumain, D., & Rozenblat, C. (2019). Two metropolisation gradients in the European system of cities revealed by scaling laws. Environment and Planning B, 49(6), 1645–1662. https://doi.org/https://doi.org/10.1177/2399808318785633
- Rauch, J. E. (1993). Productivity gains from geographic concentration of human capital: Evidence from the cities. Journal of Urban Economics, 34(3), 380–400. https://doi.org/https://doi.org/10.1006/juec.1993.1042
- Rauhut, D. (2017). Polycentricity – One concept or many? European Planning Studies, 25(2), 332–348. https://doi.org/https://doi.org/10.1080/09654313.2016.1276157
- Roses, J. R., & Wolf, N. (2019). The economic development of Europe’s regions. A quantitative history since 1900. Routledge.
- Rossi-Hansberg, E., & Wright, M. L. (2007). Urban structure and growth. Review of Economic Studies, 74(2), 597–624. https://doi.org/https://doi.org/10.1111/j.1467-937X.2007.00432.x
- Roth, C., Kang, S. M., Batty, M., & Barthelemy, M. (2011). Structure of urban movements: Polycentric activity and entangled hierarchical flows. PLoS ONE, 6(1), article e15923. https://doi.org/https://doi.org/10.1371/journal.pone.0015923
- Rozenblat, C. (2009). European urban polycentrism: A multiscale typology. Geografica Helvetica, 64(3), 175–185. https://doi.org/https://doi.org/10.5194/gh-64-175-2009
- Scott, T. (2012). The city-state in Europe, 1000–1600. University Press.
- Taubenbock, H., Standfuss, I., Wurm, M., Krehl, A., & Siedentop, S. (2017). Measuring morphological polycentricity – a comparative analysis of urban mass concentrations using remote sensing data. Computers, Environment and Urban Systems, 64, 42–56. https://doi.org/https://doi.org/10.1016/j.compenvurbsys.2017.01.005
- Tsai, Y. H. (2005), Quantifying urban form: Compactness versus ‘sprawl'. Urban Studies, 42(1), 141–161.
- Van Meeteren, M., Poorthuis, A., Derudder, B., & Witlox, F. (2016). Pacifying Babel’s tower: A scientometric analysis of polycentricity in urban research. Urban Studies, 53(6), 1278–1298. https://doi.org/https://doi.org/10.1177/0042098015573455
- Van Raan, A. F. J. (2020). Urban scaling, geography and centrality: Relation with local government structures. PLoS ONE, 15(9), article e0238418. https://doi.org/https://doi.org/10.1371/journal.pone.0238418
- Van Zeben, J., & Bobic, A. (2019). Polycentrism in the European Union. Cambridge University Press.
- Vandermotten, C., Roelandts, M., & Cornut, P. (2007). European polycentrism: Towards a more efficient and/or more equitable development? In N. Cattan (Ed.), Cities and networks in Europe. A critical approach of polycentrism (pp. 51–61). John Libbey Eurotext.
- Veneri, P., & Burgalassi, D. (2012). Questioning polycentric development and its effects: Issues of definition and measurement for the Italian NUTS-2 regions. European Planning Studies, 20(6), 1017–1037. https://doi.org/https://doi.org/10.1080/09654313.2012.673566
- Wang, M., Derudder, B., & Liu, X. (2019). Polycentric urban development and economic productivity in China: A multiscalar analysis. Environment and Planning A. https://doi.org/https://doi.org/10.1177/0308518X19866836.
- Westin, L., & Östhol, A. (1994). Functional networks, Infrastructure and regional mobilization. In Lundqvist, L., & Persson, O. (Eds.), Northern perspectives on European integration (pp. 43–57). NordREFO.
- Zhao, M., Derudder, B., & Huang, J. (2017). Examining the transition processes in the pearl river delta polycentric mega-city region through the lens of corporate networks. Cities, 60(4), 147–155. https://doi.org/https://doi.org/10.1016/j.cities.2016.08.015