
 ?Mathematical formulae have been encoded as MathML and are displayed in this HTML version using MathJax in order to improve their display. Uncheck the box to turn MathJax off. This feature requires Javascript. Click on a formula to zoom.
ABSTRACT
Motivated by reasons such as patients’ needs, lack of resources, technologies or skills, and quality, hospital managers may engage in cooperative behaviours. We study the determinants of patients’ transfers, a specific form of cooperation, and quantify its association with the quality delivered by the origin and destination hospital. Using Italian administrative data, we handle the network structure embedded in the data by adopting an over-dispersed Poisson mixed model. The results show a positive relationship between hospital cooperation and quality. The introduction of transferal protocols that exploit information on hospital quality may further improve the overall quality of the healthcare sector.
INTRODUCTION
In recent years, several central and local governments in Western countries such as the UK and Italy have implemented pro-competition reforms in their healthcare sectors with the view that, as predicted by the economic theory, more competition amongst hospitals, when prices are regulated, would lead to improvements in the quality of healthcare services, ultimately having a positive impact on the health outcomes of the population. While there has been a wide and alive debate among health economists on the effects of competition on hospital quality (Berta et al., Citation2016; Choné, Citation2017; Colla et al., Citation2016; Gaynor, Citation2006; Gaynor et al., Citation2017; Mascia et al., Citation2017; Mukamel et al., Citation2002; Propper et al., Citation2004), more research is needed to evaluate the relationship between cooperative behaviours among healthcare providers and health outcomes. If such cooperation is found to exist and is negatively related to quality, then it would imply that policymakers should put more effort into implementing mechanisms of information diffusion, for example, by making guidelines and comparative information on hospitals quality available to hospital managers. On the other hand, in the case of a positive relationship between cooperation and hospital quality, that is, hospital cooperation associated with better quality on average, then policymakers would be called to intervene in reducing potential geographical inequalities.
Why should economic agents cooperate? Economists have addressed this question with game theory, starting with the example of the prisoner dilemma to more complex dynamic games that find their applications in different areas of applied economics such as trade. Similarly, in the healthcare sector, doctors, economic actors such as nurses, or managers may decide, under certain rules, strategies and payoffs, to cooperate rather than to act independently. Managers from different hospitals, who are motivated by reasons such as patients’ needs, asymmetry in clinical resources, lack of technology, expertise or supplies, may decide to cooperate with the aim of improving the efficiency and health outcomes of their respective organizations (Bosk et al., Citation2011; Gittell & Weiss, Citation2004; Mascia et al., Citation2012). Such cooperation can take various forms, ranging from merging facilities to clinical network information-sharing, joint treatment or joint diagnostic centres, new shared assets and joint construction of new facilities. Informal cooperation between healthcare providers may also take place. This occurs, for example, when we observe the existence of a network between professionals, healthcare providers or the management boards of different hospitals (Westra et al., Citation2017). For example, physicians from any two hospitals may collaborate when treating a patient, thus creating correlations in health indicators across hospitals (Westra et al., Citation2016). However, these networks tend to be predominant within rather than between hospitals (Barnett et al., Citation2011; Landon et al., Citation2012; Pollack et al., Citation2012).
In this paper, we study the network that is generated among healthcare providers when a patient is transferred between any two hospitals. While the decision to transfer a patient is usually driven by the availability of specialized care in the hospital of origin and destination, the choice of the destination hospital may be driven, among other things, by its geographical proximity, demand–supply factors of the hospital of origin and destination, as well as the quality of the hospital of destination relative to that of the hospital of origin (Lomi et al., Citation2014; Mascia et al., Citation2017; Pallotti & Lomi, Citation2011). As regards the latter, this is coherent with the fact that managers typically have some, although not full, information on hospital quality across the territory (see the description of the empirical setting for further details). However, partial asymmetric information between the local/central governments and the hospital managers may induce practitioners to make their choice of transfers based, at least in part, on measures of perceived relative quality (Berta et al., Citation2016). If the relative perceived quality is reflecting the true quality, we should expect that cooperation will improve overall health outcomes of both hospital of origin and destination. On the other hand, if the relative perceived quality is negatively associated with the relative true quality, cooperation may even harm patients in both hospitals. Therefore, policymakers have a strong interest in understanding the drivers underlying these cooperation networks in order to be able to design effective policy interventions, as well as to identify healthcare provider links that may actually improve the health outcome of the transferred patient.
The fact that patient transfer flows can be influenced by hospital quality, since the decision of the referring hospital may be based, among other things, on the relative quality of the destination hospital, creates endogeneity when studying the association between cooperation (patient transfers) and health outcomes. For this reason, in this paper we first identify the determinants of patient flows, including hospital quality, and then study the association between cooperation (patient transfer) and hospital quality (combined between the hospital of origin and of destination) by using a proxy of cooperation, which excludes hospital quality and all the variables possibly correlated with it.
In our paper we make use of network data in two ways: in the first model, we predict patient transfers from other covariates, while in the second model we predict combined hospital quality of origin and destination hospitals from the other covariates. In both cases, the data are count data characterized by inherent dependencies, such as observations associated with the same node or to the same link of the network. Following the literature on social relations models (Hoff, Citation2005; Warner et al., Citation1979), we account for these dependencies by adopting an over-dispersed Poisson mixed model. The model is a more general formulation of the gravity model which is traditionally used in the context of international trade studies (Koskinen & Lomi, Citation2013; Westveld & Hoff, Citation2011). One contribution of this paper is to show how the proposed models could be suitable when handling network data in health economics and health research in general.
For the analyses in this paper, we use data on hospital discharges for over 900,000 patients admitted to 145 hospitals in the Lombardy region of Italy in 2014. Among these patients, around 15,500 (1.7%) were transferred to other hospitals after admission. One advantage of this data set is that it allows one to observe and analyse a large network of hospitals that includes public and private hospitals. Our results show that geographical distance plays an important role in hospital cooperation, although other factors also matter, such as the geographical centrality of a hospital. Another empirical finding is the existence of a positive relationship between hospital cooperation and the overall clinical quality for the hospital of origin and of destination. Introducing transferal protocols that exploit information on hospital quality, such as hospital rankings, may further reduce geographical inequalities across pairs of ‘trading hospitals’, ultimately improving the overall quality of the healthcare sector.
The remainder of the paper is organized as follows. In the next section we review the literature on the determinants of patient flows and the impact of cooperation on hospital quality. In the following section we describe the empirical setting, introducing the Italian national health service (NHS) and the Lombardy healthcare system, which is the focus of our empirical investigation. This section also undertakes an exploratory data analysis of the network of transfers. In the fourth section we predict patient flows from a number of other covariates via an over-dispersed Poisson mixed model. This leads to a proxy of cooperation that does not include quality. We use this in the fifth section to quantify the impact of cooperation on the hospital quality. Finally, we make some concluding remarks and plans for future work.
OVERVIEW OF THE DETERMINANTS OF PATIENT TRANSFERS AND THEIR RELATIONSHIP WITH HOSPITAL QUALITY
The paper by Mackenzie et al. (Citation1997) is considered one of the first attempts to analyse patient transfers between healthcare providers. Using data gathered from a survey performed on 278 intensive care units in the UK, the authors show how descriptive statistics can be used to target allocation of patient transfers. Adopting an exploratory data analysis on Medicare patients in Connecticut, Iwashyna et al. (Citation2009a) find that more critical patients tend to be transferred to high-technology hospitals. Iwashyna et al. (Citation2009b), using network analysis on nationwide US Medicare data, find that patient transfers are not randomly distributed but rather directed to better resourced hospitals. Bosk et al. (Citation2011) adopt semi-structured interviews in three US hospitals and observe that patient transfers are driven by hospital characteristics such as capacity, capabilities and expertise. Further, Iwashyna (Citation2012) emphasizes the importance of high-skilled hospitals, and hospital protocols, when identifying the drivers underlying patients’ transfers.
Other works approach the study of the determinants of patients’ transfer through a regression approach. Lee et al. (Citation2011), using data from hospital discharges in California, find that cancer-specialized hospitals are more likely to receive transfers as well as the hospitals with higher patients volume. Similarly, Lomi and Pallotti (Citation2012) show that high-performing hospitals are less likely to be senders, but rather they are more attractive as receivers. Caimo et al. (Citation2017) show that hospital cooperation requires a considerable level of reliability between partner hospitals. There is a large consensus that geographical distance between hospitals may play an important role in shaping collaborations. As expected, vicinity between providers increases the likelihood of observing a collaboration (Evangelista, Citation2016; Lomi et al., Citation2014; Mascia et al., Citation2012). However, Lee et al. (Citation2011) find that while geographical proximity is related to patients sharing, it only accounts for less than half of the patient-sharing likelihood. Lomi and Pallotti (Citation2012) show that the negative effect of geographical distance on the hospital network significantly drops when controlling for the local dependence structures in which organizations are embedded. Similarly, Caimo et al. (Citation2017) observe that the presence of other forms of collaboration between partners reduces the impact of geographical distance. Analysing the Lazio (Italy) regional healthcare system, Mascia et al. (Citation2017) show that the interaction between geographical and other types of proximity predicts inter-hospital exchanges. The authors suggest that hospital managers should preferably interact with close hospitals that are not too similar in the type of supply factors.
There is also a strand of literature in health economics that uses the gravity model to investigate the determinants of patient flows at regional, local health authority (LHA) or hospital/ward level (Balia et al., Citation2018; Cantarero, Citation2006; Congdon, Citation2001; Fabbri & Robone, Citation2010; Levaggi & Zanola, Citation2004; Mascia et al., Citation2012; Shinjo & Aramaki, Citation2012). For example, Balia et al. (Citation2018) adopt a gravity model to investigate the determinants of patient mobility among Italian regions for the period 2001–10 using data on hospital discharges. They find that income, hospital capacity and the regional technological level are the key drivers of patient regional flows. Congdon (Citation2001), using data on emergency units in 127 electoral wards in North East London and Essex, finds patient age and travel distance to be the main drivers to patient flows. In general, regardless of the level of aggregation of the data used, these studies find that the most important variables explaining patient transfers are geographical distance between healthcare providers, patient characteristics, the capacity of hospitals, the availability of medical technologies and the quality of health services.
Although the studies reviewed above contribute to identifying the determinants of hospital patient transfers, little is known about their relationship with hospital quality. To our knowledge, the first paper to study such a relationship is that by Pallotti and Lomi (Citation2011). They study the behaviour of 91 hospital organizations located in the Lazio healthcare sector. The authors model two measures of hospital efficiency and find that healthcare providers with strong ties and that occupy similar positions in the network tend to reduce their performance gap. Using a panel negative binomial regression on administrative Italian data for 35 hospitals in the region of Abruzzo of Italy, Mascia et al. (Citation2012) conclude that hospitals with better health outcomes are less involved in patients transfers. Still focusing on the Abruzzo healthcare system, Lomi et al. (Citation2014) find, using a multiplicative Cox function, that patients tend to be moved to hospitals providing better quality, and that hospitals tend to move patients from hospitals less capable of managing their capacity to hospitals that are more capable. In addition, Mascia et al. (Citation2015) find that greater network centrality is negatively associated with readmissions. Their multilevel model predicts the quality of a hospital from network-aggregated measures. In contrast to this approach, in our paper we opt to model network data directly. In order to do that, we consider a measure of hospital quality associated with a link of the network by combining the quality of the origin and destination hospitals associated with that link. This will be explained further in the remainder of the paper. In the next section we describe the data and the empirical setting.
EMPIRICAL SETTING
The Lombardy healthcare system
The Italian NHS follows the Beveridge model (Beveridge, Citation1942), providing universal healthcare coverage throughout the country as a single payer. It entitles all citizens, regardless of their social status, to equal access to essential healthcare services. In 1992, a system reform transferred administrative and organizational responsibilities and tasks from the central government to the administrations of the 21 regions in Italy. These regions have now significant autonomy on the revenue side and in organizing services designed to meet the needs of their respective populations.
The Lombardy healthcare system was reformed in 1997 becoming a quasi-market system made up of both public and private providers which are reimbursed by a prospective payment system based on diagnosis-related groups (DRGs) (Berta et al., Citation2010, Citation2013; Brenna, Citation2011). The reimbursement provided to the hospitals for each discharge is defined according to specific DRG tariffs, revised every year by the regional government on the basis of increasing costs due to the introduction of new medical technologies and also taking into account the introduction of new policies. These public regional reimbursements represent the majority of revenues for acute discharges in all hospitals located in Lombardy.
In 2002, the Lombardy government established a quality evaluation programme in order to assess the performance of hospitals in terms of their quality of care. In particular, every year the region estimates, using administrative data, a set of risk-adjusted outcome indicators of quality for each hospital. The region publishes partial results on a web portal to which accredited hospitals can access and see whether their hospital quality is significantly above, not different or significantly below the regional average performance. The intent is to encourage hospitals to perform well and, thus, to promote improvements in healthcare quality. This setting is the reason why we will control for hospital quality in the first stage of our empirical strategy when modelling patient transfers between hospitals. On the other hand, it is worth pointing out that the information received by the managers is only partial, for example, they do not have the full ranking of hospitals. Therefore, as mentioned above, managers may also rely on a perceived measure of relative quality when making their choice of transfers by filling in the information gap.
Hospital administrative data
In this paper we analyse data gathered from the administrative healthcare information system of the Lombardy region, which includes information on patients discharged from 145 hospitals accredited with the regional healthcare system in 2014. This is a very large data set compared with other healthcare systems. Indeed, the data set contains 1,541,996 hospitalizations, of which 84% were ordinary and 16% were in-day hospital or day-surgery. Furthermore, hospitalizations of patients living outside the Lombardy region accounted for 10% of all admissions. The hospital discharge data contain demographic information such as age and gender, information on hospitalization (length of stay, special-care unit use, transfers within the same hospital or through other facilities, and within-hospital mortality), and a total of six diagnosis codes and surgical procedures defined according to the International Classification of Diseases, Ninth Revision, Clinical Modification (ICD-9-CM). Only ordinary hospitalizations for patients aged more than two years were retained in the sample. Furthermore, we exclude all the hospitalizations for palliative care or rehabilitation, the hospitalizations classified as ‘day-hospital’ and the hospitalizations for patients living outside Lombardy as their health outcomes cannot be followed up. As regards hospital quality, we define mortality by the death of the patient in hospital, or within 30 days after the discharge, and define readmission by a patient readmission within 45 days after the discharge and for the same major diagnostic class. Despite the large adoption of these measures in the health economics literature (Berta et al., Citation2016; Kessler & McClellan, Citation2000; Mascia et al., Citation2015; Propper et al., Citation2004, Citation2008; Tay, Citation2003), their choice also introduces a limitation in the study, as discussed by Neuman et al. (Citation2014) and others. Following this literature, we mitigate the heterogeneity within these measures by introducing in our models some adjustment for patient age, gender and DRG weight.
provides a set of descriptive statistics on health outcomes and patient and hospital characteristics, split by hospital ownership (public and private accredited hospitals). Around 45% of the hospitals are private, although they only cover 28% of the hospitalizations. It is interesting to observe that while patient demographic characteristics (age and gender) are similar for private and public hospitals, their case mix is quite different, with private hospitals having a higher DRG weight. In terms of health outcomes, we observe that gross rates are higher in public hospitals compared with the private, with a small difference for readmissions and a bigger gap for mortality. This is not directly related to the quality provided by the two types of providers, but could be more related to the different case mix of patients admitted in public and private hospitals. In terms of hospital characteristics, reports the beds saturation index, or occupancy rate, which is measured by the average number of days when a hospital bed is occupied as a percentage of the available 365 days, and the beds turnover index, which is a measure of the extent of beds’ utilization and is measured by the number of changes in bed occupancy during the year. The statistics show that, considering that public hospitals are on average bigger than private ones (i.e., on average beds capacity is 130 for private hospitals and 229 for public ones), the turnover index is similar between private and public hospitals, while public hospitals have a higher saturation index. Finally, looking at the distance between hospitals, which is measured by the travel time between any two hospitals, shows how public hospitals tend to be on average slightly more distant (approximately 7 min more) than private ones. These variables will be used in the models presented below and explained further within that context.
Table 1. Descriptive statistics of the patient and hospital data, for the variables that will be used in subsequent models. Information is split by hospital ownership.
Exploratory analysis of the network of transfers
As discussed in the introduction, we measure hospital cooperation using the network of patient transfers. In this network each hospital in Lombardy is a node and the edges are the connections between two hospitals with a weight defined by the number of patient transfers between the two hospitals. We define a transfer between hospitals by a patient discharged from one hospital and then admitted in another hospital on the same or the next day (Iwashyna et al., Citation2009b). In order to exclude any patient involvement in this process, we exclude voluntary discharges. Indeed, in the Lombardy healthcare system, patients are free to decide where to be hospitalized, but they do not control the transfer process. However, they can refuse to be transferred, and in such cases the hospital can decide to continue the treatment at their hospital. In all cases, patients are free to leave the hospital against medical advice (Lomi et al., Citation2014).
reports the total number of transfers. We split these further by reporting the number of total transfers from private hospitals and those from public hospitals. This shows how public hospitals are generally more engaged in transferring patients than private hospitals. Furthermore, we describe the network of transfers using various measures of network summaries from the network modelling literature (Kolaczyk & Csárdi, Citation2014), but also considered in the literature of patient flows (Fernández-Gracia et al., Citation2017).
Table 2. Descriptive statistics of the network of patient flows.
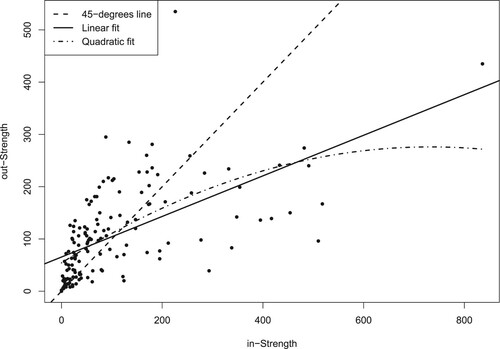
We calculate these measures at the node level and report the mean and standard deviation in Table 2. In particular, we calculate the degree of each node in the network, that is, the number of hospitals from which a given hospital sends/receives transferred patients; the strength or weighted degree of each node, that is, the number of patients received/transferred by a hospital; the closeness of each node, indicating the proximity of each node with the other nodes in terms of the number of steps needed to go from a hospital to the transferring/receiving hospital; and the level of betweenness of a node, quantifying the number of times a hospital is a bridge for the other hospitals in the network. Each measure is calculated using the specific function in the igraph R package (Csárdi & Nepusz, Citation2006) and opting for the normalized version, with the exception of strength. Overall, the results show how the network is rather centralized. Furthermore, it appears that public hospitals are on average more central to the network than private hospitals. The measurements of strength reveal further how the data on the number of transfers present over-dispersion with respect to a Poisson distribution. Moreover, shows a high level of reciprocity in the transfer of patients between hospitals, with a small tendency to send rather than to receive. Overall, this provides an indication of a positive cooperative behaviour between hospitals, potentially away from cream skimming tactics where hospitals dump the patients who are difficult to treat to other competitors (Berta et al., Citation2010; Cheng et al., Citation2015; Levaggi & Montefiori, Citation2003).
Figure 1. In- versus out-strength for each node in the network of patient transfers.
Aside from centrality measures and with a view to finding determinants of patient flows, we next consider approaches to identify possible structures in the network, for example, in the form of partitions of the network where nodes belonging to the same partition are strongly connected among them and sparsely connected with the nodes belonging to different partitions. To this aim, the network of transfers has been analysed using a community detection method. In particular, we consider the method of Blondel et al. (Citation2008), which is highlighted by Yang et al. (Citation2016) in their comparative study, and where partitions are searched based on improvements of the modularity score. shows the optimal partition for the network of transfers, obtained using the multilevel.community function in the igraph R package (Csárdi & Nepusz, Citation2006). shows a strong relationship between the modularity-detected communities and their geographical location.
Figure 2. Map of the hospitals in Lombardy and their belonging to the communities as detected by a modularity-based community detection method on the network of patient transfers.
Note: Each of the nine detected communities is assigned a different symbol. The map also shows the borders between the different municipalities in Lombardy.
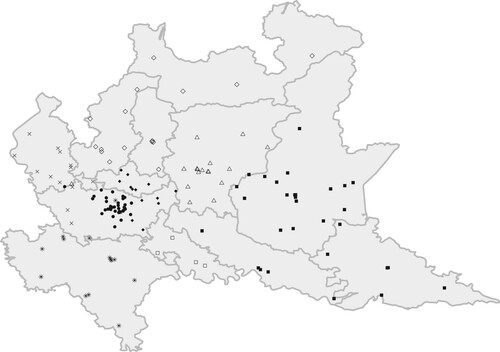
Nine communities are detected and most of them correspond to specific municipalities in Lombardy (e.g., Pavia, Lodi and Bergamo correspond to the orange, red and green communities, respectively). The metropolitan area of Milan, where the most part of the hospitals are located, is characterized by three different communities: the eastern part of Milan shares the community with the municipality of Monza-Brianza (black dots), the western part shares the hospitals with the community of Varese (yellow dots), whereas the central part identifies one single community (blue dots). Finally, two more communities are identified: the first characterized by the presence of the mountains in the north and which includes the municipalities of Sondrio, Como and Lecco (purple dots) and the second characterized by the eastern part of the region and shared by the municipality of Cremona, Mantua and Brescia (azure dots). The community detection approach has shown how both the distance between hospitals and the belonging to the same LHAs are substantial factors in defining the network of hospital transfers. This finding is consistent with the literature (Caimo et al., Citation2017; Lomi & Pallotti, Citation2012; Mascia et al., Citation2012). On the basis of this explorative analysis, we will include both distance and co-memberships to LHAs as determinants of patient transfers in the next analysis. For that purpose, it is also important to emphasize that these determinants are exogenous to the quality of hospitals.
MODELLING PATIENT FLOWS VIA AN OVER-DISPERSED POISSON MIXED MODEL
In order to predict the network of patient transfers from a number of exogenous determinants, we resort to the literature on social relations models (Warner et al., Citation1979), where the statistical dependencies inherent in dyadic data are carefully considered and accounted for. This results in a general class of mixed effect models, where random effects are included in order to control for node effects, which are typical of network data where multiple observations relate to the same node/edge. These models, not previously considered in the healthcare literature, but known in the network modelling literature (Hoff, Citation2005), have been implemented in the amen R package using a Bayesian inferential approach (Hoff et al., Citation2017). Since the dependent variable in our study is discrete, we will extend the existing implementations to the case of an over-dispersed Poisson mixed model.
Going into the details of the model, let be the number of transfers between hospitals
and
. Since the data are in the form of a network, statistical dependencies are to be expected, for example, the fact that data associated with the same hospital of origin
(i.e., a row of the matrix of transfers) or with the same destination hospital
(i.e., a column of the matrix of transfers) may be more similar to each other than to the rest of the observations. We model these dependencies using the mixed model:
(1)
(1) where the errors have the following dependency structure:
with
and
,
, the random effects for the sender and receiver hospitals, respectively, and
the errors, with effects otherwise being independent. This model induces a covariance among the
given by:
where
represents the correlation of observations having a common hospital sender, whereas
defines the dependence of observations having a common hospital receiver. Since the network is asymmetric,
measures the ‘reciprocity’ between sender and receiver hospitals, that is, the dyadic correlation between the number of transfers from
to
and those from
to
. In addition,
accounts for over-dispersion: indeed when
is 0, the model is a simple Poisson mixed model, whereas when
increases, the conditional variance of
becomes larger than the mean. Thus, it represents a simple adaptation of the model to account for over-dispersion, similar to more commonly used negative binomial models (Mascia et al., Citation2015), which, in our setting, would require multiplying the expected rate of the Poisson model by a random effect with a gamma distribution.
Several covariates are included in the model in equation (1), at both the node and dyadic levels. In line with the literature (Mascia et al., Citation2012, Citation2015), we include in the model the dyadic covariates of geographical distance between two hospitals () and their co-membership (CM). Distance is measured in effective time travel and is computed using Google Maps, that is, by considering the fastest route by car from an origin to a destination hospital. Measuring distance by time travel allows one to account for several constraints, such as topography or traffic, that may be considered by the origin hospital in its decision of transferring patients (Kitts et al., Citation2017). Co-membership identifies whether two hospitals share the same LHA (Kitts et al., Citation2017; Mascia et al., Citation2015; Mascia & Di Vincenzo, Citation2011). We also control for the degree centrality (
) of both origin (
) and destination (
) hospital. This is measured based on a geographical network where two hospitals are linked if they are less than 30 min of effective time travel apart. This variable allows one to adjust the predictions for the hospitals’ concentration in a predefined area, the hypothesis being that a higher value of this index for the origin hospital indicates a wider choice set for the hospital that needs to decide where to transfer a patient, and similarly for the destination hospital. We also include in the model the betweenness index (
), calculated for each node of the geographical network and rescaled to a minimum of 0 and a maximum of 1. In terms of hospital or node-based characteristics, we control for the number of discharges of both the sender and receiver hospitals (
), the hospital beds saturation (
: average percentage of beds occupied in hospitals) and hospital beds turnover indices (
: average admission per bed in hospitals), in order to measure the beds capacity of a hospital and the efficiency in using beds (Lomi et al., Citation2014; Mascia et al., Citation2017). In addition we account for the severity of the patients treated in a hospital by including both the variable DRG weight (
), taken also as a measure of resources that the hospital employs to treat patients (Berta et al., Citation2013), and patient age (
), measured as an average at the hospital level. Similarly, we control for the patient hospital mix in terms of gender composition by including in the model the percentage of female patients in a hospital (
). Furthermore, we include specific hospital characteristics for both sender and receiver hospitals, namely whether or not the hospital is a teaching hospital (variable Teach), if it is a monospecialized or a general hospital (variable Mono) and if the hospital is highly equipped or not in terms of technology (variable Techno). As for the latter, since we do not have specific information on technological equipment for each hospital, we control for the role of technology via a dummy variable that identifies the presence or not of an intensive care unit (Berta et al., Citation2016). The inclusion of these variables is based on an expectation that hospitals with university affiliations and/or advanced technological capacity may be more likely to accept transfers (Iwashyna et al., Citation2009a; Mascia & Di Vincenzo, Citation2011; Mascia et al., Citation2015). Moreover, we control for hospital ownership (variable Public) in order to adjust for potential different behaviours in patient’s transfer between private and public hospitals (Mascia & Di Vincenzo, Citation2011). Finally, we consider two variables measuring the hospital quality: adjusted mortality (
) and adjusted 45-days readmissions (
). The risk-adjusted outcomes, mortality and readmission are obtained by applying a multilevel model (Goldstein & Spiegelhalter, Citation1996) where the dependent variable is the observed outcome and the adjustment is obtained by including patients’ covariates such as: sex, age and up to 30 co-morbidities calculated using the Elixahuser procedure (Elixhauser et al., Citation1998). We opt for the Elixahuser index, rather than Charlson index (Charlson et al., Citation1994), because it is usually adopted by the Lombardy Health Authority when conducting hospital quality evaluation.
We estimate the parameters of the model in equation (1) via a Bayesian inferential procedure, based on an Markov chain Monte Carlo (MCMC) algorithm which adapts the implementation in the ame function of the amen R-package (Hoff et al., Citation2017) to the case of a Poisson-distributed dependent variable. We use a burn-in window of 1000 iterations, followed by 10,000 iterations, where we save the estimated parameters every 25th iteration. shows the posterior mean estimates of the parameters.
Table 3. Posterior means of estimates and standard errors for the model of patient transfers in equation (1).
The variable geographical distance shows that the shorter the distance between two hospitals, the higher the number of transfers. This was to be expected from our earlier exploratory analysis (), despite the high density of hospitals in Lombardy. Similarly, as expected, the co-membership of the hospitals increases the patient flows between hospitals. These associations are also reported by other studies (Caimo et al., Citation2017; Landon et al., Citation2012; Mascia et al., Citation2012, Citation2017) and explained by the fact that low distance is typically preferred by hospitals in the transfer of a patient in order to reduce the costs for travelling and the risks to the patient associated with the transfer (Iwashyna, Citation2012). The positive and significant relationship between the degree centrality and the transfers indicates that when the set of opportunities for transferring/receiving patients increases, the hospitals tend to transfer/receive more patients. In order to check for the robustness of this result, we have repeated the analysis using degree centrality indices based on several thresholds of the distances (between 20 and 40 min). We have observed a correlation of over 0.90 among the predicted values across these different thresholds, suggesting a robustness of this finding. Finally, adjusting for hospital discharges proves to be important when explaining the variation in patient flows (Lee et al., Citation2011).
With regard to patient characteristics, the analysis suggests that the demographic characteristics of the average patient in a hospital, such as age and gender, do not have a significant impact on the number of patient transfers, whereas the severity of their conditions and the ability of the hospitals in managing beds have a significant impact on the number of patient transfers. In terms of other hospital characteristics, we find that being a destination teaching hospital increases the transfers, and, similarly, being a technological hospital is positively related to the transfers for both origin and destination hospitals. This might suggest that hospitals with a low level of technology may decide to move complicated patients to technological hospitals in order to provide for, say, a cardiosurgical intervention, but the patients are likely to be moved back to the previous hospital once they overcome the critical post-surgical phase. In this way, the patient receives necessary assistance, releasing the bed in the technological hospital for a new hospitalization. Finally, the variables attached to hospital quality do not seem to play a role in explaining patient flows, most likely due to the fact that hospital managers in the Lombardy Region do not fully know the distribution of quality across the healthcare system.
The inference also provides a quantification of the level of dependencies in the data: in particular, the relatively large value of the parameter suggests a high correlation of the two observations associated with the same edge in the network and thus a high level of reciprocity between connected hospitals, as noticed also in our exploratory analysis (). The same can be said for
and
, whose large values suggest the presence of row and column effects. These findings support the need for the use of more advanced mixed effect models in our study.
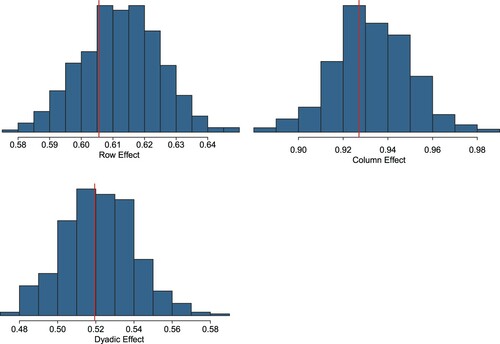
A number of checks are further conducted to measure the goodness of fit of the model. In particular, we compare some suitably defined summary statistics of the observed network with the same statistics calculated from the predicted network generated at each iteration of the MCMC algorithm. In more detail, we consider three network statistics from a given network: (1) the standard deviation of the row means; (2) the standard deviation of the column means; and (3) the within-dyad correlation. The histograms in represent the posterior predictive distribution from the MCMC inference, which are to be compared with the vertical lines representing the values of the statistics on the observed network. shows a good fit of the model, with the observed statistics lying at the centre of the corresponding posterior distributions from the model.
Figure 3. Posterior predictive goodness of fit for the model in equation (1).
MEASURING THE IMPACT OF COOPERATION ON HOSPITAL QUALITY
As explained in the introduction we are interested in assessing whether cooperation between hospitals has a positive, negative or null effect on overall quality in a healthcare system. In our study, quality is measured in terms of hospital effectiveness using both mortality and readmission, which are the most adopted outcomes in the healthcare literature on hospital quality. Mortality is defined by a variable assuming value 1 if the patient dies in hospital or within 30 days after the discharge, and 0 otherwise, whereas readmission is measured by a binary variable equal to 1 if the patient is readmitted to the same hospital or to another hospital within 45 days from a discharge and for the same clinical condition.
Using the model described in the previous section (equation 1) we obtain the predicted transfers, , which are now predicted from a set of covariates not related to the hospital quality. In addition, in order to avoid further problems of endogeneity,
is calculated excluding the hospital random effects because these can be related to characteristics such as the teaching status or the hospital specialization (cardiological hospital, neurological hospital, etc.), which can affect hospital quality. We then relate these predicted transfers with the overall quality for a pair of hospitals
and
, which we measure by:
(2)
(2) where
and
represent the mortality/readmission of the pair of hospitals
and
, respectively.
We decided to adopt a measure of overall quality instead of a measure of mortality or readmissions split by sender and receiver hospitals for several reasons. Firstly, it allows us to keep the transfers in the model as a dyadic variable without having to aggregate the network of transfers at a node level, as, for example, done by Mascia et al. (Citation2015). Secondly, it fits more closely with our objective as we are interested in estimating the impact of cooperation on the overall quality of the healthcare system. In fact, if a hospital sends a patient with a very high risk of mortality or readmission to another hospital and the patient dies or is thereafter readmitted, this increases the mortality and the readmission of the receiver but does not impact on the quality of the pair, since the patient would have most likely died or been readmitted in the hospital from which he/she was transferred. Thus, considering the overall mortality/readmission allows us to take into account the effect of the cooperation between hospitals on the overall quality of both the sender and receiver hospitals, which is at its lowest when both outcomes are being reduced. On the other hand, choosing to add the two outcome measures may mask a high level of heterogeneity in the individual outcomes of a pair of cooperating hospitals, with one of the two hospitals systematically benefiting from the other in the cooperation. While the exploratory analysis in showed a high level of reciprocity in the number of transfers, further supported by the positive value from the previous model (
), it is yet difficult to fully disentangle a positive from a negative transfer process (Cheng et al., Citation2015). As a further indication of a positive cooperative behaviour, we perform a t-test on the mean difference of (adjusted) mortality and readmission between pairs in the network that cooperate with each other (
) versus those that do not cooperate with each other (
). The results of this analysis (mortality: p-value = 0.0628; readmission: p-value = 0.7530) show little evidence of heterogeneity in the outcome measures of cooperating hospitals, further supporting our choice of an additive dyadic outcome measure.
Since the dependent variable defined in equation (2) is in the form of counts, we use the same over-dispersed Poisson mixed effect framework used before. In particular, we consider the following model:
(3)
(3) where
,
is the hospital random effect which is now drawn from the same distribution for the origin and destination hospitals, since
is now symmetric (as
). This also means that there is no ‘reciprocity’ parameter
in this model, as there is only one observation associated with each link. As with the model in equation (1), we assume
in order to capture a potential over-dispersion in the conditional distribution of the dependent variable.
The coefficient in equation (3) is of interest in order to assess the impact of cooperation on hospital quality. The model is also scaled by the overall discharges of the hospitals’ pair (
), now taken as the average of the discharges between the two corresponding hospitals since the dependent variable is symmetric, as well as by a number of other variables typically used in healthcare evaluations (Berta et al., Citation2013, Citation2016; Mascia et al., Citation2015; Peluso et al., Citation2016). In particular, we consider the patient age (
), the DRG weight (
) and gender (
), all calculated as averages of the two connected hospitals. Moreover, we consider the hospital ownership (
), which is defined as a dyadic variable taking values public–public, private–private, public–private, respectively. Similarly, we also include dyadic covariates to control for the teaching status of the hospital pair (Teach), their status as monospecialized or general hospitals (Mono) and their status as technological hospitals (Techno). As with ownership, these variables are defined as categorical variables, taking three possible values.
shows the results of the model described in equation (3) using the same MCMC settings as those used for model (1). These results form the core of the paper, where we analyse the effect of cooperation between hospitals on the quality of the healthcare system. The analysis shows a negative and significant effect for the predicted transfers on the health outcomes, for both mortality and readmissions. This means that the higher the cooperation between a pair of hospitals, the higher is the quality for the two associated hospitals, thus suggesting a positive impact of inter-organizational cooperation to the healthcare system. In particular, the parameters for the predicted transfers indicate that an increase of one patient transfer produces a reduction of 1.9% in the average mortality and of 2.2% in readmissions.
Table 4. Modelling the effect of the network of patient flows on the risk-adjusted mortality of the healthcare system.
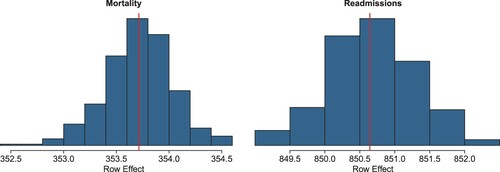
Finally, shows a good fit of the models, both for the case of mortality and readmission, with a good match between observed and predicted summary statistics.
Figure 4. Posterior predictive goodness of fit for the model in equation (3).
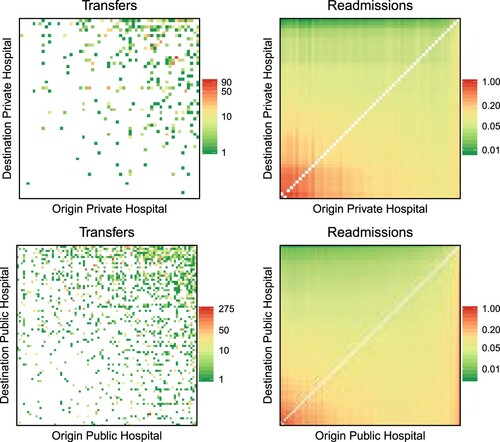
As a final step in the analysis, and considering some differences that were previously observed between private and public hospitals, we investigate whether the impact of cooperation on quality is different according to hospital ownership. To this aim, we add to equation (3) an interaction term between predicted transfers and the hospital ownership. The results of this analysis are presented visually in and . In both, the heatmaps on the left represent the observed transfers between hospitals pairs sharing the same ownership (private versus private on top and public versus public at the bottom), whereas the heatmaps on the right show the expected hospital performance (mortality in , readmission in ) predicted by the model in equation (3) and scaled by the number of discharges of the hospitals pairs. In simple terms, a point in the left heatmap corresponds to a pair of connected hospitals, with the colour indicating the amount of cooperation (transfers in the formulae) between the hospital of origin (x-axis) and the hospital of destination (y-axis), whereas the corresponding point on the right heatmap is coloured according to the combined mortality/readmission rate of the associated pair of hospitals (
). In order to improve visualization, hospital pairs are sorted according to the value of predicted mortality and readmission for the pair, so that higher values of predicted outcomes are in the bottom left corner of the right heatmap, and vice versa for the lower values. The same ordering is then applied to the left heatmaps. We observe from both analyses how public hospitals are more engaged in cooperation than private ones (a more ‘coloured’ left heatmap for public hospitals), and how, in both cases, cooperation is effective in improving quality, that is, in reducing mortality and readmission (higher mortality/readmission rates in the bottom left corner of the right heatmaps correspond to little to no cooperation visible in the left heatmaps for the same corner).
Figure 5. Effect of patient transfers on the predicted overall mortality.
Note: Hospitals in the heatmaps are sorted by the number of discharges, and the shades of the points are defined in the log-scale, except for the null transfers where the points are white.
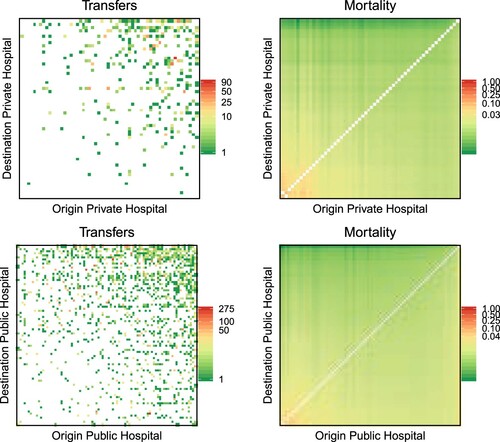
Figure 6. Effect of patient transfers on the predicted overall readmission.
Note: Hospitals in the heatmaps are sorted by the number of discharges, and the shades of the points are defined in the log-scale, except for the null transfers where the points are white.
DISCUSSION AND CONCLUSIONS
In this paper we have focused on transfers of patients between hospitals as a form of cooperation. We have explored the impact on patient transfers of a set of demand–supply factors, distance-based centrality measures as well as measures of hospital quality. Following the literature on social relations models, we have adopted an over-dispersed Poisson mixed regression model (Hoff, Citation2005; Warner et al., Citation1979), that includes both random effects related to the sender and the receiver hospital as well as a reciprocity effect among them. One contribution of this paper was to show how these empirical models could be suitable when handling network data in health economics and health research in general.
Our empirical results () conform well with existing findings that geographical distance plays an important role in explaining cooperation between managers see, among others, (Baltagi et al., Citation2018; Lomi et al., Citation2014; Mascia et al., Citation2017): ceteris paribus the shorter the distance between hospitals, the higher the number of transfers. One plausible explanation for this result is that there are risks and transportation costs associated with patient transfers (Iwashyna, Citation2012). That geography plays an important role is also confirmed in our analysis by the identification of communities in the network of transfers that have a clear geographical structure (). This analysis further shows how the local patterns of spatial interaction may be more complex than simple contiguity measures, which are typically used in the healthcare literature and defined based on LHAs or municipalities boundaries. This result could motivate policymakers to develop protocols and interventions that are based on alternative measures that go beyond rigid administrative boundaries.
Our analysis finds also that geographical centrality helps in explaining the flows of transfers: ceteris paribus, the higher the number of opportunities where to send/receive patients, the higher is the number of patients transferred to/received by a specific hospital. We also find that the intensity of cooperation between hospitals does not depend on hospital quality. One explanation for this result is that managers are provided only with partial information on the distribution of hospital quality across territory. This may exacerbate the impact on their decisions of a relative perception of quality and of information that is gathered informally (Landon et al., Citation2012). A further explanation is the lack of adequate health outcome indicators to proxy healthcare quality. Finally, there might be significant heterogeneity across networks for specific health conditions that is not captured by our global analysis.
In the second stage of the analysis, we assess how cooperation between hospitals may be associated with the overall clinical quality for the hospital of origin and of destination involved in transfer of a patient. To the best of our knowledge, this is the first attempt of considering simultaneously the outcomes of both hospitals involved in the transfer. This in turn allows us to analyse the effect of the transfers on the patients’ outcomes in the overall hospital network. One main challenge, when studying this relation, is the potential endogeneity between transfers and quality. Indeed, as we have shown in the first analysis, the decision of transferring a patient to a specific hospital is informed, among other things, by variables possibly correlated to the quality of the origin and destination hospitals. For this reason, we derive an exogenous measure of transfers (cooperation) and then use this to quantify its effect on the quality of the healthcare system. When taking care of the endogeneity of cooperation, we find a positive relationship between hospital cooperation and the overall quality of the connected hospitals. This is the case both for private and public hospitals, though it is found to be more pronounced for public hospitals.
The absence of a source of information on the quality of hospitals accessible to all providers, such as in the form of star ratings, may prevent some hospitals to engage with others, with some missing the opportunity to cooperate with higher quality hospitals. This may result in a lower degree of cooperation among hospitals and a loss of overall quality. However, this asymmetric information may also prevent patients from choosing high quality providers (Berta et al., Citation2016; Moscone et al., Citation2012). In other words, we would have expected a reduction in the transfers between hospitals, had the patients known where to be hospitalized in the first instance. Thus, the transfers of patients can be seen as an informal mechanism available in the market to adjust ex-post for such distortion. In general, even in the absence of asymmetric information of the distribution of hospital quality, given that some patients will not be able to choose the hospital where to be admitted to (e.g., the urgent cases), effective cooperation between hospitals may prove crucial in increasing the likelihood of survival for patients. Indeed, as highlighted by Iwashyna (Citation2012) working on inter hospital transfers is a clear opportunity to improve patient outcomes. Towards this end, policymakers (the Lombardy Region in the case study of this paper) could design a data set for facilitating matching between providers in order make cooperation more prompt and effective (Pallotti & Lomi, Citation2011).
The results described in this paper should be considered in light of several limitations. Firstly, the data used in this paper is cross-sectional. Further work should consider the use of longitudinal data to explore the spatio-temporal dimension of this phenomenon. Future work is also needed in order to better assess the impact of hospital cooperation on quality. For instance, within the category of private hospitals there are for-profit and not-for-profit organizations, with the latter being closer to the mission of the public sector. For this reason, future work should investigate whether this result will still hold when considering for-profit hospitals. Moreover, future work should also explore different ways to measure the degree of cooperation between healthcare providers. For example, it could be of interest to measure cooperation by the scientific collaboration among professionals in different hospitals, which could be derived by the scientific works published jointly by physicians operating in different hospitals. Finally, our study of the association between hospital quality and cooperation is based on a specific choice of measures for quantifying health outcomes. Although several works in the literature of health economics use mortality and readmissions as quality indicators (e.g., Kessler & McClellan, Citation2000; Tay, Citation2003; Propper et al., Citation2004, Citation2008; Berta et al., Citation2016), there is growing evidence that these outcomes alone cannot capture hospital differences in the treatment provided to patients (Neuman et al., Citation2014).
Despite these limitations, this study represents one of the first attempts to quantify the association between hospital cooperation and the quality of healthcare, exploiting a rich source of administrative micro-data and using network science approaches that are innovative in health economics.
ACKNOWLEDGEMENT
The earlier version of this paper appeared as a working paper at https://arxiv.org/abs/1911.04168. All the authors contributed equally to this work.
DISCLOSURE STATEMENT
No potential conflict of interest was reported by the authors.
Additional information
Funding
REFERENCES
- Balia, S., Brau, R., & Marrocu, E. (2018). Interregional patient mobility in a decentralized healthcare system. Regional Studies, 52(3), 388–402. https://doi.org/10.1080/00343404.2017.1307954
- Baltagi, B. H., Moscone, F., & Santos, R. (2018). Spatial health econometrics. In B. H. Baltagi & F. Moscone (Eds.), Health econometrics (Contributions to Economic Analysis Vol. 294, 13, pp. 304–324). Emerald.
- Barnett, M. L., Landon, B. E., O’Malley, A. J., Keating, N. L., & Christakis, N. A. (2011). Mapping physician networks with self-reported and administrative data. Health Services Research, 46(5), 1592–1609. https://doi.org/10.1111/j.1475-6773.2011.01262.x
- Berta, P., Callea, G., Martini, G., & Vittadini, G. (2010). The effects of upcoding, cream skimming and readmissions on the Italian hospitals efficiency modelling: A population-based investigation. Economic Modelling, 27(4), 812–821. https://doi.org/10.1016/j.econmod.2009.11.001
- Berta, P., Martini, G., Moscone, F., & Vittadini, G. (2016). The association between asymmetric information, hospital competition and quality of healthcare: Evidence from Italy. Journal of the Royal Statistical Society: Series A (Statistics in Society), 179(4), 907–926. https://doi.org/10.1111/rssa.12214
- Berta, P., Seghieri, C., & Vittadini, G. (2013). Comparing health outcomes among hospitals: The experience of the Lombardy region. Health Care Management Science, 16(3), 245–257. https://doi.org/10.1007/s10729-013-9227-1
- Beveridge, W. H. (1942). Social insurance and allied services. HMSO.
- Blondel, V. D., Guillaume, J.-L., Lambiotte, R., & Lefebvre, E. (2008). Fast unfolding of communities in large networks. Journal of Statistical Mechanics: Theory and Experiment, 2008(10), P10008. https://doi.org/10.1088/1742-5468/2008/10/P10008
- Bosk, E. A., Veinot, T., & Iwashyna, T. J. (2011). Which patients, and where: A qualitative study of patient transfers from community hospitals. Medical Care, 49(6), 592–598. https://doi.org/10.1097/MLR.0b013e31820fb71b
- Brenna, E. (2011). Quasi-market and cost-containment in Beveridge systems: The Lombardy model of Italy. Health Policy, 103(2), 209–218. https://doi.org/10.1016/j.healthpol.2011.10.003
- Caimo, A., Pallotti, F., & Lomi, A. (2017). Bayesian exponential random graph modelling of interhospital patient referral networks. Statistics in Medicine, 36(18), 2902–2920. https://doi.org/10.1002/sim.7301
- Cantarero, D. (2006). Health care and patients’ migration across Spanish regions. The European Journal of Health Economics, 7(2), 114–116. https://doi.org/10.1007/s10198-006-0341-6
- Charlson, M., Szatrowski, T. P., Peterson, J., & Gold, J. (1994). Validation of a combined comorbidity index. Journal of Clinical Epidemiology, 47(11), 1245–1251. https://doi.org/10.1016/0895-4356(94)90129-5
- Cheng, T. C., Haisken-DeNew, J. P., & Yong, J. (2015). Cream skimming and hospital transfers in a mixed public–private system. Social Science & Medicine, 132, 156–164. https://doi.org/10.1016/j.socscimed.2015.03.035
- Choné, P. (2017). Competition policy for health care provision in France. Health Policy, 121(2), 111–118. https://doi.org/10.1016/j.healthpol.2016.11.015
- Colla, C., Bynum, J., Austin, A., & Skinner, J. (2016). Hospital competition, quality, and expenditures in the US Medicare population (Technical Report). National Bureau of Economic Research (NBER).
- Congdon, P. (2001). The development of gravity models for hospital patient flows under system change: A Bayesian modelling approach. Health Care Management Science, 4(4), 289–304. https://doi.org/10.1023/A:1011894312001
- Csárdi, G., & Nepusz, T. (2006). The igraph software package for complex network research. InterJournal Complex Systems, 1695, 1–9.
- Elixhauser, A., Steiner, C., Harris, D. R., & Coffey, R. M. (1998). Comorbidity measures for use with administrative data. Medical Care, 36(1), 8–27. https://doi.org/10.1097/00005650-199801000-00004
- Evangelista, V. (2016). The geographics of patients transfers: The case of an Italian regional health system. GeoJournal, 81(5), 771–778. https://doi.org/10.1007/s10708-015-9662-2
- Fabbri, D., & Robone, S. (2010). The geography of hospital admission in a national health service with patient choice. Health Economics, 19(9), 1029–1047. https://doi.org/10.1002/hec.1639
- Fernández-Gracia, J., Onnela, J., Barnett, M., Eguíluz, V., & Christakis, N. (2017). Influence of a patient transfer network of US inpatient facilities on the incidence of nosocomial infections. Scientific Reports, 7(1), 2930. https://doi.org/10.1038/s41598-017-02245-7
- Gaynor, M. (2006). What do we know about competition and quality in health care markets? (Working Paper 12301). National Bureau of Economic Research (NBER).
- Gaynor, M., Mostashari, F., & Ginsburg, P. B. (2017). Making health care markets work: Competition policy for health care. JAMA, 317(13), 1313–1314. https://doi.org/10.1001/jama.2017.1173
- Gittell, J. H., & Weiss, L. (2004). Coordination networks within and across organizations: A multi-level framework. Journal of Management Studies, 41(1), 127–153. https://doi.org/10.1111/j.1467-6486.2004.00424.x
- Goldstein, H., & Spiegelhalter, D. (1996). League table and their limitations: Statistical issues in comparisons of institutional performance (with discussion). Journal of the Royal Statistical Society. Series A (Statistics in Society), 159(5), 385–443. https://doi.org/10.2307/2983325
- Hoff, P., Fosdick, B., Volfovsky, A., & He, Y. (2017). AMEN: Additive and multiplicative effects models for networks and relational data. R package (version 1.3).
- Hoff, P. D. (2005). Bilinear mixed-effects models for dyadic data. Journal of the American Statistical Association, 100(469), 286–295. https://doi.org/10.1198/016214504000001015
- Iwashyna, T., Christie, J., Kahn, J., & Asch, D. (2009a). Uncharted paths: Hospital networks in critical care. Chest, 135(3), 827–833. https://doi.org/10.1378/chest.08-1052
- Iwashyna, T., Christie, J., Moody, J., Kahn, J., & Asch, D. (2009b). The structure of critical care transfer networks. Medical Care, 47(7), 787–793. https://doi.org/10.1097/MLR.0b013e318197b1f5
- Iwashyna, T. J. (2012). The incomplete infrastructure for interhospital patient transfer. Critical Care Medicine, 40(8), 2470–2478. https://doi.org/10.1097/CCM.0b013e318254516f
- Kessler, D. P., & McClellan, M. B. (2000). Is hospital competition socially wasteful? The Quarterly Journal of Economics, 115(2), 577–615. https://doi.org/10.1162/003355300554863
- Kitts, J. A., Lomi, A., Mascia, D., Pallotti, F., & Quintane, E. (2017). Investigating the temporal dynamics of interorganizational exchange: Patient transfers among Italian hospitals. American Journal of Sociology, 123(3), 850–910. https://doi.org/10.1086/693704
- Kolaczyk, E., & Csárdi, G. (2014). Statistical analysis of network data with R. Springer.
- Koskinen, J., & Lomi, A. (2013). The local structure of globalization. Journal of Statistical Physics, 151(3), 523–548. https://doi.org/10.1007/s10955-013-0732-x
- Landon, B. E., Keating, N. L., Barnett, M. L., Onnela, J.-P., Paul, S., O’Malley, A. J., Keegan, T., & Christakis, N. A. (2012). Variation in patient-sharing networks of physicians across the United States. Jama, 308(3), 265–273. https://doi.org/10.1001/jama.2012.7615
- Lee, B. Y., McGlone, S. M., Song, Y., Avery, T. R., Eubank, S., Chang, C.-C., Bailey, R. R., Wagener, D. K., Burke, D. S., Platt, R., & Huang, S. S. (2011). Social network analysis of patient sharing among hospitals in Orange County, California. American Journal of Public Health, 101(4), 707–713. https://doi.org/10.2105/AJPH.2010.202754
- Levaggi, R., & Montefiori, M. (2003). Horizontal and vertical cream skimming in the health care market (DISEFIN Working Paper 11/2003).
- Levaggi, R., & Zanola, R. (2004). Patients’ migration across regions: The case of Italy. Applied Economics, 36(16), 1751–1757. https://doi.org/10.1080/0003684042000227903
- Lomi, A., Mascia, D., Vu, D. Q., Pallotti, F., Conaldi, G., & Iwashyna, T. J. (2014). Quality of care and interhospital collaboration: A study of patient transfers in Italy. Medical Care, 52(5), 407–414. https://doi.org/10.1097/MLR.0000000000000107
- Lomi, A., & Pallotti, F. (2012). Relational collaboration among spatial multipoint competitors. Social Networks, 34(1), 101–111. https://doi.org/10.1016/j.socnet.2010.10.005
- Mackenzie, P. A., Smith, E. A., & Wallace, P. G. (1997). Transfer of adults between intensive care units in the United Kingdom: Postal survey. BMJ, 314(7092), 1455–1455. https://doi.org/10.1136/bmj.314.7092.1455
- Mascia, D., Angeli, F., & Di Vincenzo, F. (2015). Effect of hospital referral networks on patient readmissions. Social Science & Medicine, 132, 113–121. https://doi.org/10.1016/j.socscimed.2015.03.029
- Mascia, D., & Di Vincenzo, F. (2011). Understanding hospital performance: The role of network ties and patterns of competition. Health Care Management Review, 36(4), 327–337. https://doi.org/10.1097/HMR.0b013e31821fa519
- Mascia, D., Di Vincenzo, F., & Cicchetti, A. (2012). Dynamic analysis of interhospital collaboration and competition: Empirical evidence from an Italian regional health system. Health Policy, 105(2), 273–281. https://doi.org/10.1016/j.healthpol.2012.02.011
- Mascia, D., Pallotti, F., & Angeli, F. (2017). Don’t stand so close to me: Competitive pressures, proximity and inter-organizational collaboration. Regional Studies, 51(9), 1348–1361. https://doi.org/10.1080/00343404.2016.1185517
- Moscone, F., Tosetti, E., & Vittadini, G. (2012). Social interaction in patients’ hospital choice: Evidence from Italy. Journal of the Royal Statistical Society: Series A (Statistics in Society), 175(2), 453–472. https://doi.org/10.1111/j.1467-985X.2011.01008.x
- Mukamel, D. B., Zwanziger, J., & Bamezai, A. (2002). Hospital competition, resource allocation and quality of care. BMC Health Services Research, 2(1), 10. https://doi.org/10.1186/1472-6963-2-10
- Neuman, M. D., Wirtalla, C., & Werner, R. M. (2014). Association between skilled nursing facility quality indicators and hospital readmissions. JAMA, 312(15), 1542–1551. https://doi.org/10.1001/jama.2014.13513
- Pallotti, F., & Lomi, A. (2011). Network influence and organizational performance: The effects of tie strength and structural equivalence. European Management Journal, 29(5), 389–403. https://doi.org/10.1016/j.emj.2011.02.005
- Peluso, A., Berta, P., & Vinciotti, V. (2016). Do pay-for-performance incentives lead to a better health outcome? Empirical Economics, 56(6), 2167–2184. https://doi.org/10.1007/s00181-018-1425-8
- Pollack, C. E., Weissman, G., Bekelman, J., Liao, K., & Armstrong, K. (2012). Physician social networks and variation in prostate cancer treatment in three cities. Health Services Research, 47(1pt2), 380–403. https://doi.org/10.1111/j.1475-6773.2011.01331.x
- Propper, C., Burgess, S., & Gossage, D. (2008). Competition and quality: Evidence from the NHS internal market 1991–9. The Economic Journal, 118(525), 138–170. https://doi.org/10.1111/j.1468-0297.2007.02107.x
- Propper, C., Burgess, S., & Green, K. (2004). Does competition between hospitals improve the quality of care?: Hospital death rates and the NHS internal market. Journal of Public Economics, 88(7), 1247–1272. https://doi.org/10.1016/S0047-2727(02)00216-5
- Shinjo, D., & Aramaki, T. (2012). Geographic distribution of healthcare resources, healthcare service provision, and patient flow in Japan: A cross sectional study. Social Science & Medicine, 75(11), 1954–1963. https://doi.org/10.1016/j.socscimed.2012.07.032
- Tay, A. (2003). Assessing competition in hospital care markets: The importance of accounting for quality differentiation. The RAND Journal of Economics, 34(4), 786–814. https://doi.org/10.2307/1593788
- Warner, R. M., Kenny, D. A., & Stoto, M. (1979). A new round robin analysis of variance for social interaction data. Journal of Personality and Social Psychology, 37(10), 1742–1757. https://doi.org/10.1037/0022-3514.37.10.1742
- Westra, D., Angeli, F., Carree, M., & Ruwaard, D. (2017). Understanding competition between healthcare providers: Introducing an intermediary inter-organizational perspective. Health Policy, 121(2), 149–157. https://doi.org/10.1016/j.healthpol.2016.11.018
- Westra, D., Angeli, F., Jatautaite, E., Carree, M., & Ruwaard, D. (2016). Understanding specialist sharing: A mixed-method exploration in an increasingly price-competitive hospital market. Social Science and Medicine, 162, 133–142. https://doi.org/10.1016/j.socscimed.2016.06.019
- Westveld, A. H., & Hoff, P. D. (2011). A mixed effects model for longitudinal relational and network data, with applications to international trade and conflict. The Annals of Applied Statistics, 5(2A), 843–872. https://doi.org/10.1214/10-AOAS403
- Yang, Z., Algesheimer, R., & Tessone, C. J. (2016). A comparative analysis of community detection algorithms on artificial networks. Scientific Reports, 6(1), 30750. https://doi.org/10.1038/srep30750