
 ?Mathematical formulae have been encoded as MathML and are displayed in this HTML version using MathJax in order to improve their display. Uncheck the box to turn MathJax off. This feature requires Javascript. Click on a formula to zoom.
ABSTRACT
This study proposes and tests an operational framework to examine the significance of resilience and the related concept of vulnerability, for labour market efficiency, in the context of regional competitiveness. The performance of European regional labour markets is analysed, compared and assessed using a methodology based on principal component analysis with regression modelling and decision tree techniques. The proposed operational framework and its spatial distribution offer new theoretical, methodological and empirical insights into understanding the real contribution of resilience and vulnerability to regional labour markets. The added value of the proposed operational framework is its direct policy-oriented perspective.
INTRODUCTION
Since the beginning of 1990, the concept of regional competitiveness has been extensively discussed among public and regional policy circles within developed countries, being endorsed by the European Commission as an eminent policy goal (e.g., Bristow, Citation2005; Citation2010; Thissen et al., Citation2013). The largely adopted definition of regional competitiveness is by Storper, who defines regional competitiveness as ‘the capability of a region to attract and keep firms with stable or increasing market shares in an activity, while maintaining stable or increasing standards of living for those who participate in it’ (Storper, Citation1997, p. 264).
The definition of Meyer-Stamer (Citation2008, p. 369), that ‘regional competitiveness is the ability of a region to generate high and rising incomes while improving the livelihood of people living there’, is solely based on the benefits to people living in a region. It does not encompass the strengths and weaknesses related to other stakeholders in the region (e.g., enterprises or institutions) that participate in the same regional network (Annoni & Dijkstra, Citation2019). The interpretation of Dijkstra et al. (Citation2011) equally considers the views of both residents and businesses, regarding regional competitiveness as the ability to present an attractive and sustainable environment for companies and residents to work and live, respectively. Furthermore, regional competitiveness considers the efficiency of regions to attract diverse and skilled labour, creative and knowledge workers, as well as investments, government subsidies and other funds (Bristow, Citation2010).
Why some regions are more competitive, while others are more locked into decline, is one of the most challenging questions in regional studies (e.g., Borsekova et al., Citation2021b; Hassink, Citation2010; Martin et al., Citation2016; Martin & Sunley, Citation2006). Regional development theories argue that the situation of any region is influenced by location and geographical factors, historical background and cultural drivers, the structure and quality of labour, and the relative competitiveness of the regional economy (e.g., Capello & Nijkamp, Citation2020; Sassen, Citation2006). Regional competitiveness also reflects the potential to perform better than others, as regions compete with each other for economic activities, foreign investment, jobs, highly qualified labour and infrastructure (European Commission, Citation1999, Citation2010). Regional scientists have repeatedly found out that regional competitiveness is deeply tied to efficient and flexible labour markets (e.g., Clark & Bailey, Citation2018; Dijkstra et al., Citation2011). As such, they efficiently contribute to resource allocation (Schwab & Porter, Citation2007), allowing wage fluctuations without excessive social disruption (Schwab, Citation2010). Therefore, the capacity of labour markets to reflect changing circumstances, including external shocks and perturbations, refers to their resilience. Resilience thinking is still in a transitional stage from a descriptive concept to a normative agenda (Weichselgartner & Kelman, Citation2015). Rather than viewing the ambiguity of the term as problematic, Davoudi et al. (Citation2012) see it as an opportunity, suggesting a reframing of the concept in ways that allow us to identify values and political pathways to pursue it. Regional labour markets are very sensitive to external shocks and disruptions. Therefore, they may provide interesting and relevant data samples to explore the relevance of the conceptions of resilience and vulnerability in a geographical context (e.g., Doran & Fingleton, Citation2016; Liang, Citation2017; Stough et al., Citation2018). The connection among disasters, environmental disruptions and economic shocks has resulted in a newly recognized sense of vulnerability and led to the search for new pathways to resilience (Christopherson et al., Citation2010; Hudson, Citation2009; Pike et al., Citation2010). In the present paper we are following these ideas. Our intention is to bring new insights into resilience and vulnerability studies by testing the significance of resilience and vulnerability in labour markets in the context of regional competitiveness.
THEORETICAL FOUNDATIONS FOR RESILIENCE AND VULNERABILITY OF REGIONAL LABOUR MARKETS
Resilience can be used as a universal framework to depict and analyse the dynamics of complex socioeconomic systems, particularly in relation to the system recovery after the occurrence of a disaster, perturbation or external shock (Östh et al., Citation2018). The concept of resilience has become popular in regional studies (e.g., Borsekova et al., Citation2021a; Hassink, Citation2010; Hudson, Citation2009; Martin, Citation2012; Reggiani et al., Citation2002; Rose & Liao, Citation2005; Simmie & Martin, Citation2010). Resilience is the ability of a region to absorb recurrent stresses and shocks without losing its fundamental structure and function (Tompkins & Adger, Citation2004) and a direct expression of the strength of the coupled human–environment system reflecting its immediate response, self-organization, learning, and adaptive capabilities (Carpenter et al., Citation2001). A growing number of studies have highlighted the importance of examining normative questions such as ‘resilience for whom?’ in examining and scrutinizing resilience policies (Cote & Nightingale, Citation2012; Cretney, Citation2014; Meerow & Newell, Citation2016; Tafti, Citation2019; Turner, Citation2014; Vale, Citation2014).
Resilience usually refers to the structurally balanced features of a dynamic system, along with its ability to withstand various types of shock while still continuing its regular functions and structure (Modica & Reggiani, Citation2015). The concept of resilience has captured the attention of regional scientists attempting to explain why labour markets vary in their capacity of response to challenges (Chapple & Lester, Citation2010; Doran & Fingleton, Citation2016; Martin et al., Citation2016).
Despite the wealth of studies on the concept of resilience, there is an absence of a consistent conceptual framework that enables us to assess the reactions of the labour markets to external shocks. Consequently, their resilience and vulnerability (Rose, Citation2004).
Labour markets are at the core of economic and social resilience alike inclusive growth of regions. Labour markets have essentially regional character due to the specific characteristics of every region, in terms of the presence of a unique composition of labour, regional economic structure, culture, history or its institutions (Storper, Citation2013). Besides, commuting distances are limited by time and cost constraints, while place-attachment, bounding to regions, cultures or families impact migration behaviour as well (van Dijk & Edzes, Citation2016; Venhorst, Citation2012, Citation2013).
The resilience of the labour market is significantly influenced by the policy of the labour market and its settings (Hijzen et al., Citation2018). Policies and institutions that are helpful in minimizing structural unemployment (through measures such as wage-bargaining coordination, short-term work schemes, and well-balanced labour market protection, regulation, and unemployment benefit systems) favour the resilience of the labour market. In the broader sense, social and activation policies are crucial for reducing the influence of economic downturns and for enabling return to work as quickly as possible for those that have lost their jobs (e.g., Benner, Citation2003; Boschma et al., Citation2014; Organisation for Economic Co-operation and Development (OECD), Citation2012, Citation2014). Labour market resilience from a regional perspective could be defined as ‘the ability to transform regional outcomes in the face of a challenge’ (Chapple & Lester, Citation2010, p. 86).
Regional economists have applied the concept of resilience to the process of innovation in which they discussed that a deep recession – similar to the 2008 economic crisis – is required to remove outdated and unproductive activities and industries (Williams, Citation2010). The need for resilience planning in an era of climate change and increasing uncertainty has led to the proposal of the concept of adaptive regions that reflects changing circumstances, external shocks, and perturbations as essential elements of regional planning (Ahern, Citation2011; Kythreotis & Bristow, Citation2017; Simon et al., Citation2018). Hence, an adaptive approach to resilience emphasizes that specific components of regional labour markets interact to achieve more complex forms of resilience in regions (Pike et al., Citation2010). Resilience thinking promotes its efficacy for understanding, managing and governing complex and interconnected systems of people and nature and describes regional development from a multidimensional point of view (Folke et al., Citation2004; Graziano, Citation2014; Rizzi et al., Citation2018).
Although there is an avalanche of studies on different aspects of resilience, much less attention is paid to the concept of vulnerability (e.g., Borsekova et al., Citation2018). Generally, regional risk is positively related to factors of vulnerability and negatively to factors of resilience (Graziano, Citation2014). Chelleri et al. (Citation2015) point out that resilience is often simplified as the opposite of vulnerability. However, Graziano and Rizzi (Citation2016, p. 212) claim that ‘the relationship between vulnerability and resilience appears more complex and not necessarily negative due to the high levels of ecological vulnerability associated with high resilience values, explained by the policies of response to environmental problems’. Similarly, Miller et al. (Citation2010) argue that resilience and vulnerability are not strictly inversely related and they can act complementary if we understand resilience as a response to shock and vulnerability as a condition, sensitivity, or coping capacity and not a direct result of a shock or perturbation (Caschili et al., Citation2015; Miller et al., Citation2010; Seeliger & Turok, Citation2013). In the present paper vulnerability is related to the robustness of a regional labour market to cope with the emergence of external shocks and to combat their negative consequences. Reduction of vulnerability through deliberate actions on labour markets may increase their resilience. The vulnerability of the labour market is affected by a number of forces of change. Appropriate interventions can help correct failures in the labour markets and increase their effectiveness. Family and work life pattern changes have increased the need of employees to have flexible working hours. The growth of non-standard work (such as self-employed persons, freelancers and others) and gender dimensions are closely linked to various aspects of vulnerability (Saunders, Citation2003).
Mortensen and Pissarides (Citation1994) were the first to study the impact of labour market policies on adjusting to shocks and external disruptions. They found that flexible labour markets allow workers to move from declining firms and enable companies and the economy as a whole to respond to external shocks. Based on their work, efficient and flexible labour markets become an important component of regional competitiveness (Dijkstra et al., Citation2011) as they efficiently contribute to resource allocation. Therefore, the efficiency of the labour markets becomes one of the main pillars of global and regional competitiveness. If measured, it generates a set of indicators that allow an in-depth analysis of labour markets in regions of the European Union (EU). Rates of employment and unemployment give an overview of economic activities in regions, whereas long-term unemployment implies the presence of structural problems and related vulnerability (Schwab & Porter, Citation2007).
A valuable contribution to resilience studies in relation to labour markets is a paper by Doran and Fingleton (Citation2016) that focuses on the resilience of employment to economic shocks. The set of available indicators mapping the regional labour markets of the EU offers an opportunity to study the regional significance of resilience and vulnerability in the context of regional competitiveness. This allows us to test and analyse new forms of resilience and vulnerability in relation to regional labour markets.
MATERIALS AND METHODS
The present paper aims to test the significance of resilience and the related concept of vulnerability for labour market efficiency (LME) in the context of regional competitiveness, and to propose an appropriate operational framework for policy analysis and implementation. We set two analytical objectives which form the basis for the deployment of statistical methods. Firstly, our aim is to reduce the original nine LME indicators by principal component analysis (PCA) and by correlation and regression analyses. Second, we have provided a classification of EU regions by the sign of the regional competitiveness index (RCI) 2019 by applications of decision trees. Two types of decision tree are expected: one with input from the original LME indicators and the other with the first principal components of the resilience and vulnerability indicators.
For these purposes, we analyse and compare the performance of European regions based on an RCI, its LME pillar and nine related indicators, namely: employment rate, long-term unemployment, unemployment rate, labour productivity, gender balance unemployment, gender balance employment, female unemployment, the share of population aged 15–24 not in education, employment or training (NEET), involuntary part-time or temporary employment. For the data sources, descriptions and reference years see Appendix A1 in the supplemental data online.
This paper uses a wide range of mathematical–statistical methods to analyse a robust dataset. Our research sample includes all EU regions at the NUTS-2 level (n = 268). This EU classification provides a harmonized hierarchy of regions. The NUTS-2 level identifies the core regions for the implementation of regional policies. As all EU member states have at least one region at the NUTS-2 level, our analysis is applicable to all EU member states.
To explore the possible underlying determinants of the comparisons in the regional data, we categorized regions by two factors: first, capitalist and post-socialist regions; and second, capital regions and other regions. Appendix A2 in the supplemental data online includes more details.
Capitalist regions are those of the so-called ‘old’ member states of the EU, along with Cyprus and Malta. Post-socialist is referenced in our study as regions within the EU countries of Central and Eastern Europe (CEE) that formerly had a socialist regime. These include also the Baltic States, previously members of the Soviet Union.
The selection of the first fixed categorical factor – also noted in our text as the development phase – is consistent with the thesis that fundamental elements of one era may persist from a previous regime (Sassen, Citation2006). This selection has its origins in a discussion that is being held on the problem of convergence between capitalist and post-socialist regions and countries, with reference to the character of market mechanisms, the power of state systems and their interplay (Hirt, Citation2013).
Capitalism is characterized by private ownership, accumulation of capital, a high level of competition and a free market – including the labour market – while in socialism elements of the labour market were influenced by ideology, along with the practice of the socialist regime. In virtue of the above mentioned, the labour market in former socialist regions and countries is often characterized as deformed or a quasi-labour market (e.g., Šulc, Citation2004). The system was intended to provide jobs for all and, along with central planning, to reach an equilibrium on all markets (Coufalová, Citation2019).
The collapse of the communist regimes in CEE countries led to the beginning of an accelerated political, social and economic change that has strongly influenced the regions of post-socialist countries that entered the EU, as socio-economic transition was closely related to the regional level (Borsekova et al., Citation2021b; Hirt, Citation2013; Malý et al., Citation2020; Soulsby & Clark, Citation2007). Undoubtedly, the above-mentioned characteristics have influenced the functioning of regional labour markets and their efficiency. By using the simplified categorization of capitalist and post-socialist regions, it is possible to give more attention to the economic–historical nature of the regions, allowing us to investigate how the past socialist countries and their regions have been transformed into capitalist systems, and to explore the essential differences among their labour markets.
The second fixed categorical factor – also noted here as the capital city factor – is based on evidence that regions with capital cities might have a competitive advantage compared with other regions due to the high concentration of human capital, firms and institutions (e.g., Glaeser, Citation2000). A capital region refers to a region that encompasses the capital city of the country, leaving the remaining regions in the group classified as others. Cuaresma et al. (Citation2014) provide empirical evidence that regions with capital cities are growing faster. The RCI 2019 results show a polycentric pattern, with a strong performance from the capital and metropolitan regions in many parts of the EU. Capital regions are often the most competitive within their country, with common exceptions being the Netherlands, Italy and Germany (Annoni & Dijkstra, Citation2019).
The methodology is based on three main techniques: PCA, regression analysis and multivariate classification by a classification and regression tree (CART).
PCA is a multivariate statistical method that extracts significant information from the dataset and presents it as a new set of orthogonal variables, called principal components. Principal components are linear combinations of the original variables, and thus they transform the dataset in order to reduce the dimensionality of data and to improve the efficiency of the original indicators (e.g., Abdi & Williams, Citation2010; Hosseini & Kaneko, Citation2011; Jollands et al., Citation2004). PCA fits to our purpose to test the significance of resilience and the related concept of vulnerability for LME indicators in regions of the EU. The PCA was enriched with descriptive statistics, correlation matrices and linear regression modelling.
For the interpretation of the PCA results, we used a supervised data-mining method – a decision tree – suitable for multivariate data analysis (e.g., Chen et al., Citation2003; Chou, Citation1991; Lin & Fan, Citation2019; Piramuthu, Citation2008). The decision tree is useful for exploring databases that contain vast amounts of data with numerous attributes, allowing hierarchical tree-shaped structures to be formed. A decision tree method works on algorithms, while the resultant patterns can be transformed to a set of if–then rules (Han & Kamber, Citation2001). We deployed the CART decision tree algorithm developed by Breiman et al. (Citation1984) to identify unknown data patterns of labour markets in regions of the EU based on resilience principal components (RPC) and vulnerability principal components (VPC) and original LME indicators.
RESULTS
This section presents the most important research results oriented towards the identification of resilience and VPC, decision tree classification of regions by principal components and by original LME indicators.
PCA and regression analyses
This subsection presents the most important research results based on PCA and regression analyses. We will focus on the identification of hidden relationships between the monitored indicators of LME. In our case, the observed variables are mutually correlated, and therefore it is impossible to justify dividing them into two groups: dependent and independent. The goal of the PCA method is to understand and identify how variables are interconnected, and hence try to find hidden immeasurable variables. By using the PCA method, we will create new variables that are linear combinations of the original variables. The new variables are described as principal components (Jobson, Citation1992). We began with the basic statistical parameters of nine LME indicators as depicted in .
Table 1. Basic statistical parameters of nine labour market efficiency (LME) indicators.
All nine LME indicators were subjected to PCA. This revealed two principal components (with minimum eigenvalue = 1) (). The first component explains 64.85% of variance, the second one 12.98%. The joint effect of a 77.83% explanation of variance is a good result for dimension reduction.
Table 2. Principal component analysis (PCA) of nine labour market efficiency (LME) indicators.
To help interpret the components, the indicators of the LME pillar are plotted in . The first PCA divides the nine LME indicators into two groups. On the left side of , with negative first principal component values, is the smaller group of two indicators (employment rate and labour productivity). The remaining seven indicators have positive first principal component values. From their definitions, it is clear that the first group contains indicators that reflect resilience indicators: the greater their value, the more resilient, and so the better off is the region.
Figure 1. Principal components plot of nine labour market efficiency (LME) indicators.
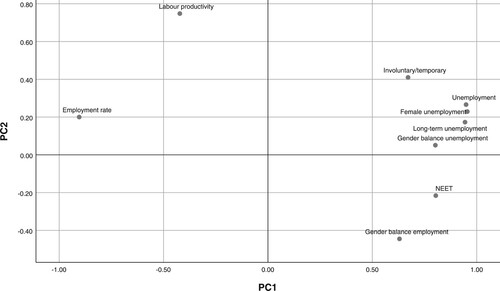
On the other side of the plot in is a group of seven indicators of vulnerability: the larger their value, the more vulnerable, and hence the worse off is the region. These indicators are long-term unemployment, unemployment rate, gender balance unemployment, gender balance employment, female unemployment, NEET and involuntary part-time/temporary employment. When all nine indicators are involved in the LME pillar, then its interpretation and its relationship with the indicators is less clear, as some indicators work against each other. In our case, the resilience indicators are negatively correlated with the vulnerability indicators.
A similar issue arises in their relationship to the LME pillar. Two resilience LME indicators – employment rate and labour productivity – are negatively correlated with seven vulnerability indicators. In this case, for p < 0.001, the critical two-sided value of the Pearson correlation coefficient is 0.203 for the smallest dataset, where n = 259. If any coefficient is higher than the critical value 0.203, then it is significant at p < 0.001. For more details, see Appendix A3 in the supplemental data online.
To test the significance of the concepts of resilience and vulnerability for LME in the context of regional competitiveness, additional PCAs were carried out (for details, see Appendix A4 online).
For the group of two resilience indicators, the first principal component RPC explained 75.5% of variance. For the group of seven vulnerability indicators, the second principal component VPC accounted for 70.4% of variance.
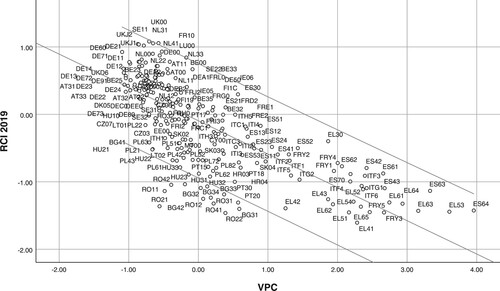
In order to explore the context of regional competitiveness, we test dependencies between the RCI 2019 index and the principal components of RPC and VPC. The correlations in the sample of all NUTS-2 EU regions are significant (p < 0.001). The correlation between the RPC and the RCI 2019 is positive (Pearson correlation = 0.921), while the correlation between the VPC and the RCI 2019 is negative (Pearson correlation = –0.755). Larger values of the RPC predict larger values of the RCI 2019. In contrast, larger values of the VPC predict smaller values of the RCI.
Next, we tested RPC and VPC in the context of regional competitiveness for all EU NUTS-2 regions. The empirical dependencies of the RPC and the VPC with the RCI 2019 together with the linear regression line and the corresponding 95% prediction intervals are shown in and .
Figure 2. Dependence of the regional competitiveness index (RCI) 2019 on the resilience principal component (RPC), including the linear regression line and prediction intervals.
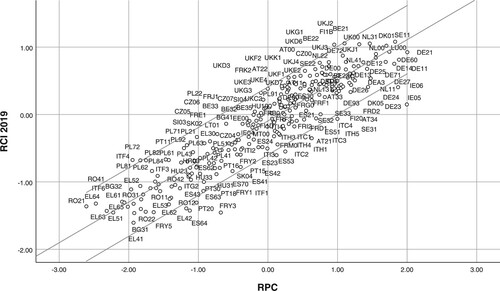
Figure 3. Dependence of the regional competitiveness index (RCI) 2019 on the vulnerability principal component (VPC), including the linear regression line and prediction intervals.
The linear regression model between RCI and RPC is significant (p < 0.001, coefficient of determination = 84.8%). The linear regression coefficient is 0.603. If the RPC increases by 1 unit, then the RCI increases on average by 0.603. The regression equation is: RCI = –0.095 + 0.603*RPC (see Appendix A5 in the supplemental data online) ().
The linear regression model between the RCI and VPC is also significant, but in a negative sense (p < 0.001, coefficient of determination = 56.9%) (see Appendix A6 online). The linear regression coefficient is −0.494. If the VPC increases by 1 unit, then the RCI decreases by 0.494. The regression equation is as follows: RCI = –0.095 – 0.494*VPC.
It is worth noting that the constant term is by chance the same for both RPC and VPC. Nine original LME indicators are included in RCI, but in addition to them, dozens of indicators from other RCI pillars are included. Therefore, the influence of LME indicators is substantially reduced. The reason for both RPC and VPC being independent variables in the regression with RCI is based on the fact that indicators involved in RPC are of type that the larger the value, the better the region and also the larger the RCI. On the contrary, the indicators involved in VPC are indicators with attributes: the larger the value, the worse the region and the smaller the RCI. Therefore, we have found a clear significant relationship between the RPC and VPC variables of LME and RCI. We are aware of the limitations of this method, which, however, forms a solid basis for further research, for example, as a robustness check.
The next step in the analysis is oriented towards answering the question of whether the relationship remains in meaningful subsets of NUTS-2 EU regions. For this purpose, we have used two fixed categorical factors of regions based on the development phase (including groups of capitalist and post-socialist regions) and the capital city factor (including groups of capital regions and other regions), as described in the third section.
is based on the parameters of the regression model with the interaction term between the RPC and the first fixed factor – the development phase.
Table 3. Equality of slopes test in the linear regression model between the regional competitiveness index (RCI) 2019 and resilience principal component (RPC) for the first fixed categorical factor – development phase of regions.
The interaction term Phase*RPC is not significant (p = 0.198), so there is not a significant difference between the set of post-socialist regions and the set of capitalist regions in the regression coefficients. A common regression coefficient of 0.603 can be used for both sets of regions. For the VPC, the result is significant at p = 0.048 ().
Table 4. Equality of slopes test in the linear regression model between the regional competitiveness index (RCI) 2019 and vulnerability principal component (VPC) by development phase of regions.
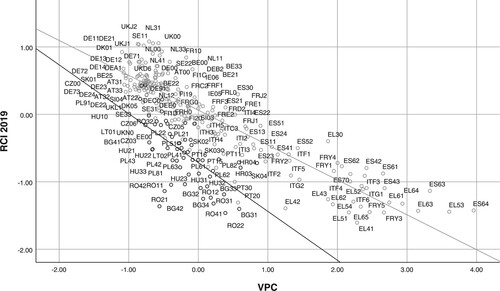
The different corresponding linear regression coefficients of post-socialist regions and of capitalist regions are shown in .
Table 5. Parameters of linear regression model between the regional competitiveness index (RCI) 2019 and the vulnerability principal component (VPC) by development phase of regions.
Therefore, for the dependence of the RCI 2019 versus the VPC, it is more correct to use two separate equations:
Post-socialist regions have a larger regression coefficient in their linear dependence of the RCI 2019 on the VPC. They require a smaller change in their VPC than do capitalist regions to produce a given
change in the RCI. In other words, RCI is more sensitive to change in VPC in post-socialist regions. shows these different relations. Note that capitalist regions are represented by light grey circles and post-socialist regions by dark grey circles.
Figure 4. Dependence of the regional competitiveness index (RCI) 2019 versus the vulnerability principal component (VPC) with the linear regression line in both development phase groups of regions.
For the two groups defined by the second fixed factor – capital city – there are no noteworthy differences in regression coefficients in either RPC involvement (see Appendix A7 in the supplemental data online), or in VPC involvement (see Appendix A8 online).
Decision tree classification of regions by principal components
Decision trees were used for the multivariate classification of EU-28 NUTS-2 regions, using nine LME indicators and two fixed categorical factors by two factors: the first (capitalist regions and post-socialist regions) and the second (capital regions and other regions). The purpose of multivariate classification is to find simple decision rules for prediction (classification) of EU-28 NUTS-2 regions from a regional competitiveness viewpoint, based on data from the RCI 2019. Negative RCI 2019 values were recorded for 132 regions (49.3%), while positive RCI 2019 values were applied in 136 regions (50.7%). All nine variables from the LME pillar, including both categorical factors, were involved as inputs. The sign of RCI 2019 was the decision tree output.
The first decision tree’s inputs were the first principal components (RPC and VPC) of the resilience and vulnerability indicators, plus both fixed categorical factors. shows the resulting CART decision tree. Its parameters are: depth (number of partition levels) = 5, pruning = SE(1), minimum cases in parent node = 4, minimum cases in child node = 2, Gini coefficient of impurity, minimum improvement = 0.0001, prior probabilities from data, and it has 17 nodes, nine of them terminal nodes.
Figure 5. Classification and regression tree (CART) decision tree of regions with positive (black) versus negative (grey) values of the regional competitiveness index (RCI) 2019, using the resilience principal component (RPC), vulnerability principal component (VPC) and both fixed categorical factors.
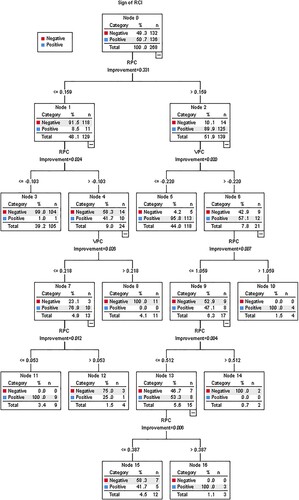
Although all four variables were involved as inputs, only two of them, namely RPC and VPC, are present in the resulting decision tree. The reason can be seen in , which records variables’ relative importance. The development phase and capital city factors are much less important than RPC and VPC in predicting the value of RCI 2019.
Table 6. Relative importance of variables in the classification and regression tree (CART) decision tree of the regional competitiveness index (RCI) 2019 value.
shows a statistically impressive successful classification rate of 95.5%. This has possible policy implications.
Table 7. Classification matrix of the classification and regression tree (CART) decision tree of the regional competitiveness index (RCI) 2019 sign by the resilience principal component (RPC) and vulnerability principal component (VPC).
The CART decision tree has found several larger homogenous or almost homogenous groups of regions. First, groups of regions with prevailing positive RCI 2019 are as follows: 113 regions in node 5 (RPC > 0.16 and VPC ≤ −0.22), four regions in node 10 (RPC > 0.16 and VPC > −0.22 and RPC > 1.06), and nine regions in node 11 RPC ∈ (−0.10, 0.05 and VPC ≤ 0.22), Second, groups of regions with the prevailing negative RCI 2019 are as follows: 104 regions in node 3 (RPC < −0.10), and 11 regions in node 8 (RPC < −0.10 and VPC > 0.22).
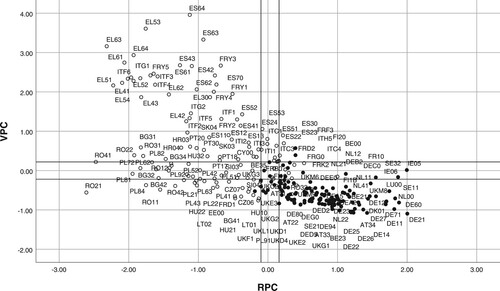
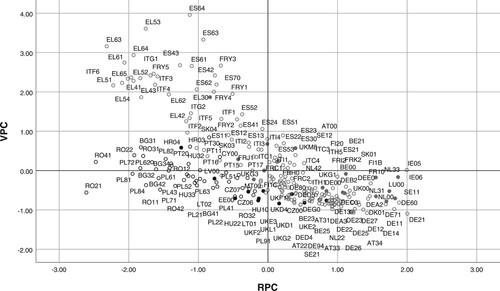
depicts the pattern of regions in a scatterplot of the VPC against the RPC. Regions with negative RCI values are marked as empty circles. Regions with full circles have positive RCI values. also shows the partition values of the CART decision tree that define rectangular areas of regions with prevailing either negative values of RCI or positive values of RCI: 1, RPC = 0.16; 2, RPC = −0.10; 3, VPC = −0.22; 4, VPC = 0.22; and 5, RPC = 1.06. These are decision rules for hidden latent factors (RPC and VPC), which are not directly observed.
Figure 6. Scatterplot of the vulnerability principal component (VPC) against the resilience principal component (RPC) with some partition values of the classification and regression tree (CART) decision tree.
Decision tree classification of regions by original LME indicators
A more straightforward interpretation offers the decision tree which used the original indicators of the LME pillar. The CART decision tree presented below uses the original nine indicators plus the two fixed categorical factors based on the development phase of regions, and the capital city factor. depicts the resulting decision tree. Parameters of the second tree are: depth = 3, none pruning, minimum cases in parent node = 4, minimum cases in child node = 2, Gini coefficient of impurity, minimum improvement = 0.0001, prior probabilities from data, it has 13 nodes and seven of them are terminal nodes (5 and 7–12).
Figure 7. Classification and regression tree (CART) decision tree of regions with positive (black) values of the regional competitiveness index (RCI) 2019 versus negative (grey) values of the RCI 2019, using labour market efficiency (LME) indicators and two fixed categorical factors.
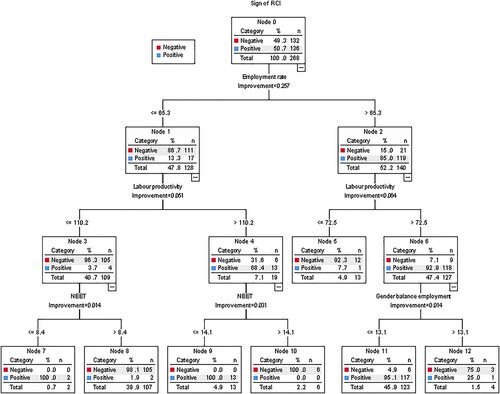
Several larger homogenous or almost homogenous groups of regions were discovered. First, groups of regions with prevailing positive RCI 2019 are as follows: 117 regions in node 11 (employment rate > 65.3; labour productivity > 72.5; and gender balance employment ≤ 13.1), 13 regions in node 9 (employment rate ≤ 65.3; labour productivity > 110.2; and NEET ≤ 14.1). Second, groups of regions with prevailing negative RCI 2019 are as follows: 105 regions in node 8 (employment rate ≤ 65.3; labour productivity ≤ 110.2; and NEET > 8.4), and 12 regions in node 5 (employment rate > 65.3; and labour productivity ≤ 72.5).
shows an overall classification rate of 96.3% and requires only three partition levels. This is even simpler than in the case when RPC and VPC were involved ().
Table 8. Classification matrix of the classification and regression tree (CART) decision tree of the regional competitiveness index (RCI) 2019 performance by labour market efficiency (LME) indicators.
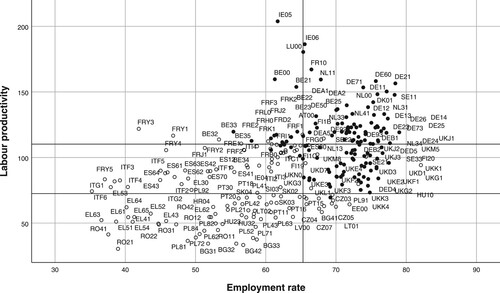
shows the regions in a scatterplot against the two most significant variables (labour productivity and employment rate) in the CART decision tree. Regions with negative RCI values appear as empty circles, and those with positive RCI values appear as full circles. also shows the partition values of the CART decision tree that define rectangular areas of regions with prevailing either negative or positive values of RCI: employment rate = 65.3 and labour productivity = 72.5 or 110.2.
Figure 8. Scatterplot of labour productivity versus employment rate with partition values of the classification and regression tree (CART) decision tree.
shows the relative contributions of all variables involved in the CART decision tree, ranked in descending order of importance. Both fixed factors are of only limited importance.
Table 9. Importance of variables in the classification and regression tree (CART) decision tree of regional competitiveness index (RCI) sign by labour market efficiency (LME) indictors.
Our research results confirm Krugman’s (Citation1994, p. 11) statement that ‘productivity isn't everything, but, in the long run, it is almost everything. A country's ability to improve its standard of living over time depends almost entirely on its ability to raise its output per worker’. The patterns of regional productivity underpin national productivity and the links between lived experiences and political response rely deeply on local productivity as the key catalyst of local prosperity (McCann, Citation2020).
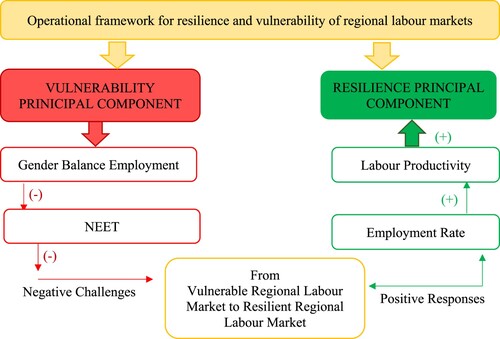
The research results presented in this subsection have shown that it is unnecessary to involve all nine indicators as principal components. Most differences between regions with positive as opposed to negative values of RCI can be explained by only four indicators, two for each principal component. The employment rate and labour productivity are crucial indicators for the RPC. Gender balance employment and NEET are crucial indicators for the VPC. Applying these results, the next section proposes an operational framework for improving the resilience and reducing the vulnerability of regional labour markets.
PROPOSAL FOR AN OPERATIONAL FRAMEWORK FOR RESILIENCE AND VULNERABILITY OF REGIONAL LABOUR MARKETS
The need for harmonization of competitiveness and resilience concepts raises intriguing practical questions on the operation of policy and governance in regional labour markets (e.g., Borsekova et al., Citation2021a; Bristow, Citation2010). Research results reported in the fourth section show that in the context of regional competitiveness, there is a direct significant relation between resilience, vulnerability and LME indicators.
The LME pillar consists of nine indicators, while in their superposition within the RCI they work against each other. The proposal of an operational framework is oriented towards decomposing of existing structure of the LME pillar and proposing new one based on the assignment of indicators to resilience or vulnerability. The first PCA divides the nine LME indicators into two groups. On the left side, with negative first principal component values, is the smaller group of two indicators (employment rate and labour productivity). The remaining seven indicators have positive first principal component values. From their definitions, it is clear that the first group contains indicators that reflect resilience indicators: the greater their value, the more resilient and so the better off is the region as these indicators raise the value of the RCI.
On the other side of the plot is a group of seven indicators of vulnerability: the larger their value, the more vulnerable and hence the worse off is the region as these seven indicators lower the value of the RCI. These indicators are long-term unemployment, unemployment rate, gender balance unemployment, gender balance employment, female unemployment and NEET – involuntary part-time/temporary employment. When all nine indicators are involved in the LME pillar, then its interpretation and its relationship to the indicators is less clear, as some indicators work against each other. In our case, the resilience indicators are negatively correlated with vulnerability indicators.
suggests a novel operational framework based on the position of the EU NUTS-2 regions in four quadrants according to their RPC and VPC and both fixed categorical factors. Note that capitalist regions are represented by grey circles and post-socialist regions by black circles; regions with capital are represented by full circles and others are represented by empty circles.
Figure 9. Scatterplot of the resilience principal component (RPC) and vulnerability principal component (VPC).
Quadrant I has regions with a positive value in both principal components. Regions in this quadrant might focus on maintaining the current level of the resilience indicators and decreasing the current level of the vulnerability indicators.
The presence of the region in quadrant II is an undesirable situation, as the RPC is negative, and the VPC is positive. There are two, respectively, three possible development paths leading to the strengthening of regional labour market performance. The first path is the shift to quadrant I based on strengthening resilience indicators and then followed by decreasing vulnerability indicators. The second path is the shift to quadrant III based on decreasing vulnerability indicators followed by strengthening resilience indicators. The third possible path consists of concerted steps oriented towards strengthening resilience indicators and decreasing vulnerability indicators at the same time.
Quadrant III depicts regions with both negative principal components, RPC and VPC. Regions in this quadrant should focus primarily on strengthening RPC and thus indicators of resilience.
Quadrant IV sketches out regions with positive RPC and negative VPC, which represent the desired situation. Regions in this quadrant might focus on maintaining the current level of their resilience and VPC and their long-term sustainability. For a better visualization of the described quadrants, see the basic constellation of the proposed operational framework for resilience and vulnerability of regional labour markets in the EU in Appendix A9 in the supplemental data online. shows the spatial distribution of a proposed operational framework across NUTS-2 regions in the EU and the spatial distribution of quadrants described above and depicted in .
Figure 10. Spatial distribution of the proposed operational framework for resilience and vulnerability of regional labour markets in the EU.
Notes: RPC, resilience principal component; and VPC, vulnerability principal component. Quadrant 1: RPC+, VPC+; quadrant 2: VPC+, RPC–; quadrant 3: VPC–, RPC–; and quadrant 4: VPC–, RPC+. Readers of the print article can view the figures in colour online at https://doi.org/10.1080/00343404.2022.2042507
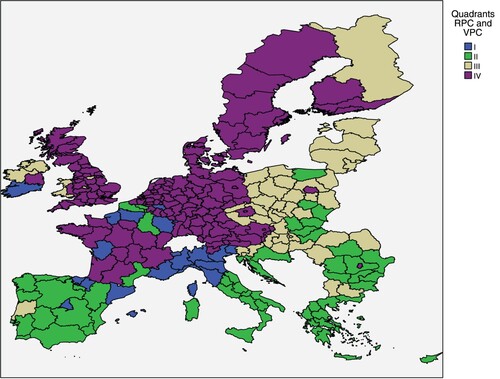
The map of spatial distribution in uncovers several interesting patterns. The regions in quadrant I (with positive both VPC and RPC) are solely located in capitalist countries and comprise one capital region, namely Madrid. This is a very interesting result, which confirms that capitalist regions have more resilient labour markets than post-socialist regions. This may be caused by historical and political differences in the functioning of labour markets, while the consequences of these differences persist until today. The reason may also be better cooperation and connectivity between labour markets in capitalist regions. However, regions in quadrant I should be aware of their vulnerability and try to identify vulnerabilities in their labour markets and establish targeted measures and tailor-made solutions to mitigate vulnerability of their labour market. The regions in quadrant II (with positive VPC and negative RPC) are mainly clustered in the Mediterranean and peripheries of the EU. Surprisingly, quadrant II also comprises several capital regions, from both capitalist countries (e.g., Greece, Italy and Portugal) and one capital region from the post-socialist country, namely Croatia. One of the reasons for the presence in this quadrant may be the unilateral economic focus of the region (e.g., tourism). The labour markets of the regions in quadrant II should focus on mitigating vulnerability (e.g., through diversifications of their sectors) and strengthening resilience (e.g., through increasing labour productivity or employment rate). Regions in quadrant III (with negative both VPC and RPC) are mainly located in post-socialist countries and peripheries of capitalist countries. For these regions, it might be important to identify their strengths and weaknesses and to transform them into tailor-made solutions and measures to increase resilience and decrease vulnerability of their labour markets. As they are often located in the neighbourhood of regions in desired quadrant IV, this may indicate their potential for improvement by taking advantage of the open European labour market. The regions in desired quadrant IV (with negative VPC and positive VPC) seem to be rather concentrated in capitalist countries and comprise capital regions of 15 countries, including four post-socialist countries, the Czech Republic, Poland, Romania and Slovakia. This quadrant comprises 117 capitalist regions without capital, but none of the post-socialist regions without capital. This confirms the results of Borsekova et al. (Citation2021b) that post-socialist regions without a capital city are the most vulnerable regions in the EU.
The spatial distribution of the proposed operational framework offers guidance for tailor-made and specific place-based strategies to strengthen resilience and mitigate vulnerability of regional labour markets in the EU. From decision trees and related calculations, it is clear that it is unnecessary to control all nine indicators to affect improvements. Our proposed operational framework reflects this fact. Most differences between regions with positive RCI values and those with negative values can be explained by four indicators: employment rate, labour productivity, gender balance employment and NEET. highlights schematically the simple operational framework for resilience and vulnerability of regional labour markets, based on PCA.
Figure 11. Operational framework for improving the resilience and reducing the vulnerability of regional labour markets.
The proposed operational framework offers solid and new theoretical, methodological and empirical insights for understanding the real contribution of resilience and the related concept of vulnerability to regional labour market analysis. The added value of the proposed operational framework is its direct policy-oriented perspective that can be operationalized with publicly available data.
CONCLUSIONS
The present paper tests the significance of resilience and the related concept of vulnerability for LME in the context of regional competitiveness, and to propose an appropriate operational framework for policy analysis and implementation.
Three data analysis methods were used: PCA, regression analysis and multivariate classification using CART decision trees. The individual methods complemented each other for the purposes of comprehensive research on resilience and vulnerability of labour markets in the EU. PCAs and regression modelling were used to test the significance of resilience and the related concept of vulnerability for LME indicators in regions of the EU. For the interpretation of the PCAs results and regression analyses results, we deployed the CART decision tree algorithm to identify unknown data patterns of labour markets in regions of the EU based on resilience and VPC and original LME indicators.
Our study has revealed the significant relationships between the RPC and the VPC, variables of LME and regional competitiveness (RCI). In addition, we tested this relationship in meaningful subsets of EU NUTS-2 regions by using linear regression modelling. To do this, we used two fixed categorical factors of regions, based on their development phase (including groups of capitalist and post-socialist regions), and a capital city factor (including groups of capital regions and other regions). Research results show that post-socialist regions have a significantly smaller regression coefficient (−0.715 compared with −0.517) in their negative linear dependence of the RCI 2019 on the VPC. This means that RCI is more sensitive to change in VPC for the group of post-socialist regions. In other words, post-socialist regions are more vulnerable to a given change in the VPC in their relationship with the RCI than are capitalist regions. An analysis of the second fixed categorical factor – the capital city factor – showed no such differences in regression coefficients in RPC involvement or in VPC involvement.
Further analysis of linear regression models between the RCI 2019 and the RPC and the VPC according to the two fixed categorical factors noted above naturally led to a proposed operational framework for policy analysis and application. The map of the spatial distribution of the proposed operational framework reveals several interesting patterns. Capitalist regions have more resilient labour markets than post-socialist regions. Regions with negative RPC and positive VPC are mainly clustered in the Mediterranean and peripheries of the EU, including several capital regions, both from capitalist and post-socialist countries. Regions with both negative principal components, RPC and VPC, are mainly located in post-socialist countries and peripheries of capitalist countries. Regions with positive RPC and negative VPC seem to be rather concentrated in capitalist countries and comprise capital regions of 15 countries, including four post-socialist countries. An important policy message is that while this cluster comprises 117 capitalist regions without capital, none of the post-socialist regions without capital is present in this cluster. This is consistent with the results of Eurofound (Citation2020) that regions with capital cities report larger numbers of people feeling resilient compared with regions without capital cities and rural areas. The Eurofound study added that while some characteristics of regional labour markets, such as age and education profile, contribute to their resilience, others such as housing insecurity and higher living costs lower it. Regional science, but also general labour market theories, should take into account resilience and vulnerability measures that explain spatial variations in regional labour markets (van Dijk & Edzes, Citation2016). The spatial distribution of the proposed operational framework clustered the EU NUTS-2 regions into four groups with similar resilience and vulnerability indicators. van Dijk and Edzes (Citation2016, p. 177) suggest that ‘similar labour market problems can serve as a foundation for a labour market policy and for the assessment of policy measures’. The proposed operational framework meets this expectation as it offers solid starting point for tailor-made and specific place-based strategies for strengthening resilience and mitigation of vulnerability of regional labour markets in the EU.
From decision trees and related calculations, it is clear that it is unnecessary to control all nine indicators to affect improvements. A CART decision tree showed that 96.3% of regions could be correctly classified into one of two groups – those with positive RCI values, and those with negative values – using only four indicators: two resilience indicators – employment rate and labour productivity, and two vulnerability indicators – gender balance employment and NEET. If EU NUTS-2 regions operate specific place-based policies to increase the employment rate and labour productivity and tailor-made solutions to decrease gender balance employment (distance to equilibrium) and NEET, then their resilience will increase and their vulnerability will decrease. Research into the various trade-offs that such policies may require is a key requirement for successful policymaking.
The proposed operational framework for understanding the resilience and vulnerability of regional labour markets, based on PCA, will be helpful in developing policy measures to improve both regional competitiveness and the resilience of regional labour markets. The proposed operational framework offers solid and new theoretical, methodological and empirical insights for understanding the real contribution of resilience and vulnerability to regional labour markets. Besides, the proposed operational framework opens space for further research, for example, by considering the aspect of well-being, as it is widely accepted that having a job and an income is related to individual well-being and happiness (van Dijk & Edzes, Citation2016).
A substantial advantage of the operational framework proposed in the present paper is its ability to become immediately applicable to policy and decision-making. Our analysis employed readily accessible official Eurostat data, and standard indicators were involved in the RCI for 2019. Due to a consistency and time continuity in the RCI classification, policymakers are able to compare the performance of their regions and regional labour markets and to appropriately design suitable measures and policies. From this point of view, this paper has produced numerous relevant analytical elements and results for politicians and decision-making bodies appropriate for direct use and application at various levels.
Supplemental Material
Download PDF (175.6 KB)ACKNOWLEDGEMENTS
The authors thank the editors and three anonymous referees for their constructive advice and criticism.
DISCLOSURE STATEMENT
No potential conflict of interest was reported by the authors.
Additional information
Funding
REFERENCES
- Abdi, H., & Williams, L. J. (2010). Principal component analysis. Wiley Interdisciplinary Reviews: Computational Statistics, 2(4), 433–459. https://doi.org/10.1002/wics.101
- Ahern, J. (2011). From fail-safe to safe-to-fail: Sustainability and resilience in the new urban world. Landscape and Urban Planning, 100(4), 341–343. https://doi.org/10.1016/j.landurbplan.2011.02.021
- Annoni, P., & Dijkstra, L. (2019). The EU regional competitiveness Index 2019. Publication Office of the European Union.
- Benner, C. (2003). Labour flexibility and regional development: The role of labour market intermediaries. Regional Studies, 37(6–7), 621–633. https://doi.org/10.1080/0034340032000108723
- Borsekova, K., Koróny, S., & Nijkamp, P. (2021a). In search of concerted strategies for competitive and resilient regions. Networks and Spatial Economics, 1–28. https://doi.org/10.1007/s11067-021-09522-z
- Borsekova, K., Korony, S., & Nijkamp, P. (2021b). Traces of the Iron Curtain: A multivariate analysis of regional cohesion in Europe. Socio-Economic Planning Sciences, 78, 101040. https://doi.org/10.1016/j.seps.2021.101040
- Borsekova, K., Nijkamp, P., & Guevara, P. (2018). Urban resilience patterns after an external shock: An exploratory study. International Journal of Disaster Risk Reduction, 31, 381–392. https://doi.org/10.1016/j.ijdrr.2018.05.012
- Boschma, R., Eriksson, R. H., & Lindgren, U. (2014). Labour market externalities and regional growth in Sweden: The importance of labour mobility between skill-related industries. Regional Studies, 48(10), 1669–1690. https://doi.org/10.1080/00343404.2013.867429
- Breiman, L., Friedman, J. H., Olshen, R. A., & Stone, C. J. (1984). Classification and regression trees. Chapman & Hall/CRC.
- Bristow, G. (2005). Everyone as winner: Problematizing the discourse of regional competitiveness. Journal of Economic Geography, 5(3), 285–304. https://doi.org/10.1093/jeg/lbh063
- Bristow, G. (2010). Critical reflections on regional competitiveness. Routledge.
- Capello, R., & Nijkamp, P. (2020). Regional growth and development theories. Edward Elgar.
- Carpenter, S., Walker, B., Anderies, M., & Abel, N. (2001). From metaphor to measurement: Resilience of what to what? Ecosystems, 4(8), 765–781. https://doi.org/10.1007/s10021-001-0045-9
- Caschili, S., Reggiani, A., & Medda, F. (2015). Resilience and vulnerability of spatial economic networks. Networks and Spatial Economics, 15(2), 205–210. https://doi.org/10.1007/s11067-015-9283-9
- Chapple, K., & Lester, T. (2010). The resilient regional labour market? The US case. Cambridge Journal of Regions, Economy and Society, 3(1), 85–104. https://doi.org/10.1093/cjres/rsp031
- Chelleri, L., Waters, J. J., Olazabal, M., & Minucci, G. (2015). Resilience trade-offs: Addressing multiple scales and temporal aspects of urban resilience. Environment and Urbanization, 27(1), 181–198. https://doi.org/10.1177/0956247814550780
- Chen, Y. L., Hsu, C. L., & Chou, S. C. (2003). Constructing a multi-valued and multilabeled decision tree. Expert Systems with Applications, 25(2), 199–209. https://doi.org/10.1016/S0957-4174(03)00047-2
- Chou, P. A. (1991). Optimal partitioning for classification and regression trees. IEEE Transactions on Pattern Analysis and Machine Intelligence, 13(4), 340–354. https://doi.org/10.1109/34.88569
- Christopherson, S., Mickie, J., & Tyler, P. (2010). Regional resilience. Cambridge Journal of Regions, Economy and Society, 3(1), 3–10. https://doi.org/10.1093/cjres/rsq004
- Clark, J., & Bailey, D. (2018). Labour, work and regional resilience. Regional Studies, 52(6), 741–744. https://doi.org/10.1080/00343404.2018.1448621
- Cote, M., & Nightingale, A. J. (2012). Resilience thinking meets social theory: Situating social change in socio-ecological systems (SES) research. Progress in Human Geography, 36(4), 475–489. https://doi.org/10.1177/0309132511425708
- Coufalová, L., & Žídek, L. (2019). Functioning of the quasi-labor market under socialism: Clash between ideology and reality. DANUBE: Law, Economics and Social Issues Review, 10(1), 23–43. https://doi.org/10.2478/danb-2019-0002
- Cretney, R. (2014). Resilience for whom? Emerging critical geographies of socioecological resilience. Geography Compass, 8(9), 627–640. https://doi.org/10.1111/gec3.12154
- Cuaresma, J. C., Doppelhofer, G., & Feldkircher, M. (2014). The determinants of economic growth in European regions. Regional Studies, 48(1), 44–67. https://doi.org/10.1080/00343404.2012.678824
- Davoudi, S., Shaw, K., Haider, L. J., et al. (2012). Resilience: A bridging concept or a dead end? Planning Theory & Practice, 13(2), 299–333. https://doi.org/10.1080/14649357.2012.677124
- Dijkstra, L., Annoni, P., & Kozovska, K. (2011). A new regional competitiveness index: Theory, methods and findings 2011. Publication Office of the European Union.
- Doran, J., & Fingleton, B. (2016). Employment resilience in Europe and the 2008 economic crisis: Insights from micro-level data. Regional Studies, 50(4), 644–656. https://doi.org/10.1080/00343404.2015.1088642
- Eurofound. (2020). What makes capital cities the best places to live? European quality of life survey 2016 series. Publications Office of the European Union.
- European Commission. (1999). ESDP. European spatial development perspective. Towards balanced and sustainable development of the territory of the European Union. European Communities.
- European Commission. (2010). EUROPE 2020 – A strategy for smart, sustainable and inclusive growth. Communication from the Commission. European Commission.
- Folke, C., Carpenter, S., Walker, B., Scheffer, M., Elmqvist, T., Gunderson, L., & Holling, C. S. (2004). Regime shifts, resilience, and biodiversity in ecosystem management. Annual Review of Ecology, Evolution, and Systematics, 35(1), 557–581. https://doi.org/10.1146/annurev.ecolsys.35.021103.105711
- Glaeser, E. L. (2000). The new economics of urban and regional growth. In C. Gordon, G. Meric, & M. Feldman (Eds.), The Oxford handbook of economic geography (pp. 83–98). Oxford University Press.
- Graziano, P. (2014). Rischio, vulnerabilità e resilienza territoriale: Il caso delle province italiane. In F. Mazzola, D. Musolino, & V. Provenzano (Eds.), Reti, nuovi settori e sostenibilità. Prospettive per l’analisi e le politiche regionali (pp. 243–270). Franco Angeli.
- Graziano, P., & Rizzi, P. (2016). Vulnerability and resilience in the local systems: The case of Italian provinces. Science of the Total Environment, 553, 211–222. https://doi.org/10.1016/j.scitotenv.2016.02.051
- Han, J., & Kamber, M. (2001). Data mining concept and technology. Morgan Kaufmann.
- Hassink, R. (2010). Regional resilience: A promising concept to explain differences in regional economic adaptability? Cambridge Journal of Regions, Economy and Society, 3(1), 45–58. https://doi.org/10.1093/cjres/rsp033
- Hijzen A., Kappeler A., Pak M., & Schwellnus C. (2018). Labour market resilience: The role of structural and macroeconomic policies. In de Haan, J., & Parlevliet, J. (Eds.), Structural reforms. Springer. https://doi.org/10.1007/978-3-319-74400-1_8
- Hirt, S. (2013). Whatever happened to the (post)socialist city? Cities, 32, 29–38. https://doi.org/10.1016/j.cities.2013.04.010
- Hosseini, H. M., & Kaneko, S. (2011). Dynamic sustainability assessment of countries at the macro level: A principal component analysis. Ecological Indicators, 11(3), 811–823. https://doi.org/10.1016/j.ecolind.2010.10.007
- Hudson, R. (2009). Resilient regions in an uncertain world: Wishful thinking or a practical reality? Cambridge Journal of Regions, Economy and Society, 3(1), 11–25. https://doi.org/10.1093/cjres/rsp026
- Jobson, J. (1992). Applied multivariate data analysis, Vol. II: Categorical and multivariate methods. Springer.
- Jollands, N., Lermit, J., & Patterson, M. (2004). Aggregate eco-efficiency indices for New Zealand – A principal components analysis. Journal of Environmental Management, 73(4), 293–305. https://doi.org/10.1016/j.jenvman.2004.07.002
- Krugman, P. (1994). The age of diminished expectations. MIT Press.
- Kythreotis, A. P., & Bristow, G. I. (2017). The ‘resilience trap’: Exploring the practical utility of resilience for climate change adaptation in UK city-regions. Regional Studies, 51(10), 1530–1541. https://doi.org/10.1080/00343404.2016.1200719
- Liang, J. (2017). Trade shocks, new industry entry and industry relatedness. Regional Studies, 51(12), 1749–1760. https://doi.org/10.1080/00343404.2016.1245415
- Lin, C. L., & Fan, C. L. (2019). Evaluation of CART, CHAID, and QUEST algorithms: A case study of construction defects in Taiwan. Journal of Asian Architecture and Building Engineering, 18(6), 539–553. https://doi.org/10.1080/13467581.2019.1696203
- Malý, J., Dvořák, P., & Šuška, P. (2020). Multiple transformations of post-socialist cities: Multiple outcomes? Cities, 107, 102901. https://doi.org/10.1016/j.cities.2020.102901
- Martin, R. (2012). Regional economic resilience, hysteresis and recessionary shocks. Journal of Economic Geography, 12(1), 1–32. https://doi.org/10.1093/jeg/lbr019
- Martin, R., & Sunley, P. (2006). Path dependence and regional economic evolution. Journal of Economic Geography, 6(4), 395–437. https://doi.org/10.1093/jeg/lbl012
- Martin, R., Sunley, P., Gardiner, B., & Tyler, P. (2016). How regions react to recessions: Resilience and the role of economic structure. Regional Studies, 50(4), 561–585. https://doi.org/10.1080/00343404.2015.1136410
- McCann, P. (2020). Perceptions of regional inequality and the geography of discontent: Insights from the UK. Regional Studies, 54(2), 256–267. https://doi.org/10.1080/00343404.2019.1619928
- Meerow, S., & Newell, J. P. (2019). Urban resilience for whom, what, when, where, and why? Urban Geography, 40(3), 309–329. https://doi.org/10.1080/02723638.2016.1206395
- Meyer-Stamer, J. (2008). Systematic competitiveness and local economic development (Discussion Paper). Mesopartner.
- Miller, F., Osbahr, H., Boyd, E., Thomalla, F., Bharwani, S., Ziervogel, G., Walker, B., Birkmann, J., van der Leeuw, S., Rockström, J., Hinkel, J., Downing, T., Folke, C., & Nelson, D. (2010). Resilience and vulnerability: Complementary or conflicting concepts? Ecology and Society, 15(3), 11. https://doi.org/10.5751/ES-03378-150311
- Modica, M., & Reggiani, A. (2015). Spatial economic resilience: Overview and perspectives. Networks and Spatial Economics, 15(2), 211–233. https://doi.org/10.1007/s11067-014-9261-7
- Mortensen, D. T., & Pissarides, C. A. (1994). Job creation and job destruction in the theory of unemployment. The Review of Economic Studies, 61(3), 397–415. https://doi.org/10.2307/2297896
- Organisation for Economic Co-operation and Development (OECD). (2012). What makes labour markets resilient during recessions?
- Organisation for Economic Co-operation and Development (OECD). (2014). Overview paper on resilient economies and societies, Meeting of the OECD Council at Ministerial Level. www.oecd.org/mcm/C-MIN(2014)7-ENG.pdf
- Östh, J., Dolciotti, M., Reggiani, A., & Nijkamp, P. (2018). Social capital, resilience and accessibility in urban systems: A study on Sweden. Networks and Spatial Economics, 18(2), 313–336. https://doi.org/10.1007/s11067-017-9375-9
- Pike, A., Dawley, S., & Tomaney, J. (2010). Resilience, adaptation and adaptability. Cambridge Journal of Regions, Economy and Society, 3(1), 59–70. https://doi.org/10.1093/cjres/rsq001
- Piramuthu, S. (2008). Input data for decision trees. Expert Systems with Applications, 34(2), 1220–1226. https://doi.org/10.1016/j.eswa.2006.12.030
- Reggiani, A., De Graaff, T., & Nijkamp, P. (2002). Resilience: An evolutionary approach to spatial economic systems. Networks and Spatial Economics, 2(2), 211–229. https://doi.org/10.1023/A:1015377515690
- Rizzi, P., Graziano, P., & Dallara, A. (2018). A capacity approach to territorial resilience: The case of European regions. The Annals of Regional Science, 60(2), 285–328. https://doi.org/10.1007/s00168-017-0854-1
- Rose, A. (2004). Defining and measuring economic resilience to disasters. Disaster Prevention and Management, 13(4), 307–314. https://doi.org/10.1108/09653560410556528
- Rose, A., & Liao, S. Y. (2005). Modelling regional economic resilience of disasters. Journal of Regional Science, 45(1), 75–112. https://doi.org/10.1111/j.0022-4146.2005.00365.x
- Sassen, S. (2006). Territory, authority, rights: From medieval to global assemblages. Princeton University Press.
- Saunders, R. (2003). Defining vulnerability in the labour market. Canadian Policy Research Networks Incorporated.
- Schwab, K. (2010). The global competitiveness report 2010–2011. World Economic Forum (WEF).
- Schwab, K., & Porter, M. E. (2007). The global competitiveness report 2007–2008. World Economic Forum (WEF).
- Seeliger, L., & Turok, I. (2013). Towards sustainable cities: Extending resilience with insights from vulnerability and transition theory. Sustainability, 5(5), 2108–2212. https://doi.org/10.3390/su5052108
- Simmie, J., & Martin, R. (2010). The economic resilience of regions: Towards an evolutionary approach. Cambridge Journal of Regions, Economy and Society, 3(1), 27–43. https://doi.org/10.1093/cjres/rsp029
- Simon, D., Griffith, C., & Nagendra, H. (2018). Rethinking urban sustainability and resilience. In T. Elmqvist, X. Bai, N. Frantzeskaki, C. Griffith, D. Maddox, T. McPhearson, S. Parnell, P. Romero-Lankao, D. Simon & M. Watkins (Eds.), Urban planet: Knowledge towards sustainable cities (pp. 149–162). Cambridge University Press. https://doi.org/10.1017/9781316647554.009
- Soulsby, A., & Clark, E. (2007). Organization theory and the post-socialist transformation: Contributions to organizational knowledge. Human Relations, 60(10), 1419–1442. https://doi.org/10.1177/0018726707083470
- Storper, M. (1997). The regional world: Territorial development in a global economy. Guilford Press.
- Storper, M. (2013). Keys to the city: How economics, institutions, social interactions and politics affect regional development. Princeton University Press.
- Stough, R. R., Kourtit, K., Nijkamp, P., & Blien, U. (2018). Modelling aging and migration effects on spatial Labor markets. Springer.
- Šulc, Z. (2004). Stát a ekonomika. Karolinum.
- Tafti, M. T. (2019). Urban resilience and the politics of scale. In K. Borsekova & P. Nijkamp (Eds.), Resilience and urban disasters (pp. 154–174). Edward Elgar.
- Thissen, M., Van Oort, F., Diodato, D., & Ruijs, A. (2013). Regional competitiveness and smart specialization in Europe: Place-based development in international economic networks. Edward Elgar.
- Tompkins, E. L., & Adger, W. N. (2004). Does adaptive management of natural resources enhance resilience to climate change? Ecology and Society, 9(2), 1–14. https://doi.org/10.5751/ES-00667-090210
- Turner, M. D. (2014). Political ecology I: An alliance with resilience? Progress in Human Geography, 38(4), 616–623. https://doi.org/10.1177/0309132513502770
- Vale, L. J. (2014). The politics of resilient cities: Whose resilience and whose city? Building Research & Information, 42(2), 191–201. https://doi.org/10.1080/09613218.2014.850602
- van Dijk, J., & Edzes, A. (2016). Towards inclusive and resilient regional labour markets: Challenges for research and policy. Investigaciones Regionales – Journal of Regional Research, 36, 169–190.
- Venhorst, V. (2012). Smart move? The spatial mobility of higher education graduates. RUG.
- Venhorst, V. (2013). Graduate migration and regional familiarity. Tijdschrift Voor Economische en Sociale Geografie, 104(1), 109–119. https://doi.org/10.1111/tesg.12000
- Weichselgartner, J., & Kelman, I. (2015). Geographies of resilience: Challenges and opportunities of a descriptive concept. Progress in Human Geography, 39(3), 249–267. https://doi.org/10.1177/0309132513518834
- Williams, D. (2010). Industrial policy. Local Economy, 25(8), 612–621. https://doi.org/10.1080/02690942.2010.533425