
 ?Mathematical formulae have been encoded as MathML and are displayed in this HTML version using MathJax in order to improve their display. Uncheck the box to turn MathJax off. This feature requires Javascript. Click on a formula to zoom.
ABSTRACT
Local energy systems (LES) are designed to decarbonize, balance, and coordinate supply, storage and demand resources. Which local conditions enable LES to flourish? Using a unique dataset of 146 LES projects in the UK from 2010 to 2020, we apply econometric methods to identify energy, institutional and socio-economic conditions significantly associated with LES, but not other local energy forms. We show distributed power generation, low-carbon infrastructure firm activity, local government strategy and active energy efficiency markets are enablers of LES involving multiple actors, sectors and skill sets. These conditions describe a clear policy agenda for stimulating and supporting emerging local energy markets.
1. INTRODUCTION
Global warming has detrimental environmental and socio-economic implications. The Intergovernmental Panel on Climate Change’s (IPCC) (Citation2022) Sixth Assessment Report states that ‘any further delay in concerted anticipatory global action on adaptation and mitigation will miss a brief and rapidly closing window of opportunity to secure a liveable and sustainable future for all’ (p. 33). Regions and cities play a prominent role in sustainable transitions (Gibbs & Lintz, Citation2016; Turok et al., Citation2017). They can catalyse regime change and accelerate transition dynamics, initiated through local niches (Boschma et al., Citation2017). Gibbs and O’Neill (Citation2017) apply the multilevel perspective to examine sustainability transitions across macro-, meso- and micro-scales considering: (1) the landscape of exogenous social, cultural, political and material trends, (2) socio-technical regimes, centred around fossil-fuel-based energy systems and (3) protected niches as ‘testbeds’ for innovations that can potentially challenge and destabilize incumbent regimes. Local areas and regions can function as niches in these transitions by providing space for innovations to emerge, be tested and improve (Gibbs & O’Neill, Citation2017). From an institutional perspective, local authorities (LAs) also have a role to play in niche-led sustainability transitions (Graute, Citation2016). However, as both local areas and LAs vary widely in their characteristics, it is not clear what specific local conditions enable niche-led challenges to incumbent centralized energy systems as part of a wider sustainability transition. Our study is a response to this knowledge gap: it seeks to understand both the underlying socio-economic, institutional and political dynamics that drive local energy-led sustainability transitions (Truffer & Coenen, Citation2012) as well as geographical connections and interactions (Hansen & Coenen, Citation2015; Truffer et al., Citation2015).
Achieving net-zero emissions at the local level is a key objective for sustainability transitions (Ravetz et al., Citation2021). Local energy initiatives are becoming increasingly relevant within regional and urban planning to develop carbon-neutral cities and regions. Local energy means activities, initiatives or investments that are place-based responses to needs or opportunities rooted in local contexts. Variation in contexts means variation in project purposes, scopes and institutional arrangements. Despite technological variation across different forms of local energy, the renewable power generation is commonly involved, particularly site-specific solar photovoltaics (PV) enabled by rapidly falling costs, secure long-term revenue streams through feed-in tariffs and relatively low complexity (Braunholtz-Speight et al., Citation2020). But this is now changing. Offtake subsidies for renewable power have been cut or removed, and direct public funding for local energy has been eroded (Tingey & Webb, Citation2020). The technological and policy landscape has also shifted towards more market-oriented activities (Devine-Wright, Citation2019) and rapid electrification of transport and heat (European Commission, Citation2020b). This has paved the way for the emergence and deployment of specific forms of local energy, in particular local energy systems (LES) projects.
LES projects have functioned as testbeds of innovation at the local level in the UK over the last decade. They combine activity across multiple sectors and energy vectors within integrated local systems. LES sits at the intersection between the four ‘D’s driving the energy transition (European Commission, Citation2019): decarbonization towards net-zero emissions; digitalization for smarter coordination and control of supply, demand and storage resources (International Energy Agency (IEA), Citation2017); democratization opening up energy markets to new actors, including household producers and local government (Schot et al., Citation2016); and decentralization towards more localized networks that balance supply and demand (Berka & Dreyfus, Citation2021). LES are the ‘business model’ response to emerging opportunities to generate, integrate, balance and trade energy locally both within electricity systems and across other energy vectors (Fuentes González et al., Citation2021). This implies multiple value streams that need to be captured by multiple actors with diverse technical and commercial skills. Wider future LES deployment is important for UK decarbonization as it can unlock the potential for decentralized flexibility. In contrast to electricity distribution network upgrades and new energy generation infrastructures, LES can enable system-wide cost savings of up to 19% by boosting demand flexibility and local storage resources that in turn facilitate the integration of large volumes of variable renewable generation (Aunedi & Green, Citation2020).
The present study contributes to regional studies debates on the role of local area-based and niche-led sustainability transitions by analysing a unique dataset of 146 LES projects implemented in the UK over the last decade. This comprehensive and detailed sample of local energy innovations helps us understand the local drivers and enablers of change. We employ spatial econometric methods to identify the socio-economic, geographical, institutional and political conditions that are significantly associated with the deployment of LES projects. Our findings inform UK energy and regional policy while contributing to scientific understanding of socio-technical transitions originating in place-based niches.
We demonstrate empirically that the local conditions associated with LES have expanded and become more complex compared with earlier forms of local energy. This supports our argument that LES projects are part of a broader socio-technical transformation in the energy system. Based on a decade of trials, demonstrators and early-stage commercial LES in the UK, we show that local areas with higher levels of distributed or utility-scale renewable generation, with more electric vehicle (EV) charging infrastructure, and with less accessible gas infrastructure have greater needs for LES to manage and balance electricity networks. We show that local areas with more economic activity in the technology sector, more strategic LAs and more active energy efficiency markets have stronger enablers of LES involving multiple actors, sectors and skill sets. This combination of needs and enablers characterizes the institutional, technological, socio-economic and geographical conditions under which LES are most likely to thrive within the broad local energy landscape
Thus, our analysis shapes a clear policy narrative for supporting decentralized decarbonization strategies. National and local policymakers should strategically invest in digital skills and technological activity, de-risk value streams from distributed storage and demand resources and provide clear long-term strategic frameworks towards a net-zero emission energy system.
2. LOCAL CONDITIONS RELATED TO THE DECENTRALIZATION OF ENERGY SYSTEMS
To support our claim that decentralized decarbonization strategies are promising solutions we develop an empirical analysis of exiting LES initiatives to identify key local conditions. We claim that six elements () can play a key role: energy networks, socio-economics and housing, local government, social capital, local economy, and geography. LES are either enabled by these conditions or provide solutions to problems these conditions create.
Table 1. Local conditions associated with LES with corresponding hypotheses tested empirically in the present study.
2.1. Energy networks
LES are potential responses to a range of infrastructure challenges, particularly in the electricity sector. Low installed conventional generation capacity can create supply constraints on local networks, whereas high intermittent renewable generation increases the complexity of balancing supply and demand. In the UK over 30 GW of power-generation capacity is connected to distribution networks, of which over 85% is renewables (including 13 GW of solar PV, mainly on rooftops) (Dukes, Citation2020). Decarbonization also means electrifying heat and mobility through widespread substitution of heat pumps for gas boilers and EVs for internal combustion engines. These additional loads on power networks exacerbate potential supply constraints during peak demand periods, risking price spikes and power outages (Eyre & Baruah, Citation2015). Adoption of EVs is incentivised by more locally available charging infrastructure (Morton et al., Citation2018). In the UK around 85% of dwellings use gas for heating. Rural and other areas with limited access to gas infrastructure already place greater demands on electricity networks.
We hypothesize local conditions associated with LES may include low conventional generation capacity (E1, E2), electricity network balancing constraints (E3, E4), low surplus electricity network capacity (E5–E7).
Multi-vectorFootnote1 LES create substitution opportunities across power, heat, gas and mobility networks to increase flexibility and balance real-time demand (Chicco & Mancarella, Citation2009). LES can enhance demand response and distributed storage as local solutions for system balancing, avoiding the need for costly network upgrades to increase supply capacity (Jain et al., Citation2017). Demand response allows network operators to remotely curtail or shift large industrial loads in times of supply shortage. Smart meters are a critical enabling technology for home energy management systems coupled with time-of-use pricing to extend demand response into residential and commercial sectors (Khan et al., Citation2015). EV batteries store electricity when parked. Recharged through smart charging or ‘vehicle-to-grid’ arrangements, EVs serve as distributed storage resources available to network operators during periods of peak demand (Wolinetz et al., Citation2018).
We hypothesize local conditions associated with LES may include low multi-vector integration (E8), low demand flexibility (E9, E10), and low distributed storage (E11).
2.2. Socio-economics and housing
LES may include demand-side efficiency improvements for reducing loads on supply networks and smart controls for integrating demand-side resources. Energy efficiency retrofit programmes to upgrade the building stock can substantially improve thermal comfort and reduce energy bills (Rosenow & Galvin, Citation2013). Retrofits in owner-occupied dwellings are supported by energy audits or assessments which identify cost-effective measures by dwelling type (e.g., the Green Deal in the UK) (Pettifor et al., Citation2015). Energy-efficiency market activity is an indicator of household-led investments in improved energy infrastructure (Webber et al., Citation2015). LAs and utility programmes target fuel poverty through energy-efficiency upgrades in lower income households living in older, inefficient homes (e.g., ECO in the UK). Public procurement of retrofit measures in social housing and public buildings offers testbeds for newer technologies including heat pumps and EV charging. Demand in densely populated urban areas may stretch the available supply infrastructure, particularly as heat pump deployment to decarbonize heating shifts demand from gas to electricity networks (Love et al., Citation2017).
We hypothesize local conditions associated with LES may include more fuel poverty or deprivation (S1–S4), older or more energy-inefficient dwellings (S5), and increased energy retrofit of the building stock (S6).
2.3. Local government
LAs and other public sector organizations are potentially important actors in LES (Kuzemko & Britton, Citation2020). By developing sustainable energy plans, setting climate action targets or declaring climate emergencies, local governments can signal strong political support for private investments in new energy infrastructure (Graute, Citation2016; Kuzemko & Britton, Citation2020). LAs with a greater capacity to raise or bid for capital financing may also play more direct roles in LES as project leaders, partners or investors (Kuzemko & Britton, Citation2020). In-house skills and expertise, including through past experience with local energy, enable LAs to develop, fund, implement and manage complex LES involving different actors, multiple energy vectors and broad public engagement (Bayulgen, Citation2020; Rydin & Turcu, Citation2019).
We hypothesize that local conditions associated with LES may include more clean energy or climate action goals (L1), more LA access to capital funding (L2, L3), and more trusted local energy partners (L4).
2.4. Social capital
LES are enabled by public support (e.g., for new LA business models) as well as active public involvement (e.g., heat pump deployment or EV charging infrastructure in residential neighbourhoods). Civic engagement, proxied by indicators such as volunteering rates or election turnouts, is a measure of social capital which defines human relationships and behaviours under which aspects of everyday life obtain an instrumental value (Scrivens & Smith, Citation2013). Conversely, civic engagement may be undermined in areas with high turnover or more transient populations (e.g., overheated housing markets, large amounts of short-term rental properties). Community and local energy initiatives led by grassroots organizations are both an indicator of social capital and are enabled by it. The same applies to LES, although they are more likely to be private sector-led or involve public–private partnerships (Bauwens, Citation2019; Kooij et al., Citation2018).
We hypothesize that local conditions associated with LES may include higher levels of civic engagement (I1, I2), and more stable local demographics (I3).
2.5. Economic activity
As a market-oriented form of local energy drawing on different commercial and technical skillsets, LES are linked to and enabled by local economic activity. LES may be seen as discretionary investments appropriate only for strong local economies, or as opportunities to stimulate economic growth, jobs and local supply chains (Dejardin & Fritsch, Citation2011). Local firms and market activity in energy, digital, science and engineering sectors build knowledge resources available to LES (Fritsch & Schindele, Citation2011). University departments and research institutions can also act as project partners and contribute to available local skills through knowledge transfer (Popp, Citation2017).
We hypothesize that local conditions associated with LES may include more economic activity (V1), and more energy, technology, and digital business and research expertise (V2, V3).
2.6. Natural resources
‘Energy materialities’ describe the dependency of sustainable energy plans, policies and projects on available energy resources (Kuzemko & Britton, Citation2020). LES may exploit locally available renewable resources or be a response to local climatic conditions. Solar, wind, bioenergy and geothermal resources are important for decarbonizing supply networks. On the demand side, heating and cooling profiles for buildings vary as a function of local climate and building stock characteristics (Atalla et al., Citation2018). Local areas in colder climates may face greater supply constraints for heat during winter peak periods (Fazeli et al., Citation2016).
We hypothesize that local conditions associated with LES may include climate conditions (G1) and renewable resource availability (G2).
3. DATA
To test these hypotheses we use the UK as a test case for the transition to market-oriented LES against a backdrop of ongoing power sector decarbonization (Rydin & Turcu, Citation2019). We use an updated and extended dataset of energy system demonstrator projects originally compiled by the UK Energy Research Centre (Flett et al., Citation2018). Energy system demonstrators are local energy projects that deploy and test multiple technologies that can assist low-carbon system operation (Flett et al., Citation2018). This can enable improved integration, coordination, and balance of supply and demand on electricity networks. These projects are increasingly incorporating multi-vector approaches across heat, power and transport systems. As commercial demonstrators, all projects were partly or fully financed by public funding sources such as Innovate UK or Horizon 2020 so are positioned in the market formation stage of LES development (Gallagher et al., Citation2012).
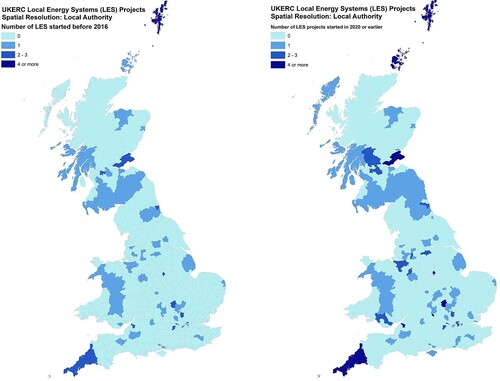
The dataset reports the spatial distribution of 146 LES demonstrator projects implemented from 2010 to 2020 along with information on scale, the technologies deployed and the actors involved (). Over time, the number of LES projects has been steadily increasing across LAs.Footnote2 LES projects are characterized by wide technological, institutional and spatial variation (Fuentes González et al., Citation2021). The LES projects in our sample use 42 types of technology,Footnote3 different types of partners (private, third sector and dedicated partnerships), and are located in metropolitan, urban, semi-urban, as well as rural areas (e.g., Figure A4 in Appendix A in the supplemental data online shows LAs with limited access to gas). We exploit spatial variation to test for associations with local conditions measured at the LA level.Footnote4 The number of LES per LA varies from 0 to 7, with about 20% of LAs having at least one LES (see Figure A1 online).
Figure 1. Spatial distribution of local energy systems (LES) projects across 380 local authorities (LAs) in England, Wales and Scotland.
Note: LAs with more than two LES projects are Glasgow (three projects), Newcastle under-under-Lyme (three), Rhondda Cynon Taf (three), Scilly islands (three), St Albans (three), Fife (four), Milton Keynes (four), Orkneys (four), Oxford (four), Westminster (four), Bristol (six), Cornwall (six), Shetlands (six) and Nottingham (seven).
Accounting for this truncated and zero-weighted distribution, we develop a consistent model selection strategy to identify local conditions (independent variables) significantly associated with LES implemented in the UK over the past 10 years (dependent variable) (). We also run a series of robustness checks to demonstrate external validity, both using time-series data as alternative independent variables and diverse modelling specification strategies, and using community energy (CE) and LES project clusters as alternative dependent variables.
Table 2. Variables specified in integrated regression model.
Data measuring independent variables are reported in various spatial and temporal formats (see Figure A3 in Appendix A in the supplemental data online). This limits our ability to construct a continuous balanced dataset that accounts for all existing variables with consistent spatial and temporal coverage. To resolve this constraint, we have effectively constructed two separate datasets. The first dataset, which we mainly focus on this analysis, is a cross-sectional dataset that accounts for all existing variables at the spatial level of LAs as the most commonly available spatial resolution. Depending on the statistical nature of each metric (see Tables A2–A7 in Appendix A in the supplemental data online), we have compiled the cumulative sum over time (e.g., cumulative count of active renewable energy (RE) projects per LA) or the mean value over time (e.g., average household income per LA) so that we consistently report all variables with a temporal dimension in the cross-sectional dataset. Being aware of potential bias in the empirical estimates of cross-sectional analysis due to restrictions in temporal coverage, we have also compiled a second panel time-series dataset for all variables with available temporal dimension (see Figure A3 online). This panel dataset is unbalanced due to increased variability in the reported time frames, so we use it mainly to check the stability of our cross-sectional findings over time.
4. METHODOLOGY
We start by employing a model selection strategy in section 4.1. to identify local conditions associated with LES (, column 2). We allocate independent variables that control for local conditions by categories (, column 1) and estimate linear regression models for each category’s set of variables (, column 3). This was to identify statistically significant predictors out of many regressors (see Figure A3 in Appendix A in the supplemental data online), always considering model-fitness and diagnostic tests. We then incorporated the best performing predictors across categories into a final integrated regression model ().
Focusing on the integrated model in section 4.2., we use linear and Poisson regression models to pinpoint the local conditions significantly associated with LES (, columns 1 and 2, respectively). We also investigate in section 4.3. the differences between ‘threshold conditions’ associated with a local area having at least one LES, and ‘intensity conditions’ associated with an area having multiple LES. We fit binary logit and probit models to identify threshold conditions, 0 and 1 (, column 3). We fit weighted Poisson regression models to identify intensity conditions 1–7 (, column 4). The latter models give increased statistical weight to areas with more than one LES project.
Table 3. Regression models of local conditions associated with local energy systems (LES) projects.
We test the external validity of our results for LES specifically, rather than local energy more generally, by re-running our analysis using a second dataset on CE projects in the UK as our dependent variable (section 5.2). Our expectations were that local conditions associated historically with CE would be more limited than conditions associated with LES as CE tend to have lower technological complexity and less diverse actors involved (Mirzania et al., Citation2019). As a further robustness test for our main results, we use cluster analysis to identify discrete institutional and technological profiles of LES within our dataset, and then test whether our results for LES are robust to variation in project type (section 5.3) and robust to support our hypothesis of LES crucial drivers to draw general policy insights for UK and abroad.
4.1. Model selection strategy
We use the number of LES per LA across the UK as main dependent variable. We start the empirical analysis using the ordinary least squares (OLS) estimator to identify the predictors able to control for LES diffusion across Great Britain (GB):
(1)
(1) where
represents the number of LES; and
represents the vector of independent variables for LAs
The OLS estimator is a useful exploratory tool because it provides a ‘reasonable direct estimate of the sample-average marginal effect on the probability that y = 1 as x changes’ (Cameron & Trivedi, Citation2005, p. 471). Nonetheless, it relies on stringent assumptions for the error term, and it can deliver predicted probabilities
that might be negative. Consequently, we limit our use of the OLS estimator to fit linear regression models that identify the subset of variables for full testing in subsequent non-linear models.
Having compiled a large number of independent variables that might be associated with LES diffusion (see Tables A2–A7 in Appendix A in the supplemental data online), we use a model selection strategy to identify the subset of independent variables that can explain LES diffusion. We first allocate our variables into our six categories of interest (): energy networks and systems, socio-economic and building stock, local government, social capital, local economy, and natural resources. We start our analysis by focusing on a single category of variables, starting with energy networks and systems. To determine the best performing model specification, we take into account correlations between specific regressors,Footnote5 the statistical nature of the regressors (e.g., count, continuous, dummy variables) and underlying assumptions over the expected results based on the reviewed literature. Our aim is to identify the statistically significant predictors out of a large pool of regressors, always considering model-fitness and diagnostic tests. We repeat this empirical exercise for all categories of independent variable. We conclude on an integrated regression model that incorporates all statistically significant predictors across all categories of regressors. (column 1) shows the final integrated linear regression model which is the best performing model specification.
To enhance our regression approach in favour of more appropriate models we present a set of alternative model specifications (see Table B1 in Appendix B in the supplemental data online). We focus on the variables with higher correlations (EVs and information and communication technology (ICT) firms, utility-scale and distributed RE projects). We interchangeably remove one of the variables with a high correlation and observe whether the size and/or statistical significance of the other coefficients change considerably as an indicator of spuriousness. Table B1 online shows this not to be an issue. In addition, we can observe that model specifications in Table B1 have relatively good-fit properties while the residuals are not spatially correlated (according to the Moran test).Footnote6 Thus, having selected the subset of variables that can explain the diffusion of LES, we can confidently proceed to the non-linear regression model.
4.2. Count regression model
As our dependent variable is a count variable measuring the number of LES across LAs, we use the Poisson regression model that does not have the restrictive assumptions of error term of the OLS estimator. More specifically the error term has now a Poisson distribution and the model is formalized as:
(2)
(2) where
LES;
represents the factors influencing the intensity of LES and both the mean and variance are equal to μ, that is,
and
, also known as the equi-dispersion property of the Poisson distribution (Cameron & Trivedi, Citation2005, p. 668). Parameterizing the relationship between
and the vector of independent parameters
, one derives the Poisson regression model that is estimated with the use of the maximum likelihood estimator:
(3)
(3) where
is the constant term,
represents the vector of independent variables for LAs
, and
is the residuals of the Poisson regression model. Given coefficient estimates from the Poisson model are not informative, we estimate the marginal effect (denoted as ‘margins’ in ) so that each coefficient expresses the marginal impact on LES, assuming all the others are constant at their means. These margins are comparable with the OLS coefficients. We can observe that both statistical significance and size of margins (, column 2) are consistent to the equivalent coefficients obtained from the linear regression model (, column 1). This confirms our modelling approach. As a further robustness check, we also use the Poisson quasi-maximum likelihood estimator (MLE) model (or quasi-Poisson) that relaxes the restrictive assumption of equi-dispersion between mean and variance. We can observe in Table B2 in Appendix B in the supplemental data online that coefficient estimates, and associated margins are remarkably similar to the ones estimated using the Poisson regression model and weighted Poisson regression model in (columns 2 and 3, respectively). The statistical significance of some of the coefficients improves in Table B2 online, while the quasi-Poisson model specifications have very good fitness properties.
4.3. Threshold and intensity conditions
We also investigate the ‘threshold conditions’ associated with the development of the first LES in LAs with no pre-existing LES. Similarly, we investigate the ‘intensity conditions’ associated with the diffusion of multiple LES in LAs with at least one LES project. We employ (1) a binary regression model (logit model) to identify ‘threshold conditions’ (0 and 1) and (2) a weighted Poisson regression modelFootnote7 to identify the ‘intensity conditions’ (1–n). As an additional test that allows us to examine the ‘extensive’ and ‘intensive’ margins, we re-estimate the probit model (Equationequation 4(4)
(4) ) and the linear regression model (Equationequation 1
(1)
(1) ) with one-year lagged independent variables using our panel dataset. The approach and findings of this additional test are provided in Appendix B in the supplemental data online, and specifically in Table B8.
The binary regression model allows us to identify local conditions associated with switching from the threshold of 0–1 LES. We employ the binary logit model that estimates the probability Pr( ) that the dependent against the alternative that
:
(4)
(4) The logit model uses a logistic distribution for the function
. We present results for the logit model in (column 3). We also present results for the binary probit model as robustness check (see Table B4 in Appendix B in the supplemental data online) and we find that the two binary models (logit and probit) produce identical results.
The weighted Poisson model allows us to estimate intensity conditions that lead to multiple LES within specific LAs. We apply natural weights to the dependent variable for the Poisson regression model which effectively reduces our sample size to the LAs with at least one project (i.e., 20% of our sample). Out of the specified LAs, this model gives increased statistical weight to those LAs with more than one LES. Results for the weighted Poisson model are presented in (column 4).
5. EXTENDED METHODOLOGY TESTING FOR SOCIO-TECHNICAL TRANSITIONS
5.1. Temporal consistency of LES projects
The emergence of LES projects across the UK over the past decade could indicate a broader transition in the niche-led challenges to a centralized energy system. Temporal consistency in the deployment of LES would support this argument by showing that LES are not one-off local scale phenomena. To examine this hypothesis, we employ our panel dataset to test the consistency of our cross-sectional findings from 2010 to 2020, subject to available data resources. We re-estimate our baseline model specification (, column 2) employing the panel dataset that excludes predictors without temporal dimension (e.g., ‘access to gas’, ‘volunteering rate’). We then assess whether our empirical findings are consistent between cross-sectional model (, column 2) and panel data model (see Table B3 in Appendix B in the supplemental data online), and whether we can derive any additional insights from the panel data model. As an additional test, we estimate a panel data model in which independent variables are lagged by one period and compare the results with the model controlling for the contemporaneous effect (see Table B6 online). Results indicate considerable similarities between cross-sectional and panel data coefficients and, by extension, support the finding that cross-sectional results are stable over time.
5.2. Transitioning from CE to LES projects
There is evidence in the literature of a transition underway from CE to local energy (Devine-Wright, Citation2019). CE emphasizes bottom-up initiatives with strong citizen participation, local ownership and renewable power generation particularly solar PV (Devine-Wright, Citation2019). In contrast to LES projects, CE does not typically involve multiple energy vectors, more advanced smart technologies, partnership across sectors or significant private investment. A broader market shift from CE to LES projects is indicative of wider system change in which the disruptive characteristics of local energy niches move towards market-oriented business models. To examine this hypothesis, we test whether a smaller subset of regressors explains the spatial distribution of CE than is the case for LES (). Drawing on Community Energy Hub and Community Energy Scotland datasets, we identify the location of 393 CE projects and map them to the 380 LAs as our spatial unit of analysis. The clear majority of CE in our dataset started after 2010. Figure C2-1 in Appendix C in the supplemental data online shows the spatial distribution of CE. We use these data on CE as an external validity test of whether an alternative but related dataset generates comparable but distinctive findings. We expect our results to show the local energy landscape has shifted from CE to more complex and technologically advanced LES. So, we expect a narrower set of local conditions to be associated with CE, relative to the diverse set of local conditions associated with LES. To do that, we re-estimate our baseline linear regression model using the number of CE as dependent variable (instead of the number of LES).Footnote8
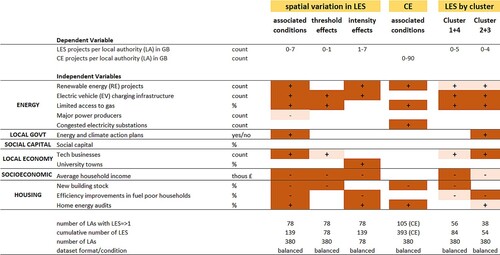
Figure 2. Comparative summary of models testing local conditions associated with local energy systems (LES) and community energy (CE) projects.
Note: Visually compared are the regression results presented in and the CE results (see Appendix C in the supplemental data online). The numbers of LES projects are dependent variables for all models except for the CE column, for which the number of CE projects is the dependent variable. The LES dataset covers 146 projects in the UK begun from 2010 to 2020, of which 139 have specific geographical locations. The independent variables shown are the robust predictors across different model specifications. Dark and light shading indicate strong and weak statistical significance, respectively; signs indicate a positive or a negative association with the numbers of LES (or CE) projects. Blank cells indicate predictors that become statistically non-significant in the final integrated models (see the text for details). provides full details of models with coefficient estimates (and the marginal probabilities estimates for the Poisson regression model).
5.3. Heterogeneity within LES projects
Wider deployment of LES projects requires that they adequately accommodate unique local conditions. A one-size-fits-all type of local energy cannot successfully support a broader transition as regions have distinct characteristics and needs. Thus, we expect that LES are sufficiently heterogenous to account efficiently for distinct geographical, socio-economic and institutional characteristics across regions. To examine this hypothesis, we categorize LES into distinct subgroups with homogenous characteristics and re-estimate our baseline model specification (, column 2). Specifically, we use hierarchical cluster analysis to identify groups of LES with similar geographical, scale, technological and institutional characteristics (Wilson et al., Citation2020). We use dummy variables with squared Euclidean distance as a measure of similarity. Given that cluster solutions are sensitive to outliers, we started by using a single linkage (nearest neighbour) clustering method so that we identify outlier projects that are only weakly related to all other LES on the cluster variables. We then screened out identified outliers in the main analysis using Ward’s clustering method which allows to identify clusters of similar sizes and low within-cluster variance. We examined two-, three- and four-cluster solutions by testing for differences across the cluster variables to clearly differentiate and characterize the types of projects in each cluster. The four-cluster solution was the most clearly interpretable ().
Figure 3. Local energy systems (LES) clusters.
Note: Four common types of LES projects are identified using cluster analysis of geographical, scale, technological and institutional characteristics of 146 projects. Cluster descriptions show the percentage of projects within each cluster that share the distinguishing characteristics of that cluster. For more information on the loading of the factors used to determine the clusters, see Figure D1 in Appendix D in the supplemental data online.
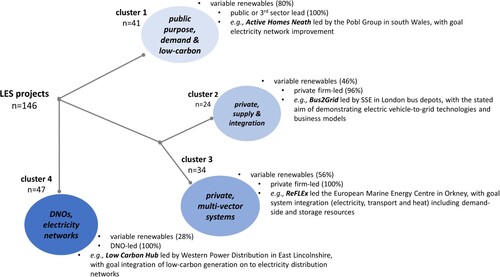
We then re-estimate the Poisson regression model specified in (column 2) for each distinct cluster or type of LES project (). We evaluate and compare cluster regression results (see Table D1 in Appendix D in the supplemental data online) to baseline regression results (, column 2). As with our use of CE projects as an alternative dependent variable, we use LES clusters to test the robustness of our methodological approach to variation in LES characteristics. First, we re-estimate the Poisson regression model for older types of LES using projects in public purpose end-use (cluster 1) and distribution network operator (DNO)-led electricity network improvement (cluster 4) as our dependent variables. Second, we use more recent types of LES in private firm-led supply integration (cluster 2) and smart, multi-vector systems (cluster 3 as our dependent variable) (). Our findings confirm local conditions associated with LES clusters are in line with expectations when considering the distinct characteristics of each cluster.
6. RESULTS
6.1. Local conditions significantly associated with LES projects
Which local conditions enable LES projects?
Which local conditions do LES projects provide solutions for?
6.2. Threshold and intensity conditions
Are some local conditions associated with initial LES projects while others are associated with multiple LES projects?
For ‘intensity conditions’ (, column 4), we find areas with higher numbers of active RE projects, more EV charging infrastructure, more home energy audits (but not fuel poverty investments), and presence of local universities, are more likely to have multiple LES. High levels of renewables, EV charging infrastructure and energy efficiency retrofit programmes are consistent with substantial and diverse technical expertise available locally to support multiple LES. As well as contributing skills, universities can also act as project partners. Indeed, our university town variable has an overlapping effect with local tech businesses in our models.Footnote9 Universities can also open routes to public funding for commercial demonstrators. In further analysis of the 29 LAs with more than one LES project, we find 70% of projects in these areas include either university partners, university spinoffs or funding from traditional academic research sources.
6.3. Temporal consistency of LES projects
Have these local conditions associated with LES projects changed over time?
6.4. Transitioning from CE to LES projects
Are the local conditions associated with LES projects distinct from those associated with CE?
More specifically, re-estimating our integrated model but with CE as the independent variable, we find active RE projects, network capacity constraints, energy inefficient housing and home energy audits are conditions associated with CE (see Appendix C2 and Table C2-3 in the supplemental data online). In contrast to the wider set of conditions associated with LES, local tech expertise, EV infrastructure and sustainable action plans are not associated with CE (Braunholtz-Speight et al., Citation2020). Although social capital is expected to be significantly associated with CE, our proxy for social capital (volunteering rate) remains statistically non-significant. Given known empirical difficulties in quantifying social capital (Scrivens & Smith, Citation2013) and CE being unevenly distributed across Great Britain (see Figure C2-1 online), we re-estimate our model separately for Scotland, and for England and Wales, to improve model fitness (see Table C2-3 online). We find social capital is statistically significant for England and Wales (good sample size properties) but not for Scotland (small sample size).
6.5. Heterogeneity within LES projects
Are the same local conditions associated with different types of LES projects?
More specifically, we exploit this variation and identify four clusters of LES with more homogenous characteristics (). Re-estimating our models with each of these LES clusters as the independent variable, we find all four clusters are associated with certain local conditions: active RE projects, limited access to gas, and EV charging infrastructure.Footnote10 A consistent feature of LES is low surplus capacity and balancing constraints on electricity networks. We also find some variation in local conditions associated with different clusters. Historically older types of LES such as public purpose end-use (cluster 1) and electricity network improvement (cluster 4) are strongly associated with deprivation and older housing (). Conversely, more recent types of LES such as private firm-led supply integration (cluster 2) and smart, multi-vector systems (cluster 3) are strongly associated with economic activity in the tech sector, LA action plans and fewer fuel poor households (). This indicates the increasing relevance of local government strategic planning and knowledge capacity of innovative practices over the 2010–20 study period.
As our dataset comprises commercial demonstrators with part or full public funding, it might be likely that local conditions associated with particular funding objectives are overrepresented in our results. For example, successive rounds of funding for distribution network operators mean our cluster 4 is characterized by electricity network improvement projects. However, we find projects in this cluster are no more likely to be associated with network constraints or intermittent RE, so we reject the potential biasing effect of public funding availability on our results.
7. DISCUSSION AND CONCLUSIONS
LES projects are gradually developing from niches to socio-technical constellations that can challenge the existing regimes within the energy market. LES by definition are rooted in specific local contexts and, as shown in our cluster analysis (), represent various technological and institutional configurations (Fuentes González et al., Citation2021). This variety in our dataset of demonstrators and early-stage commercial LES is potentially wider than would be found after the winnowing forces of market competition in the absence of dedicated policy support. Our analysis of LES spans the period 2010–20 during which financial incentives like feed-in tariff were reduced or removed, and regulatory arrangements began shifting to enable value capture from prosumer, balancing and flexibility services (Hall et al., Citation2021). But this transition is still underway, and LES in our dataset are early tests of what’s viable. Our results show the local energy landscape shifting from CE with grassroots actors focusing on site-specific renewables to LES increasingly concerned with local flexibility, balancing and system integration (Devine-Wright, Citation2019) through both supply-side measures to strengthen networks as well as demand-side strategies tackling energy in-efficient building stock. We find local strategic investment and planning around low-carbon goals along with local knowledge and skills creates enabling conditions for LES. Thus, we provide evidence that LES projects have emerged as niches and gradually lead a broader socio-technical transition towards a sustainable development by displacing centralized, fossil-fuel based forms of energy systems. In this concluding discussion, we draw general insights from these results for future LES development.
7.1. LAs and other trusted local partners help accumulate knowledge and experience that enable successive LES projects
Despite years of austerity for LAs and reduced involvement in local energy (Tingey et al., Citation2017), local governments have important roles as enablers and instigators of LES (Tingey & Webb, Citation2020). A total of 75% of UK LAs have declared climate emergencies, but only 2% have so far published delivery plans (Gudde et al., Citation2021). LAs can facilitate or directly invest in low-carbon infrastructure and act as trusted partners in LES to help accumulate local expertise (Rydin & Turcu, Citation2019). However LAs have widely varying in-house competences, resources and abilities to access finance, and most LAs cite the need for multi-actor partnerships and the wider constellation of local actors to deliver on net-zero targets (Gudde et al., Citation2021).
Other local actors can play similar roles as ‘institutional memories’ to learn from and accumulate past experience. In our data we find three in four of the local areas with more than one LES have at least one partner involved in multiple projects. This indicates learning from experience and ‘returns to scale’ so that areas with early projects go on to do follow-up projects. These repeat partners can be from industry (62% of projects), university/research (59%), or public sector (38%). Common repeat partners are universities, and private firms providing technical expertise or energy products and services. One interpretation is that accumulated expertise available locally, and the capacity for technological experimentation, enable the deployment of multiple LES within particular areas, which further strengthens the local skills and knowledge base. Although we were unable to directly test for the presence of ‘energy champions’ as a specific local enabling condition (Bayulgen, Citation2020), our finding that repeat partners are strongly associated with LES intensity conditions supports the argument that ‘wilful individuals’ play important nucleating roles (Kuzemko & Britton, Citation2020; Tingey & Webb, Citation2020).
7.2. A broad pool of technological expertise beyond the energy and utility sector supports innovative LES projects
Decentralized coordination of supply, network and demand-side resources to balance local energy flows relies on digitalization, smart controls, and wider technological knowhow than in traditional energy businesses (Srinivas Vedantham et al., Citation2021). Our results show the enabling role of the tech sector including innovative start-ups (Colombelli & Quatraro, Citation2019) and universities (Fischer & Varga, Citation2003; Popp, Citation2017). Urban areas with experienced local businesses or university departments with relevant skill sets and the capacity for technological experimentation can function as nurseries for LES. Local governments can directly support sharing of experiences through local and regional networks (Organisation for Economic Co-operation and Development (OECD), Citation2020). Specialized training courses and educational programmes can further support knowledge exchange and capacity building (OECD, Citation2019). Transitioning from industry- to place-specific skills policy can decrease spatial imbalances and thus support wider socio-technical transition in the energy system (Corradini et al., Citation2022).
7.3. LES projects can help improve living conditions
By design, LES integrate demand patterns (e.g., winter peak loads) and demand-side resources (e.g., flexible loads and smart controls) into energy system operation. We find LES facilitate efficiency improvements in housing, particularly in older homes and homes without access to the gas grid (Rosenow & Galvin, Citation2013). LES can also help deliver new EV charging infrastructure with the co-benefit of reducing local air pollution from vehicles, and balancing new demands placed on power networks from the EV transition (Eyre & Baruah, Citation2015).
7.4. LES projects are potential means of ‘levelling up’ disadvantaged local areas
Both LES and local conditions associated with LES are unevenly distributed. Economic development policies targeting disadvantaged areas can support more equitable distribution of LES by providing appropriate financial and regulatory incentives to energy and technology businesses and entrepreneurs (Feldman et al., Citation2021). Improving local actors’ access to finance and reducing regulatory burdens can support the development of small and medium-sized enterprises (SMEs) in targeted areas, and incentivise businesses to relocate their local units (European Commission, Citation2020a). This can support the development of local skills while incentivizing collaborations between local governments and private actors (OECD, Citation2019). We did not find LES to be more common in areas with fuel poor households, indicating the continued need for targeted fuel poverty policies and investments.
7.5. Insights on enabling conditions for LES projects apply beyond the UK to countries that are decarbonizing, decentralizing, digitalizing and democratizing their energy systems
Although our analysis was based on UK data, our findings broadly apply across national contexts undergoing similar landscape shifts towards more intermittent renewables, smarter networks, demand and storage resource integration, and electrification of mobility and heat. Market-oriented system integration projects across energy vectors are potential local solutions. LES are moving from niche to mainstream in other European countries (Delta-EE, Citation2019) and North America (Bayulgen, Citation2020). Political agendas in support of the ‘4Ds’ are also aligned with LES-type solutions both in the European Union (European Commission, Citation2020b) and across the world (Berka & Dreyfus, Citation2021).
Supplemental Material
Download PDF (1.1 MB)ACKNOWLEDGEMENTS
The authors thank Alexandros Sfyridis, Enrique Ortega Calderon and Neil Strachan for helpful comments and advice; Natalia Jones, Trudie Dockerty, Gilla Sunnenberg, Hannah Devine-Wright and Callum Rae for assistance with data preparation; and the UK Energy Research Centre (UKERC) for compiling the original LES project dataset. They are grateful to the editor and two anonymous reviewers for the constructive feedback that helped to improve the context and presentation of this article.
DATA AVAILABILITY
Data and syntax used in this article can be accessed online from the Open Science Framework (OSF) repository at https://osf.io/d45hn/ (doi:10.17605/OSF.IO/D45HN).
DISCLOSURE STATEMENT
No potential conflict of interest was reported by the authors.
Additional information
Funding
Notes
1. Multi-vector corresponds to various forms of energy transfer in space and time (i.e., electricity, heat, transport, etc.).
2. On average, about 11 new LES projects started annually from 2011 to 2014, increasing to about 20 new LES projects annually from 2015 to 2018. For descriptive statistics of LES projects over time, see Figure A2 and Table A1 in Appendix A in the supplemental data online. Rae et al. (Citation2021) have also developed an interactive geographical information system (GIS) map with all LES projects included in our study; https://www.energyrev.org.uk/app_plugins/Maps/V4/index.html#5/57.681/-2.856/.
3. These types of technologies can be aggregated into six groupings based on project scopes: variable renewables, generation and storage (excluding renewables), electricity grid integration, local electricity network, energy carriers and coupling, and energy end-use (Wilson et al., Citation2020).
4. There are 380 LAs across England, Wales and Scotland; no projects were reported in Northern Ireland.
5. Highly correlated regressors are modelled separately to avoid spurious estimates that falsely increase model fit.
6. We also test for potential endogeneity of the regressors in Appendix B in the supplemental data online. We find no evidence that our regressors are endogenous, which supports our argument that the direction of causality goes from socio-economic parameters to LES expansion.
7. The weighted Poisson model gives increased statistical weight to LAs with more than one LES project.
8. For a detailed explanation of the methodological approach used to analyse CE projects, see Appendix C1 in the supplemental data online.
9. (column 4) shows that the university towns coefficient becomes statistically significant as the local tech businesses coefficient becomes non-significant, and vice versa in (column 3).
10. For a detailed overview, see Appendix D and Table D1 in the supplemental data online.
REFERENCES
- Atalla, T., Gualdi, S., & Lanza, A. (2018). A global degree days database for energy-related applications. Energy, 143, 1048–1055. https://doi.org/10.1016/j.energy.2017.10.134
- Aunedi, M., & Green, T. C. (2020). Early insights into system impacts of smart local energy systems. EnergyREV, University of Strathclyde Publ. https://www.energyrev.org.uk/media/1420/energyrev-newwave_earlyinsightsreport_final_202006.pdf
- Bauwens, T. (2019). Analyzing the determinants of the size of investments by community renewable energy members: Findings and policy implications from Flanders. Energy Policy, 129(October 2018), 841–852. https://doi.org/10.1016/j.enpol.2019.02.067
- Bayulgen, O. (2020). Localizing the energy transition: Town-level political and socio-economic drivers of clean energy in the United States. Energy Research and Social Science, 62(January), 1–12. https://doi.org/10.1016/j.erss.2019.101376
- Berka, A., & Dreyfus, M. (2021). Decentralisation and inclusivity in the energy sector: Preconditions, impacts and avenues for further research. Renewable and Sustainable Energy Reviews, 138(November 2020), 110663. https://doi.org/10.1016/j.rser.2020.110663
- Boschma, R., Coenen, L., Frenken, K., & Truffer, B. (2017). Towards a theory of regional diversification: Combining insights from evolutionary economic geography and transition studies. Regional Studies, 51(1), 31–45. https://doi.org/10.1080/00343404.2016.1258460
- Braunholtz-Speight, T., Sharmina, M., Manderson, E., McLachlan, C., Hannon, M., Hardy, J., & Mander, S. (2020). Business models and financial characteristics of community energy in the UK. Nature Energy, 5(2), 169–177. https://doi.org/10.1038/s41560-019-0546-4
- Cameron, A. C., & Trivedi, P. K. (2005). Microeconometrics: Methods and applications. Cambridge University Press.
- Chicco, G., & Mancarella, P. (2009). Distributed multi-generation: A comprehensive view. Renewable and Sustainable Energy Reviews, 13(3), 535–551. https://doi.org/10.1016/j.rser.2007.11.014
- Colombelli, A., & Quatraro, F. (2019). Green start-ups and local knowledge spillovers from clean and dirty technologies. Small Business Economics, 52(4), 773–792. https://doi.org/10.1007/s11187-017-9934-y
- Corradini, C., Morris, D., & Vanino, E. (2022). Towards a regional approach for skills policy. Regional Studies. https://doi.org/10.1080/00343404.2022.2031950
- Dejardin, M., & Fritsch, M. (2011). Entrepreneurial dynamics and regional growth. Small Business Economics, 36(4), 377–382. https://doi.org/10.1007/s11187-009-9258-7
- Delta-EE. (2019). The Rise of Local Energy Systems. July.
- Devine-Wright, P. (2019). Community versus local energy in a context of climate emergency. Nature Energy, 4(11), 894–896. https://doi.org/10.1038/s41560-019-0459-2
- Dukes. (2020). Digest of UK energy statistics (chapter 6). National Statistics, 106–127. https://assets.publishing.service.gov.uk/government/uploads/system/uploads/attachment_data/file/924591/DUKES_2020_MASTER.pdf
- European Commission. (2019). Clean energy for all Europeans. Euroheat and Power (English Edition), 14(2), 3. https://doi.org/10.2833/9937
- European Commission. (2020a). An SME Strategy for a sustainable and digital Europe. COM/2020/1.
- European Commission. (2020b). Communication from the Commission to the European Parliament, the Council, the European Economic and Social Committee and the Committee of the Regions. Powering a climate-neutral economy: An EU Strategy for Energy System Integration. COM/2020/299 final. July. https://eur-lex.europa.eu/legal-content/EN/ALL/?uri=COM:2020:299:FIN
- Eyre, N., & Baruah, P. (2015). Uncertainties in future energy demand in UK residential heating. Energy Policy, 87, 641–653. https://doi.org/10.1016/j.enpol.2014.12.030
- Fazeli, R., Davidsdottir, B., & Hallgrimsson, J. H. (2016). Residential energy demand for space heating in the Nordic countries: Accounting for interfuel substitution. Renewable and Sustainable Energy Reviews, 57, 1210–1226. https://doi.org/10.1016/j.rser.2015.12.184
- Feldman, M., Guy, F., & Iammarino, S. (2021). Regional income disparities, monopoly and finance. Cambridge Journal of Regions, Economy and Society, 14(1), 25–49. https://doi.org/10.1093/cjres/rsaa024
- Fischer, M. M., & Varga, A. (2003). Spatial knowledge spillovers and university research: Evidence from Austria. Annals of Regional Science, 37(2), 303–322. https://doi.org/10.1007/s001680200115
- Flett, G., Kelly, N., & McGhee, R. (2018). Review of UK energy system demonstrators. November, 39. http://www.ukerc.ac.uk/publications/review-of-uk-energy-system-demonstrators.html
- Fritsch, M., & Schindele, Y. (2011). The contribution of new businesses to regional employment – An empirical analysis. Economic Geography, 87(2), 153–180. https://doi.org/10.1111/j.1944-8287.2011.01113.x
- Fuentes González, F., Webb, J., Sharmina, M., Hannon, M., Pappas, D., & Tingey, M. (2021). Characterising a local energy business sector in the United Kingdom: Participants, revenue sources, and estimates of localism and smartness. Energy, 223. https://doi.org/10.1016/j.energy.2021.120045
- Gallagher, K. S., Grübler, A., Kuhl, L., Nemet, G., & Wilson, C. (2012). The energy technology innovation system. Annual Review of Environment and Resources, 37(1), 137–162. https://doi.org/10.1146/annurev-environ-060311-133915
- Gibbs, D., & Lintz, G. (2016). Editorial: Environmental governance of urban and regional development – scales and sectors, conflict and cooperation. Regional Studies, 50(6), 925–928. https://doi.org/10.1080/00343404.2015.1110569
- Gibbs, D., & O’Neill, K. (2017). Future green economies and regional development: A research agenda. Regional Studies, 51(1), 161–173. https://doi.org/10.1080/00343404.2016.1255719
- Graute, U. (2016). Local authorities acting globally for sustainable development. Regional Studies, 50(11), 1931–1942. https://doi.org/10.1080/00343404.2016.1161740
- Gudde, P., Oakes, J., Cochrane, P., Caldwell, N., & Bury, N. (2021). The role of UK local government in delivering on net zero carbon commitments: You’ve declared a climate emergency, so what’s the plan? Energy Policy, 154(March), 112245. https://doi.org/10.1016/j.enpol.2021.112245
- Hall, S., Anable, J., Hardy, J., Workman, M., Mazur, C., & Matthews, Y. (2021). Matching consumer segments to innovative utility business models. Nature Energy, 6(4), 349–361. https://doi.org/10.1038/s41560-021-00781-1
- Hansen, T., & Coenen, L. (2015). The geography of sustainability transitions: Review, synthesis and reflections on an emergent research field. Environmental Innovation and Societal Transitions, 17, 92–109. https://doi.org/10.1016/j.eist.2014.11.001
- Intergovernmental Panel on Climate Change (IPCC). (2022). Climate change 2022: Impacts, adaptation, and vulnerability (Eds. H.-O. Pörtner, D. C. Roberts, M. Tignor, E. S. Poloczanska, K. Mintenbeck, A. Alegría, M. Craig, S. Langsdorf, S. Löschke, V. Möller, A. Okem, & B. Rama) (pp. 3–33). Cambridge University Press. 10.1017/9781009325844
- International Energy Agency (IEA). (2017). Digitalization & energy. https://doi.org/10.1787/9789264286276-en
- Jain, R. K., Qin, J., & Rajagopal, R. (2017). Data-driven planning of distributed energy resources amidst socio-technical complexities. Nature Energy, 2(8), 1–11. https://doi.org/10.1038/nenergy.2017.112
- Khan, A. A., Razzaq, S., Khan, A., Fatima, K., & Owais, L. (2015). HEMSs and enabled demand response in electricity market: An overview. Renewable and Sustainable Energy Reviews, 42, 773–785. https://doi.org/10.1016/j.rser.2014.10.045
- Kooij, H. J., Oteman, M., Veenman, S., Sperling, K., Magnusson, D., Palm, J., & Hvelplund, F. (2018). Between grassroots and treetops: Community power and institutional dependence in the renewable energy sector in Denmark, Sweden and The Netherlands. Energy Research and Social Science, 37(September 2017), 52–64. https://doi.org/10.1016/j.erss.2017.09.019
- Kuzemko, C., & Britton, J. (2020). Policy, politics and materiality across scales: A framework for understanding local government sustainable energy capacity applied in England. Energy Research and Social Science, 62(June 2019), 1–10. https://doi.org/10.1016/j.erss.2019.101367
- Love, J., Smith, A. Z. P., Watson, S., Oikonomou, E., Summerfield, A., Gleeson, C., Biddulph, P., Chiu, L. F., Wingfield, J., Martin, C., Stone, A., & Lowe, R. (2017). The addition of heat pump electricity load profiles to GB electricity demand: Evidence from a heat pump field trial. Applied Energy, 204, 332–342. https://doi.org/10.1016/j.apenergy.2017.07.026
- Mirzania, P., Ford, A., Andrews, D., Ofori, G., & Maidment, G. (2019). The impact of policy changes: The opportunities of community renewable energy projects in the UK and the barriers they face. Energy Policy, 129(February), 1282–1296. https://doi.org/10.1016/j.enpol.2019.02.066
- Morton, C., Anable, J., Yeboah, G., & Cottrill, C. (2018). The spatial pattern of demand in the early market for electric vehicles: Evidence from the United Kingdom. Journal of Transport Geography, 72(September), 119–130. https://doi.org/10.1016/j.jtrangeo.2018.08.020
- Organisation for Economic Co-operation and Development (OECD). (2019). OECD skills strategy Flanders: Assessment and recommendations, OECD skills studies. OECD Publ.
- Organisation for Economic Co-operation and Development (OECD). (2020). Regional Strategies for the Social Economy: Examples from France, Spain, Sweden and Poland (OECD LEED Papers No. 2020/03).
- Pettifor, H., Wilson, C., & Chryssochoidis, G. (2015). The appeal of the green deal: Empirical evidence for the influence of energy efficiency policy on renovating homeowners. Energy Policy, 79, 161–176. https://doi.org/10.1016/j.enpol.2015.01.015
- Popp, D. (2017). From science to technology: The value of knowledge from different energy research institutions. Research Policy, 46(9), 1580–1594. https://doi.org/10.1016/j.respol.2017.07.011
- Rae, C., Kerr, S., & Maroto-Valer, M. M. (2021). The EnergyREV UK local energy map: User guide & summary. EnergyREV, University of Strathclyde Publ. https://www.energyrev.org.uk/media/1737/energyrev_slesmap-guidance_oct21.pdf
- Ravetz, J., Neuvonen, A., & Mäntysalo, R. (2021). The new normative: Synergistic scenario planning for carbon-neutral cities and regions. Regional Studies, 55(1), 150–163. https://doi.org/10.1080/00343404.2020.1813881
- Rosenow, J., & Galvin, R. (2013). Evaluating the evaluations: Evidence from energy efficiency programmes in Germany and the UK. Energy and Buildings, 62, 450–458. https://doi.org/10.1016/j.enbuild.2013.03.021
- Rydin, Y., & Turcu, C. (2019). Revisiting urban energy initiatives in the UK: Declining local capacity in a shifting policy context. Energy Policy, 129(September), 653–660. https://doi.org/10.1016/j.enpol.2019.02.054
- Schot, J., Kanger, L., & Verbong, G. (2016). The roles of users in shaping transitions to new energy systems. Nature Energy, 1(May), 1–7. https://doi.org/10.1038/nenergy.2016.54
- Scrivens, K., & Smith, C. (2013). Four interpretations of social capital: An agenda for measurement (OECD Statistics Working Papers No. 2013/06, 71). https://doi.org/10.1787/5jzbcx010wmt-en%5Cnhttp://www.oecd-ilibrary.org/docserver/download/5jzbcx010wmt.pdf?expires=1458923183&id=id&accname=guest&checksum=976872008C6C6EDE8AC813DCDAF435C5
- Srinivas Vedantham, L., Zhou, Y., & Wu, J. (2021). ICT infrastructure supporting smart local energy systems. January, 1–3. www.energyrev.org.uk.
- Sunley, P., Evenhuis, E., Harris, J., Harris, R., Martin, R., & Pike, A. (2021). Renewing industrial regions? Advanced manufacturing and industrial policy in Britain. Regional Studies. https://doi.org/10.1080/00343404.2021.1983163
- Tingey, M., & Webb, J. (2020). Governance institutions and prospects for local energy innovation: Laggards and leaders among UK local authorities. Energy Policy, 138(January), 111211. https://doi.org/10.1016/j.enpol.2019.111211
- Tingey, M., Webb, J., & Hawkey, D. (2017). Local authority engagement in UK energy systems: Highlights from early findings. Energy Technologies Institute, UKERC, London, and The ETI, Loughborough. http://www.ukerc.ac.uk/programmes/energy-systems-at-multiple-scales.html
- Truffer, B., & Coenen, L. (2012). Environmental innovation and sustainability transitions in regional studies. Regional Studies, 46(1), 1–21. https://doi.org/10.1080/00343404.2012.646164
- Truffer, B., Murphy, J. T., & Raven, R. (2015). The geography of sustainability transitions: Contours of an emerging theme. Environmental Innovation and Societal Transitions, 17, 63–72. https://doi.org/10.1016/j.eist.2015.07.004
- Turok, I., Bailey, D., Clark, J., Du, J., Fratesi, U., Fritsch, M., Harrison, J., Kemeny, T., Kogler, D., Lagendijk, A., Mickiewicz, T., Miguelez, E., Usai, S., & Wishlade, F. (2017). Global reversal, regional revival? Regional Studies, 51(1), 1–8. https://doi.org/10.1080/00343404.2016.1255720
- University of Essex, Institute for Social and Economic Research, NatCen Social Research, & Kantar Public. (2019). Understanding Society: Waves 1–9, 2009–2018 and Harmonised BHPS: Waves 1–18, 1991–2009. [data collection]. 12th Edition. UK Data Service. SN: 6614. https://doi.org/10.5255/UKDA-SN-6614-13.
- Webber, P., Gouldson, A., & Kerr, N. (2015). The impacts of household retrofit and domestic energy efficiency schemes: A large scale, ex post evaluation. Energy Policy, 84, 35–43. https://doi.org/10.1016/j.enpol.2015.04.020
- Wilson, C., Jones, N., Devine-Wright, H., Devine-Wright, P., Gupta, R., Rae, C., & Tingey, M. (2020). Common types of local energy system projects in the UK. EnergyREV, University of Strathclyde Publ. https://www.energyrev.org.uk/media/1442/energyrev_archetypesreport_202009.pdf
- Wolinetz, M., Axsen, J., Peters, J., & Crawford, C. (2018). Simulating the value of electric-vehicle-grid integration using a behaviourally realistic model. Nature Energy, 3(2), 132–139. https://doi.org/10.1038/s41560-017-0077-9