
Abstract
It remains unclear whether total prostate specific antigen (tPSA) or complex PSA (cPSA) has the best diagnostic performance. Additionally, the utility of percentage free PSA (%fPSA) is still debated. Our objectives were to compare the diagnostic performances of tPSA, cPSA, and %fPSA among patients referred from GP to an Urological Specialist and to investigate prognostic factors and survival in the cohort. A total of 1261 consecutive male patients without previously known prostate cancer (PCa) were referred to the same Department of Urology during June 2005 to August 2006. Some 299 patients were diagnosed with PCa and 962 patients were found without PCa. Among the PCa patients, the median age, tPSA, cPSA, and %fPSA levels were 70.8 years, 13.4 μg/L, 10.8 μg/L, and 12.6%. For patients without PCa the results were 67.5 years, 2.5 μg/L, 1.9 μg/L, and 24.9%. The sensitivity, specificity, PVpos, PVneg, and efficiency of tPSA and cPSA were overlapping (p > .05). In the tPSA interval >4 μg/L – ≤20 μg/L, %fPSA excluded PCa with a PVneg of 72.4%; 38.5% of PCa patients had a tPSA concentration >20 μg/L at the time of referral and these patients had a reduced 10-year survival as compared to patients with tPSA concentrations ≤20 μg/L. In conclusion, tPSA and cPSA showed similar diagnostic performances. %fPSA provided additional diagnostic information at tPSA concentrations >4 μg – ≤20 μg/L. The high percentage of patients with tPSA concentrations >20 μg/L indicate delayed use of tPSA resulting in advanced disease at presentation and reduced patient survival.
Introduction
Total Prostate Specific Antigen (tPSA) is used routinely as a biomarker in Prostate Cancer (PCa) to diagnose and to monitor the disease. However, a number of benign conditions, i.e. prostate hypertrophy, prostatitis, and catheterization, can cause elevated tPSA concentrations [Citation1–6]. tPSA is the sum of complex PSA (cPSA) and free PSA (fPSA). In patients with PCa, a larger fraction of PSA is bound to the plasma protease inhibitors and the percentage fPSA (%fPSA) is generally lower than in patients with benign conditions and in healthy individuals [Citation7–11]. The clinical utility of PSA in terms of differential diagnosis and prognosis is under continuous debate [Citation12–17], and its use depends on the local clinical recommendations. The use of cPSA has been argued a better choice than tPSA because of better stability of the cPSA fraction in a blood sample, thus reducing the need for fast processing. cPSA measurements have also been reported to provide a higher proportion of true negative signals (TN) and a lower proportion of false positive (FP) signals among men without PCa, and consequently enable a higher specificity than tPSA in the tPSA concentration interval >4 – ≤10 μg/L [Citation18]. Similarly, %fPSA determinations have been reported to be useful in the tPSA concentration interval >4 – ≤10 μg/L by providing a higher specificity than tPSA because the number of FP signals are reduced [Citation11,Citation19]. The aim of this investigation was to compare the diagnostic performance of tPSA, cPSA, and %fPSA in an unscreened population and to elucidate their prognostic ability in terms of 10-year survival among patients referred from primary care to an urological department in the Capital Region of Denmark for diagnosis and treatment.
Materials and methods
The report is a cross sectional, retrospective register-based long-term investigation based on a cohort of consecutively enrolled patients where tPSA, cPSA, and %fPSA were measured in each male subject during June 2005 to August 2006 where prostate cancer was a differential diagnosis. The relevant electronical records from all patients referred from the General Practitioners in the Capital Region of Copenhagen, Area North, to The Department of Urology Frederikssund Hospital Capital Region of Copenhagen, Area North during June 2005 to August 2006 were scrutinized. Area North had 310,000 inhabitants and 210 general practitioners. The patients were referred because of a broad spectrum of urological symptoms. Clinical information of diagnostic procedures as well as the final diagnosis was extracted from electronic patient records, [Patoweb, LABKA (CSC, USA), and OPUS Arbejdsplads (CSC, USA) and transferred into a database (Excel, 2010, Microsoft, USA)]. The PCa diagnosis was in all cases confirmed by a biopsy by pathology experts in the field of urology at the tertiary pathology center Department of Pathology Nordsjælland Hospital, whereas a non-PCa diagnosis was not confirmed by a biopsy in every patient. Biopsies were 6–12 core biopsies or resected prostate tissue. PCa diagnosis within 1 year of inclusion was defined as PCa (n = 37). Survival data was extracted from the Danish Civil Registration System [Citation20], which is a national database on all citizens including vital status. Cancer-related survival and follow-up PCa diagnosis data were extracted from the Danish Cancer Registry and the Danish Cause of Death Registry. Data was managed anonymously by a serial number with the code-key kept under lock. Approval of the protocol was obtained from the Danish Data Protection Agency (Datatilsynet, NOH 2014-017) and the Danish Health and Medicines Authority (Sundhedsstyrelsen, no. 2007-58-0015).
PSA measurements
In June 2005 the Department of Clinical Biochemistry Nordsjælland Hospital University of Copenhagen introduced a new routine diagnostic PSA package (Special-PSA) to the local Department of Urology including tPSA, cPSA and %fPSA. Blood samples were collected in 5 mL Terumo tubes with gel separation (VF-054SAS), centrifuged at 2500 g for 10 min at 20 °C and the serum was frozen at −20 °C within 2 h and kept frozen until analysis (1–3 days after phlebotomy). The tPSA and cPSA fractions were measured by the Siemens chemiluminescence assays on an ADVIA Centaur automated analyzer (Siemens AG, Munich, Germany). The measuring range of both the tPSA and the cPSA assay was 0.06–500 μg/L. The fPSA concentration was calculated as (tPSA – cPSA) × 100/tPSA. By chance the analytical imprecision of the two separate assays could result in negative %fPSA values. Negative %fPSA values occurred in 11 of the 299 PCa patients and in 11 of the 962 patients without PCa at the time of investigation. These negative %fPSA results were reset to 0.0%fPSA. The quality control program included daily internal controls in two concentration levels. We report our findings according to Strengthening The Reporting of Observational studies in Epidemiology (STROBE) [Citation21].
Statistics
Statistical analysis was performed with the Excel software package, 95% confidence intervals were calculated by using the Wilson Score method. Statistical significance was determined as p < .05 in cases where 95% confidence intervals were non-overlapping. Comparison between age and PSA concentration levels were performed by Mann-Whitney U test, based on ranking of results with a 95% significance level. The Kaplan-Meier method was used to estimate the overall and PCa specific 10-year survival. Cox regression analysis was used to determine whether PCa or tPSA were associated with the risk of death after year 10. Hazard ratios and the corresponding 95% confidence intervals (95% CIs) were determined using the covariates age (per decade), tPSA concentration intervals (categories ≤4 μg/L, > 4 – ≤10 μg/L, > 4 – ≤20 μg/L, and >20 μg/L), cancer status (PCa or non-Pca), and Gleason Score (categories <6, 6, 7 and >8). The Reciever Operating Curve (ROC) analysis of the area under the curve (AUC) and statistical survival analyses (Log Rank (Mantel-Cox)) were performed using SPSS statistics, version 19.0. A p-value <.05 indicated statistical significance.
Financial disclosure and ethical considerations
The authors have no commercial interests with any of the companies or products mentioned in this article. The Local Ethical Committee decided that the investigation was a retrospective study of public registers and thus ethical approval of the study was not needed (Protocol no.: H-4-2012-FSP).
Results
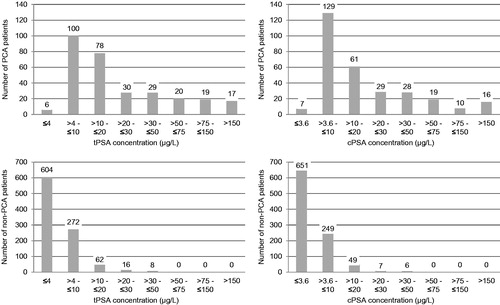
During the study period of 15 months, a total of 1988 individual patients were referred to the Department of Urology, Frederikssund Hospital, and 1422 had the special PSA package performed; 1261 of the patients were eligible for the study. The flow of patients through the study and their diagnoses are provided in . The median age of the 299 PCa patients was 70.8 (range 50.1–95.3 years), and the median age of the 962 non-PCa patients was 67.5 (range 19.1–95.4 years) (p < .0001). All 299 (100%) PCa patients were biopsied, whereas 209 (22%) of the 962 non-PCa patients were biopsied. The median tPSA, cPSA and %fPSA concentrations among the 299 PCa patients vs. the 962 patients without PCa were 13.4 μg/L (range 0.1–5920.5 μg/L) vs. 2.5 μg/L (range 0.1–118.1 μg/L) (tPSA) (p < .0001), 10.8 μg/L (range 0.1–4908.7 μg/L) vs. 1.9 μg/L (range 0.1–83.8 μg/L) (cPSA) (p < .0001), and 12.6% (range 0.0–79.3%) vs. 24.9% (range 0.0–78.8%) (%fPSA) (p < .0001). The distribution of PCa patients as well as non-PCa patients within specified concentration intervals for tPSA and cPSA, respectively, is provided in . 115 (38.5%) of the 299 PCa patients presented with tPSA concentrations >20.0 μg/L and 102 (34.1%) of the 299 PCa patients presented with cPSA concentrations >20.0 μg/L. 24 (2.5%) of the 962 patients without PCa, presented with tPSA concentrations >20.0 μg/L and 13 (1.4%) of the patients without PCa presented with cPSA concentrations >20.0 μg/L ().
Figure 1. Patient characteristics. During June 2005 to August 2006, 1988 patients with a variety of urological symptoms were referred from primary care in the Capital Region of Copenhagen, Area North, to The Department of Urology Frederikssund Hospital, Capital Region of Copenhagen, Area North. tPSA, total Prostate Specific Antigen; cPSA, complexed Prostate Specific Antigen; %fPSA, percentage free Prostate Specific Antigen relative to tPSA. All male patients were tested for tPSA, cPSA and %fPSA concentrations in serum. Patients with previously diagnosed PCa were excluded from the dataset. 1)PCa diagnoses (N = 299) were histologically confirmed by a 6–12 core biopsy or prostate resectate. 2)Non-PCa diagnoses (N = 209) were histologically confirmed by a 6–12 core biopsy or prostate resectate. 3)Eight patients with too sparse biopsy material for Gleason staging and five patients not registred for Gleason score. 4)Ninety patients were diagnosed with another malignancy than PCa: C. Testis/Vesica Seminalis (7), C. Coli/Recti (31), and C. Urethrae/Vesica Urinaria (52). 5)Other; Obs. pro c. prostatae (25), non-malignant disease of the testes and vesica seminalis (44), prostate abscess (2), urolithiasis (4), urosepsis (2), hydronephrosis (2), proteinuria (1), gynacomastia (2), pain (7), abnormal urinary cytology (8), and nothing abnormal (7).
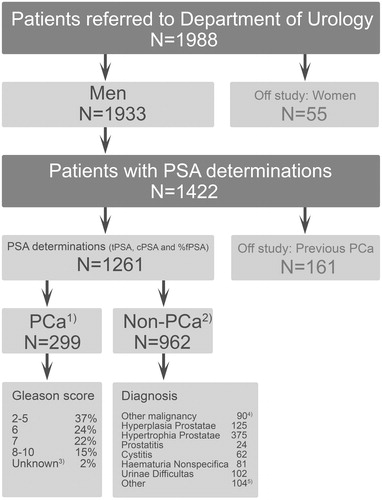
Figure 2. Number of patients with and without PCa within different tPSA and cPSA concentration intervals. Some 299 patients were diagnosed with Prostate Cancer (PCa), and 962 patients were diagnosed as non-PCa. tPSA denotes total Prostate Specific Antigen. cPSA denotes complexed Prostate Specific Antigen. The recommended cut-off for tPSA was 4.0 μg/L, and the recommended cut-off cPSA was 3.6 μg/L.
The diagnostic performance tPSA, cPSA, and %fPSA
The median tPSA concentrations in different age intervals are shown in . The overall diagnostic performance of tPSA, cPSA and %fPSA as well as the 95% CI among the 1261 eligible patients is provided in . ROC analysis of tPSA and cPSA gave an AUC of 0.907 and 0.917, respectively, with optimal cut-offs of 6.4 μg/L for tPSA and 5.7 μg/L for cPSA. The optimal cut-off was calculated as the concentration with best efficiency, i.e. the best discrimination between true and false results of both PCa and non-PCa (ROC curves in Supplementary Figure S1, available online). As compared to tPSA, the cPSA measurements reduced the number of patients falsely classified as having PCa from 358 FP patients to 311 FP patients (13%) (). However, overall, cPSA did not show a better diagnostic performance as compared to tPSA, because of overlapping 95% CI for sensitivity, specificity, positive predictive value (PVpos), negative predictive value (PVneg), and efficiency (p > .05) (). The sensitivity was high (≥ 97.7%) for both tPSA and cPSA. However, the specificity was low (≤ 67.7%) as was the PVpos (≤ 48.4%). Also the PVneg was high both for tPSA and cPSA, 99.0 and 98.9%, respectively. The efficiency of both markers, e.g. their ability to correctly classify patients with and without PCa was moderate (71.1% for tPSA and 74.8% for cPSA). A more detailed investigation of the diagnostic performance of tPSA and cPSA was performed within different concentration intervals of tPSA (Supplementary Table S1, available online). Based on the distribution of TP, FN, FP, and TN results for tPSA and cPSA within the tPSA concentration intervals of ≤4 μg/L, >4 – ≤10 μg/L, >4 μg/L – ≤20 μg/L, and >20 μg/L, the diagnostic performance of tPSA and cPSA appeared similar.
Table 1. Median tPSA values obtained for different age intervals including all 1261 eligible patients.
Table 2. Overall diagnostic performance of tPSA, cPSA and %fPSA among 1261 consecutive patients referred to the Department of Urology from Primary Care.
Changing the cut-off value of %fPSA had an opposite effect on the diagnostic performance as compared to conventional biomarkers of tumor burden (e.g. tPSA and cPSA) (). Thus, by lowering the %fPSA cut-off, the FP results decreased and the TN results increased. However, at a PVneg of 82.5% the PV pos was only 55% (). Accordingly, it was relevant to investigate whether the performance of %fPSA improved when different tPSA concentration intervals were considered.
The diagnostic performance of %fPSA at the tPSA concentration intervals ≤4 μg/L, > 4 – ≤10 μg/L, >4 – ≤20 μg/L, and >20 μg/L
%fPSA at tPSA concentrations ≤4 μg/L
Depending on the applied cut-off (30–10%), %fPSA reclassified 54.4–6.1% of the 610 tPSA patients (6 FN and 604 TN) (Supplementary Table S1 and ).
Table 3. Diagnostic performance of %fPSA within different tPSA concentration intervals among 1261 consecutive patients referred to the Department of Urology from Primary Care.
%fPSA in the tPSA concentration interval of >4 – ≤10 μg/L
Depending on the applied cut-off (30–10%), %fPSA reclassified 15.3–78.5% of the 372 tPSA patients (100 TP, 272 FP) (Supplementary Table S1 and ).
%fPSA in the tPSA concentration interval of >4 – ≤20 μg/L
Depending on the applied cut-off (30–10%), %fPSA reclassified 13.1–77% of the 512 tPSA patients (178 TP, 334 FP) (Supplementary Table S1 and ). The diagnostic performance of %fPSA in terms of Sensitivity, Specificity, PVpos, PVneg, and Efficiency in the tPSA concentration interval >4 – ≤20 μg/L was similar to the diagnostic performance of %fPSA in the tPSA concentration interval of >4 – ≤10 μg/L ().
%fPSA at tPSA concentrations >20 μg/L
Depending on the applied cut-off (30–10%), %fPSA reclassified 15.1–64% of the 139 tPSA patients (115 TP, 24 FP) (Supplementary Table S1 and ).
Ten-year survival
Of the 1261 patients included in the cohort, 412 died during follow-up. The median follow-up time of the remaining 849 patients was 110 months with a range from 102–118 months.
Multivariate analysis of survival
Age was a significant prognosticator for overall and PCa-specific 10-year survival among the 1261 eligible patients with PSA measurements (). However, age was not a prognosticator for 10-year PCa-specific survival among the PCa patients (n = 299). tPSA was a significant prognosticator for 10-year overall survival among PCa patients. tPSA was also a prognosticator for PCa-specific survival among all patients as well as among PCa patients. Gleason score was a prognosticator for 10-year survival among PCa patients. tPSA and Gleason score were stronger prognosticators for PCa-specific survival than age among PCa patients.
Table 4. Multivariate Cox Regression Analysis for overall survival and PCa specific survival. Hazard ratios (range).
Survival in different tPSA concentration intervals
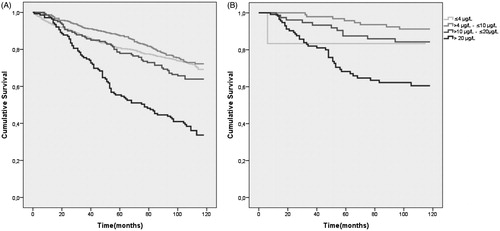
The overall 10-year survival was highest in the tPSA concentration intervals 0 – ≤4 μg/L (72%) and >4 – ≤10 μg/L (73%). The survival in tPSA concentration interval >10 – ≤20 μg/L was 64%. Survival among patients with tPSA >20 μg/L was lower (37%) than for all other tPSA concentration intervals (). PCa-specific 10-year survival was significantly reduced at tPSA concentrations >20 μg/L (64%) ().
Figure 3. Kaplan-Meier plot of 10-year overall survival (A) and 10-year PCa-specific survival in different tPSA concentration intervals (B). All patients both prostate cancer and non-prostate cancer patients are included in each tPSA concentration interval. PCa denotes patients with prostate cancer. tPSA denotes total Prostate Specific Antigen.
Discussion
Limitations
The study was based on routine diagnostics with every PCa verified by biopsy but not every non-PCa verified by biopsy. Also, routine Gleason classification includes assessment of the biopsy core by one pathologist with no standard reassessment or second opinion. The definition of PCa in this study includes all patients with PCa diagnosed at time of PSA test as well as patients with PCa diagnosis within 1 year after PSA testing.
A consecutive patient cohort referred from primary care to a urological special department analyzed for tPSA and cPSA
The patient cohort can be viewed as undergoing opportunistic screening as all were referred from primary care with urological symptoms. Thus, the tPSA and cPSA values can be expected to be higher than in an age-matched randomly screened population. Moreover, the population in general is unscreened so some incidences of unrecognized PCa could be expected. Median tPSA of non-PCa patients was 2.5 μg/L and with a patient median age of 68.3 years these values are comparable to other European patient cohorts [Citation22]. Median tPSA concentrations across both PCa and non-PCa patients (n = 1261) was 4.2 μg/L supporting the observation of very high tPSA concentrations in our PCa cohort. Thus, our results from the mixed cohort are similar (i) to reports from pure PCa patient cohorts [Citation23], and (ii) to the highest quintile of tPSA concentrations obtained among unscreened population with a median age of 58 years [Citation24]. The patient cohort has elevated tPSA and cPSA concentrations and this should be reflected in the applied cut-off. ROC analysis revealed an optimal cut-off for tPSA and cPSA of 6.4 μg/L and 5.7 μg/L, respectively. However, this is a retrospective study and thus the cut-off value in use at the time of diagnosis (tPSA 4.0 μg/L and cPSA 3.6 μg/L) has been applied. It was interesting that the median for newly diagnosed PCa patients was 13.4 μg/L with more than 38% of the patients with tPSA concentrations above 20 μg/L, which typically would be classified as high risk PCa. These patients could have been diagnosed at a lower disease stage with an earlier PSA test and possibly have had a better outcome [Citation25]. The distribution of PCa and non-PCa patients in the present cohort with tPSA concentrations >20 μg/L is 38.5% vs. 2.5% and this is in line with a previous report on a Danish population where the number of PCa patients with tPSA in the higher quintile of tPSA (above 5.1 μg/L) was 36% vs. 3% in a matched control group [Citation24]. The proportion of patients with tPSA concentrations >20 μg/L is also comparable to a nationwide report on Swedish PCa where the proportion of PCa with tPSA concentrations >20 μg/L moved from 62.0% in 1998 to 34.7% in 2011 [Citation26]. A similar development towards earlier PCa diagnosis and reduced tPSA concentrations is expected to occur in Denmark.
The diagnostic performance of tPSA and cPSA is similar both overall and within different concentration intervals of tPSA
No difference was observed between the diagnostic performances of tPSA and cPSA. The specificity of cPSA has been reported to be higher as compared to tPSA [Citation27]. However, this was not confirmed in the current study although a trend is seen towards higher specificity of cPSA in the tPSA concentration range 4–10 μg/L, and non-significance might be due to an underpowered study with regards to specificity in the tPSA concentration interval 4–10 μg/L. Also, in support of better diagnostic performance by cPSA, the AUC in the ROC analysis for cPSA was a little higher than for tPSA. However, with 372 patients and no significant difference in specificity between cPSA and tPSA such a difference would have little clinical utility.
The diagnostic performance of %fPSA at different concentration intervals of tPSA
As regards the diagnostic ability of %fPSA at tPSA concentrations <4 μg/L, four FN tPSA patients (Supplementary Table S1) were reclassified to TP patients () but at the same time %fPSA also reclassified 328 of the 604 TN tPSA patients (Supplementary Table S1) to 328 FP %fPSA patients () rendering the PVpos of %fPSA clinically useless (≤2.7%). %fPSA irrespective of the applied cut-off did not provide additional information in terms of PVneg as compared to tPSA (Supplementary Table S1 and ).
In the tPSA concentration intervals >4 μg – ≤10 μg/L and >4 μg – ≤20 μg/L, %fPSA reclassified several FP tPSA patients to TN %fPSA events, the number depending on the applied cut-off for %fPSA (Supplementary Table S1 and ). However, %fPSA was not able to eliminate FP patients because the PVpos remained ≤56.6% (). tPSA did not provide information on PVneg (Supplementary Table S1). However, owing to PVneg values of 98.2–72.4%, %fPSA may be usefull in differential diagnosis to exclude PCa ().
At tPSA >20 μg/L most of the FP patients and some of the TP patients (Supplementary Table S1) were reclassified by %fPSA to TN and FN patients, respectively (). The FP patients were reduced relatively more than the TP patients providing a PVpos of %fPSA of up to 90% depending on the applied %fPSA cut-off value suggesting that %fPSA may be useful in differential diagnosis to identify PCa.
Both tPSA and cPSA were frequently highly elevated at time of PCa diagnosis
At the time of PCa diagnosis 38.5% of patients had tPSA concentrations above 20 μg/L. For cPSA 33.3% of the patients had tPSA concentrations above 20 μg/L. This is alarming and suggests more PSA testing in the Danish population.
Patients with elevated tPSA had a poor ten-year survival (multivariate)
The very high PSA concentrations found in the present cohort would be less alarming if patient outcome was good. However, this is not the case as is seen in the 10-year survival multivariate regression analysis where survival is dependent on tPSA concentration in the PCa patients (). The survival of patients in different tPSA concentration intervals are shown in a Kaplan-Meier plot (). The survival follows the expected pattern with lower survival at higher tPSA concentrations. One exception to this pattern is a lower PCa specific survival of patients with tPSA concentration <4 μg/L; however, since there are only six patients with PCa in this group, a single event may have strongly affected the result. Patients with tPSA >20 μg/L have a 10-year survival chance of 37% and a cancer-specific survival of 64%. The patients in the tPSA concentration interval >20 μg/L are older and age is the greatest independent prognostic factor for overall survival in the studied cohort but such a poor survival in a large group of patients should raise a concern. Also, the PCa specific survival in the group of patients with tPSA >20 ug/L is markedly reduced compared to patients with lower tPSA concentrations. Why are patients diagnosed with such high tPSA concentrations that survival is severely affected? Could more testing of PSA at a younger age give rise to earlier referral to a specialized urological department, earlier diagnosis and perhaps better survival?
In conclusion, tPSA and cPSA showed similar diagnostic performances. %fPSA provided additional diagnostic information at tPSA concentrations >4 μg – ≤20 μg/L. The high percentage of patients with tPSA concentrations >20 μg/L (high risk patients) indicates late contact from patient to GP or late referral from GP to a Department of urology resulting in impaired patient survival.
Acknowledgements
We thank Helle Alsbæk for help with figures and tables.
Disclosure statement
The authors report no conflicts of interest. The authors alone are responsible for the content and writing of this article.
References
- Oesterling JE, Rice DC, Glenski WJ, Bergstralh EJ. Effect of cystoscopy, prostate biopsy, and transurethral resection of prostate on serum prostate-specific antigen concentration. Urology 1993;42:276–82.
- Bostwick DG, Cooner WH, Denis L, Jones GW, Scardino PT, Murphy GP. The association of benign prostatic hyperplasia and cancer of the prostate. Cancer 1992;70:291–301.
- Yuan JJ, Coplen DE, Petros JA, Figenshau RS, Ratliff TL, Smith DS, Catalona WJ. Effects of rectal examination, prostatic massage, ultrasonography and needle biopsy on serum prostate specific antigen levels. J Urol 1992;147:810–4.
- Oesterling JE. Prostate specific antigen: a critical assessment of the most useful tumor marker for adenocarcinoma of the prostate. J Urol 1991;145:907–23.
- Partin AW, Carter HB, Chan DW, Epstein JI, Oesterling JE, Rock RC, Weber JP, Walsh PC. Prostate specific antigen in the staging of localized prostate cancer: influence of tumor differentiation, tumor volume and benign hyperplasia. J Urol 1990;143:747–52.
- Bahnson RR. Elevation of prostate specific antigen from bacillus Calmette-Guerin-induced granulomatous prostatitis. J Urol 1991;146:1368–9.
- Christensson A, Björk T, Nilsson O, Dahlen U, Matikainen MT, Cockett AT, Abrahamsson PA, Lilja H. Serum prostate specific antigen complexed to alpha 1-antichymotrypsin as an indicator of prostate cancer. J Urol 1993;150:100–5.
- Stenman UH, Leinonen J, Alfthan H, Rannikko S, Tuhkanen K, Alfthan O. A complex between prostate-specific antigen and alpha 1-antichymotrypsin is the major form of prostate-specific antigen in serum of patients with prostatic cancer: assay of the complex improves clinical sensitivity for cancer. Cancer Res 1991;51:222–6.
- Stenman UH, Hakama M, Knekt P, Aromaa A, Teppo L, Leinonen J. Serum concentrations of prostate specific antigen and its complex with alpha 1-antichymotrypsin before diagnosis of prostate cancer. Lancet 1994;344:1594–8.
- Luderer AA, Chen YT, Soriano TF, Kramp WJ, Carlson G, Cuny C, Sharp T, Smith W, Petteway J, Brawer MK. Measurement of the proportion of free to total prostate-specific antigen improves diagnostic performance of prostate-specific antigen in the diagnostic gray zone of total prostate-specific antigen. Urology 1995;46:187–94.
- Abrahamsson PA, Lilja H, Oesterling JE. Molecular forms of serum prostate-specific antigen. The clinical value of percent free prostate-specific antigen. Urol Clin North Am 1997;24:353–65.
- Loeb S, Carter HB, Catalona WJ, Moul JW, Schroder FH. Baseline prostate-specific antigen testing at a young age. Eur Urol 2012;61:1–7.
- Bjartell A, Montironi R, Berney DM, Egevad L. Tumour markers in prostate cancer II: diagnostic and prognostic cellular biomarkers. Acta Oncol 2011;50:76–84.
- Ilic D, O’Connor D, Green S, Wilt TJ. Screening for prostate cancer: an updated Cochrane systematic review. BJU Int 2011;107:882–91.
- van Leeuwen PJ, Kölble K, Huland H, Hambrock T, Barentsz J, Schröder FH. Prostate cancer detection and dutasteride: utility and limitations of prostate-specific antigen in men with previous negative biopsies. Eur Urol 2011;59:183–90.
- Hegarty J, Beirne PV, Walsh E, Comber H, Fitzgerald T, Wallace Kazer M. Radical prostatectomy versus watchful waiting for prostate cancer. Cochrane Database Syst Rev 2010;11:CD006590.
- Schröder FH, Denis L, Roobol MJ. Epilogue: different approaches for prostate cancer screening in the EU? Eur J Cancer 2010;46:3120–5.
- Partin AW, Brawer MK, Bartsch G, Horninger W, Taneja SS, Lepor H, Babaian R, Childs SJ, Stamey T, Fritsche HA, Sokoll L, Chan DW, Thiel RP, Cheli CD. Complexed prostate specific antigen improves specificity for prostate cancer detection: results of a prospective multicenter clinical trial. J Urol 2003;170:1787–91.
- Jung K, Elgeti U, Lein M, Brux B, Sinha P, Rudolph B, Hauptmann S, Schnorr D, Loening SA. Ratio of free or complexed prostate-specific antigen (PSA) to total PSA: which ratio improves differentiation between benign prostatic hyperplasia and prostate cancer?. Clin Chem 2000;46:55–62.
- Pedersen CB. The Danish Civil Registration System. Scand J Public Health 2011;39:22–5.
- von Elm E, Altman DG, Egger M, Pocock SJ, Gotzsche PC, Vandenbroucke JP. STROBE Initiative, The Strengthening the Reporting of Observational Studies in Epidemiology (STROBE) statement: guidelines for reporting observational studies. Bull World Health Organ 2007;85:867–72.
- Oesterling JE, Jacobsen SJ, Chute CG, Guess HA, Girman CJ, Panser LA, Lieber MM. Serum prostate-specific antigen in a community-based population of healthy men. Establishment of age-specific reference ranges. JAMA 1993;270:860–4.
- Vickers AJ, Cronin AM, Roobol MJ, Hugosson J, Jones JS, Kattan MW, Klein E, Hamdy F, Neal D, Donovan J, Parekh DJ, Ankerst D, Bartsch G, Klocker H, Horninger W, Benchikh A, Salama G, Villers A, Freedland SJ, Moreira DM, Schröder FH, Lilja H. The relationship between prostate-specific antigen and prostate cancer risk: the Prostate Biopsy Collaborative Group. Clin Cancer Res 2010;16:4374–81.
- Larsen SB, Brasso K, Iversen P, Christensen PJ, Christiansen M, Carlsson S, Lilja H, Friis S, Tjonneland A, Dalton SO. Baseline prostate-specific antigen measurements and subsequent prostate cancer risk in the Danish Diet, Cancer and Health cohort. Eur J Cancer 2013;49:3041–8.
- Bartsch G, Horninger W, Klocker H, Pelzer A, Bektic J, Oberaigner W, Schennach H, Schafer G, Frauscher F, Boniol M, Severi G, Robertson C, Boyle P. Tyrol Prostate Cancer Screening Group, Tyrol prostate cancer demonstration project: early detection, treatment, outcome, incidence and mortality. BJU Int 2008;101:809–16.
- Ohmann EL, Loeb S, Robinson D, Bill-Axelson A, Berglund A, Stattin P. Nationwide, population-based study of prostate cancer stage migration between and within clinical risk categories. Scand J Urol 2014;48:426–35.
- Strittmatter F, Stieber P, Nagel D, Fullhase C, Walther S, Stief CG, Waidelich R. Detection of prostate cancer with complexed PSA and complexed/total PSA ratio: is there any advantage? Eur J Med Res 2011;16:445–50.