
Abstract
Determining blood concentrations of the amino acids homocysteine, tryptophan, tyrosine and phenylalanine in children is of value in the clinical practice. Over the past decades, the use of blood spot samples to examine amino acid concentrations is increasing rapidly. In children, the use of blood spot samples is especially of relevance, as this method is much less invasive than venous blood sampling. Currently, no paediatric reference values for amino acids in blood spots are available. The aim of the current study was to establish reference values for blood spot concentrations of total homocysteine, tryptophan, tyrosine and phenylalanine in school-age children. Dried blood spots were obtained in a community sample of 104 healthy children, aged 6–12 years old (52% males). Blood spot concentrations of total homocysteine, tryptophan, tyrosine and phenylalanine were determined by positive electrospray liquid chromatography-tandem mass spectrometry. Parents of participants completed questions regarding demographic characteristics. Our sample consisted of healthy children from various ethnic backgrounds, with varying levels of socioeconomic status, in line with the composition of the Dutch society. Blood spot concentrations of total homocysteine, tryptophan, tyrosine and phenylalanine were similar in males and females, and independent of age. In conclusion, paediatric reference values for blood spot concentrations of total homocysteine, tryptophan, tyrosine and phenylalanine were established, which could be of use in the clinical practice.
Introduction
Analysis of amino acid concentrations in blood of children is often used in clinical practice; for various diagnostic purposes and to make decisions regarding treatment [Citation1]. Adequate reference values are required in clinical decision-making. Abnormal amino acid concentrations may reflect an imbalanced diet or infections [Citation2]. For instance, high levels of homocysteine may reflect a vitamin B12 or folate deficiency [Citation3]. Further, aberrant concentrations of amino acids can be indicative of metabolic disorders in children, such as decreased concentrations of tryptophan in plasma being indicative of Hartnup disease [Citation4], and increased concentrations of phenylalanine and decreased concentrations of tyrosine in plasma being biomarkers for the various forms of hyperphenylalaninemia [Citation1]. One way to examine amino acid concentrations, is by analyzing blood samples, obtained by venipuncture [Citation5]. However, in children this method is suboptimal, given that this invasive procedure can invoke pain, anxiety and distress. Over the past decades, the use of blood spot samples to examine amino acid concentrations is increasing [Citation6,Citation7]. Collecting blood spots, by means of a finger prick, is less invasive for children than venous blood sampling, and the dried blood spot technique is sufficiently robust and stable for diagnostic purposes [Citation8–10]. In addition, blood spots can be assessed at home, as they can be stored at room temperature and be sent by regular mail. Blood spot amino acid concentrations correlate well with amino acids concentrations obtained in venous blood (rs ranging from 0.86–0.96) [Citation11,Citation12]. However, there is some bias in blood spot concentrations and its causes are not completely clear. Factors like extraction efficiency, dilution, differences in amino acid concentrations between the plasma and red blood cells will likely contribute. It is therefore important to create reference values specifically for blood spot concentrations. There are some reference values published on blood spot amino acid concentrations in infants, required in newborn screening [Citation6,Citation8]. However, to our current knowledge, there are no normative values for blood spot concentrations of amino acids in school-age children available.
A challenge in providing reference values for amino acids in school-age children is to establish normative data obtained from a representative sample of healthy children. Papers describing reference values often lack information regarding recruitment methods and demographic characteristics of the samples, such as ethnicity and socioeconomic status (SES). Due to the ethical challenge of acquiring samples from healthy children from the community, many paediatric reference values are obtained from hospitalized children [Citation5,Citation13]. Another challenge in establishing reference values is to take into account the potential effects of age [Citation5,Citation14–16] and gender [Citation17] on individual differences in amino acid metabolism.
The current study was aimed at establishing reference values for blood spot amino acid concentrations in healthy school-age children. In addition, we examined whether gender and age affected amino acid concentrations.
Materials and methods
Participants
Subjects were a community sample of healthy school-age children (N = 104; 52% males). The mean age of the sample was 9 years and 9 months (range: 6–12 years). Parents of participants were asked to complete questions regarding age, gender, ethnicity and medical condition of the child, as well as questions regarding family status, education and occupation of the parents. Exclusion criteria were (a) a history of chronic metabolic, renal, hepatic and cardiac diseases, (b) prescribed medication use that could interfere with amino acid metabolism, and (c) acute illness, as reported by parents. Children were recruited from primary schools located throughout the Netherlands. Recruitment throughout the country resulted in a heterogeneous sample, consisting of children living in different geographic environments (rural and urban areas). The level of SES was determined based on the highest level of education and the current occupation of parents on 6-point scales [Citation18,Citation19]. SES was calculated as the average of the education and occupation scores of both parents in the case of two carers and as the average of the education and occupation scores of one parent in the case of a single carer [Citation20]. Part of this sample (n = 72) were used in another study by our research group [Citation21]. For that study only typically developing children were selected. The children described in the current study with a clinical diagnosis of any developmental or behavioural disorder were excluded from the other study.
Amino acid concentrations
To investigate blood concentrations of total homocysteine, tryptophan, tyrosine and phenylalanine, a dried blood spot technique was used. A blood spot of each child was collected using a disposable safety lancet. Blood sampling was performed by trained researchers. Three blood drops were spotted onto a blood stain card and analyzed by the clinical chemistry laboratory of our academic medical center within 1 month after blood sampling. Disks with a diameter of 5.5 mm were punched out of the blood spots, each containing about 8.1 μL blood. Concentrations of total homocysteine in blood spots (in μmol/L) were determined using liquid chromatography-mass spectrometry (LC-MS/MS), based on the protocol of Gempel, Gerbitz [Citation22]. Reliability of the LC-MS/MS was confirmed by examining the inter-assay variance (being 11%), intra-assay variance (being 10%) and recovery (being 105.5%). While blood spot concentrations of tryptophan, tyrosine and phenylalanine were expressed in whole units, blood spot concentrations of total homocysteine were expressed in one decimal, since the LC-MS technique allowed for a more precise measure. See reference [Citation21] for a more detailed description of the analysis of tryptophan, tyrosine and phenylalanine concentrations in blood spots (in μmol/L).
Procedure
This study was part of a research project on the relation between amino acids (total homocysteine, tryptophan, tyrosine and phenylalanine) and ADHD, and received approval from the local medical ethical committee (#NL39922.029.12). The study was performed in accordance with the ethical standards as laid down in the 1964 Declaration of Helsinki and its later amendments. Written informed consent was obtained of parents of all children, and of 12-year-old children, prior to participation. Blood spots were collected in the early morning of the test day, to rule out possible effects of diurnal variation of amino acid blood spot concentrations. Blood spots were collected <2 h after breakfast.
Data analysis
All statistical analyses were performed using R, version 3.2.1. Outliers were replaced using winsorizing [Citation23]. For nine children, blood spot total homocysteine concentrations were missing due to insufficient blood spots collected in some participants. These data were not replaced. In none of the other variables there were missing values.
Firstly, it was investigated whether there were interactions between gender and age on amino acid concentrations, using multiple linear regression analyses. In the case of non-significant interactions, the main effects of gender and age on amino acid concentrations were examined, using analysis of variance or by calculating Pearson product-moment correlation coefficients, respectively. When appropriate, reference values were partitioned.
Secondly, reference values were established for the total group, using percentile scores (5th, 50th and 95th). The 5–95 percentile interval represents the central 90% of the sample distribution, which is common in a community sample [Citation24]. Further, the 10th and 90th percentiles were presented, which are more stable measures in a sample of circa 100 participants [Citation5]. In case of significant effects of gender or age, stratified reference values were defined.
Results
Inspection of our sample revealed that the children represented diverse cultural backgrounds; of our sample 81 children (78%) had a Dutch background, eight children (8%) had a non-Dutch Western background and 15 children (14%) had a non-Western background. The children in our sample had varying levels of SES; of our sample 38 children (37%) were classified as having low SES, 41 children (39%) as medium SES and 25 children (24%) as high SES.
Inspection of histograms (see ) showed that all four amino acid concentrations were normally distributed. Regression analyses showed no interaction effect between gender and age for any of the amino acid concentrations (all β-values <0.10, all p-values >0.55). Also, we did not find main effects of gender (all F-values <1.00 all p-values >0.30) and age (all r-values <0.20 all p-values >0.05) on blood spot amino acid concentrations. Therefore, reference values for blood spot concentrations of total homocysteine, tryptophan, tyrosine and phenylalanine were presented for the whole group of school-age children, see .
Figure 1. Histograms of blood spot amino acid concentrations in a sample of 104 healthy children.
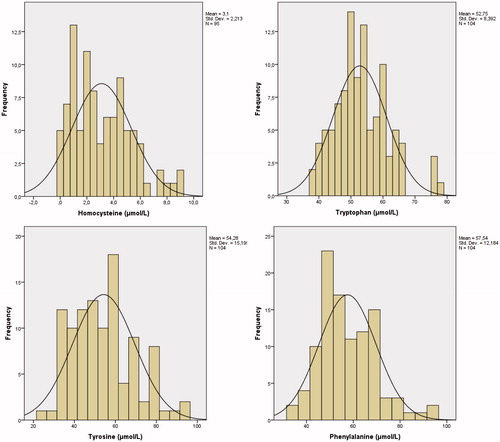
Table 1. Reference values for blood spot amino acid concentrations, based on a sample of 104 healthy children.
Discussion
The main purpose of the current study was to establish paediatric reference values for blood spot concentrations of total homocysteine, tryptophan, tyrosine and phenylalanine. A key finding of our study is that we did not find an effect of age on amino acid blood spot concentrations, which was contrary to our expectations based on previous studies [Citation5,Citation16]. The absence of age differences might be explained by the age range studied in the present study, which was limited to 6–12-year-olds. Age differences might emerge during more critical developmental stages, such as infancy and puberty [Citation5,Citation16]. We furthermore did not find any gender effects on blood spot amino acid concentrations, and therefore our results do not support the hypothesis of differences in amino acid concentrations between males and females in this age range. As gender effects may reflect variations in amino acid concentrations during different stages of the menstrual cycle in females, our study does not rule out the need for gender-partitioned reference values in samples including children in puberty.
In the current study, we obtained reference values for amino acid concentrations in blood spots that differ from reference values in blood samples, obtained by venipuncture [Citation5,Citation24]. There does not seem to be a clear trend line formula, linking concentrations in blood spots to those obtained in plasma. While some of our reference values in blood spots are lower than those obtained in plasma [Citation5,Citation24], other reference values in blood spots are higher than the reference values of plasma levels [Citation5,Citation24]. This underlines the necessity of using normative data of blood spots, instead of calculating reference values based on normative data of plasma levels.
There are some limitations to the current study that should be noted. While our study provides reference values for school-age children (a group of children that is often seen in clinical practice), in future studies the age range of our study (6–12 years) should be expanded, to provide reference values for children under 6 years old and for adolescents. An age range of 0–18 years old would allow for examining gender and age effects on amino acids concentrations more thoroughly.
The current study also has several strengths. Normative data were obtained in a community sample of healthy children, who were recruited through schools located in diverse geographical areas. This recruitment method decreased the possibility of a biased sample, that might be present in studies selecting hospitalized children [Citation5,Citation13]. Further, our sample consisted of children from various ethnic backgrounds, with proportions of immigrants in line with the composition of the Dutch society, as there are 10% Western and 12% non-Western immigrants in the Netherlands [Citation25]. An ethnically representative sample can be of importance when establishing reference values, as it has been suggested that there are differences in amino acid metabolism between ethnic groups, due to genetic or nutritional factors [Citation16]. It would be interesting to examine whether amino acid concentrations vary between ethnic groups of children, but our study was insufficiently powered to compare the amino acid concentrations between different ethnic groups of children. The obtained reference values allow clinicians to use blood spots more often, as alternative to venipuncture for the analysis of amino acid concentrations in school-age children.
Acknowledgements
The authors would like to thank Ulbe Holwerda and Rob Kok (VU University Medical Center Amsterdam) for analyzing the blood spots. We are also grateful to all children and parents who participated in our study, as well as to our research assistants for their help in the data collection.
Disclosure statement
The authors report no conflicts of interest. The authors alone are responsible for the content and writing of the paper.
Additional information
Funding
References
- Lepage N, Li D, Kavsak PA, Bamforth F, Callahan J, Dooley K, Potter M. Incomplete pediatric reference intervals for the management of patients with inborn errors of metabolism. Clin Biochem 2006;39:595–9.
- Suliman ME, Qureshi AR, Stenvinkel P, Pecoits-Filho R, Bárány P, Heimbürger O, Anderstam B, Ayala ER, Divino Filho JC, Alvestrand A. Inflammation contributes to low plasma amino acid concentrations in patients with chronic kidney disease. Amer J Clin Nutr 2005;82:342–9.
- Mattson MP, Shea TB. Folate and homocysteine metabolism in neural plasticity and neurodegenerative disorders. Trends Neurosci 2003;26:137–46.
- Keszthelyi D, Troost F, Masclee A. Understanding the role of tryptophan and serotonin metabolism in gastrointestinal function. J Neurogastroenterol Motil 2009;21:1239–49.
- Lepage N, McDonald N, Dallaire L, Lambert M. Age-specific distribution of plasma amino acid concentrations in a healthy pediatric population. Clin Chem 1997;43:2397–402.
- Zytkovicz TH, Fitzgerald EF, Marsden D, Larson CA, Shih VE, Johnson DM, Strauss AW, Comeau AM, Eaton RB, Grady GF. Tandem mass spectrometric analysis for amino, organic, and fatty acid disorders in newborn dried blood spots: a two-year summary from the New England newborn screening program. Clin Chem 2001;47:1945–55.
- Fingerhut R, Olgemöller B. Newborn screening for inborn errors of metabolism and endocrinopathies: an update. Anal Bioanal Chem 2009;393:1481–97.
- Rashed MS, Bucknall MP, Little D, Awad A, Jacob M, Alamoudi M, Alwattar M, Ozand PT. Screening blood spots for inborn errors of metabolism by electrospray tandem mass spectrometry with a microplate batch process and a computer algorithm for automated flagging of abnormal profiles. Clin Chem 1997;43:1129–41.
- Chace DH, Sherwin JE, Hillman SL, Lorey F, Cunningham GC. Use of phenylalanine-to-tyrosine ratio determined by tandem mass spectrometry to improve newborn screening for phenylketonuria of early discharge specimens collected in the first 24 hours. Clin Chem 1998;44:2405–9.
- Kand’ár R, Žáková P. Determination of phenylalanine and tyrosine in plasma and dried blood samples using HPLC with fluorescence detection. J Chromatogr B 2009;877:3926–9.
- Pecce R, Scolamiero E, Ingenito L, Parenti G, Ruoppolo M. Optimization of an HPLC method for phenylalanine and tyrosine quantization in dried blood spot. Clin Biochem 2013;46:1892–5.
- Bowron A, Barton A, Scott J, Stansbie D. Blood spot homocysteine: a feasibility and stability study. Clin Chem 2005;51:257–8.
- Parvy P, Bardet J, Rabier D, Kamoun P. Age-related reference values for free amino acids in first morning urine specimens. Clin Chem 1988;34:2092–5.
- Held PK, White L, Pasquali M. Quantitative urine amino acid analysis using liquid chromatography tandem mass spectrometry and aTRAQ® reagents. J Chromatogr B 2011;879:2695–703.
- Venta R, Prieto B, Alvarez FV. Regression-based reference limits for urinary amino acids in a pediatric population. Clin Chem Lab Med 2002;40:383–90.
- van Beynum IM, den Heijer M, Thomas CM, Afman L, Oppenraay-van Emmerzaal D, Blom HJ. Total homocysteine and its predictors in Dutch children. Am J Clin Nutr 2005;81:1110–6.
- Jung B, Adeli K. Clinical laboratory reference intervals in pediatrics: the CALIPER initiative. Clin Biochem 2009;42:1589–95.
- Statistics Netherlands. Standard Occupational Classification. The Haag/Heerlen, the Netherlands: Statistics Netherlands; 2010.
- Statistics Netherlands. Standard Educational Classification. The Haag/Heerlen, the Netherlands: Statistics Netherlands; 2006.
- Cirino PT, Chin CE, Sevcik RA, Wolf M, Lovett M, Morris RD. Measuring socioeconomic status reliability and preliminary validity for different approaches. Assessment. 2002;9:145–55.
- Bergwerff CE, Luman M, Blom HJ, Oosterlaan J. No tryptophan, tyrosine and phenylalanine abnormalities in children with attention-deficit/hyperactivity disorder. PLoS One 2016;11:e0151100.
- Gempel K, Gerbitz K-D, Casetta B, Bauer MF. Rapid determination of total homocysteine in blood spots by liquid chromatography-electrospray ionization-tandem mass spectrometry. Clin Chem 2000;46:122–3.
- Tabachnick BG, Fidell LS, Using multivariate statistics. 4th ed. Boston (MA): Allyn & Bacon; 2001.
- Refsum H, Grindflek AW, Ueland PM, Fredriksen Å, Meyer K, Ulvik A, Guttormsen AB, Iversen OE, Schneede J, Kase BF. Screening for serum total homocysteine in newborn children. Clin Chem 2004;50:1769–84.
- Centraal Bureau voor de Statistiek. Population; sex, age, origin and generation. Den Haag/Heerlen: CBS 2015.