
Abstract
Objectives: Non-HDL-cholesterol (non-HDL-C) has been reported to be a better marker of cardiovascular risk than LDL-cholesterol (LDL-C) especially in individuals with high triglyceride values. Further, levels of remnant cholesterol have been suggested to in part explain residual risk not captured with LDL-C. The aim of the present study was to define reference values for non-HDL-C and remnant cholesterol based on data from the Nordic Reference Interval Project (NORIP).
Methods: We analyzed the test results for total cholesterol, HDL-cholesterol and triglycerides from 1392 healthy females and 1236 healthy males. Non-HDL-C was calculated as measured total cholesterol minus measured HDL-cholesterol. Remnant cholesterol was calculated using the Friedewald equation for LDL-C: measured total cholesterol minus measured HDL-cholesterol and minus calculated LDL-cholesterol. The 2.5th and 97.5th percentiles for these markers were calculated according to the International Federation of Clinical Chemistry guidelines on the statistical treatment of reference values.
Results: Age (18–<30, 30–49 and ≥50 years) and sex-specific reference intervals were calculated for non-HDL-cholesterol and remnant-cholesterol. Levels of non-HDL-C and remnant cholesterol differed between sex and age strata.
Conclusions: Age- and sex-specific reference intervals should be used for the triglyceride rich lipid variables non-HDL-C and remnant cholesterol. Since these markers may add information on risk burden beyond LDL-C, our hope is that these reference intervals will aid the introduction of automatic reporting of non-HDL-C by hospital laboratories.
Introduction
Cardiovascular diseases (CVD) are a worldwide leading cause of death, especially in developed countries [Citation1]. Traditionally patients with CVD are monitored with regard to lipids with total cholesterol (TC), LDL-cholesterol (LDL-C), HDL-cholesterol (HDL-C) and triglycerides with an emphasis on LDL-C values [Citation2]. LDL-C does not include the participation of other lipoprotein fractions such as lipoprotein a (Lp (a)) and the triglyceride rich very low-density lipoprotein (VLDL) cholesterol which have been suggested to be involved in and contribute to the development of atherosclerosis. Further, the prevalence of patients being obese, having the metabolic syndrome and type 2 diabetes mellitus are increasing. These are all conditions known to increase the proportion of triglyceride rich lipoproteins (TRLs). Over the last decade there has, therefore, been an increased interest in and use of non-HDL-C and remnant cholesterol (remnant-C) as both causal for atherosclerosis and risk markers for CVD and all-cause mortality [Citation3,Citation4].
Recent recommendations and treatment guidelines emphasize the role of non-HDL-C in evaluating CVD risk [Citation5–7] for example in patients with diabetes [Citation8]. Non-HDL-C is the calculated difference between total cholesterol and LDL-C. As HDL-C and total cholesterol are measured in most CVD patients, the data for calculating non-HDL-C are thus readily available. Still very few laboratories provide non-HDL cholesterol levels in their test reports, and sometimes provide them with result reports lacking reference intervals, making it less convenient for physicians to use non-HDL-C in patient care and cardiovascular risk assessment. Health care providers are accustomed to use LDL-C, HDL-C, and triglycerides, in part due to the overwhelming number of prior observational studies and clinical trials using these fractions for risk calculation and measuring treatment effects, and in part due to laboratory tradition. So far, there has been limited demand for non-HDL-C besides for some specialized lipid clinics. It seems likely that we will see an increasing demand for the broader non-HDL-C and the more triglyceride specific remnant-C in the near future. There are no major costs associated with the reporting non-HDL-C or remnant-C and the data for calculating these biomarkers are usually readily available. One obstacle for the laboratories to report non-HDL-C and remnant-C is the lack of reference values. Thus, there is a need to develop reference intervals for these lipid particles. The Nordic Reference Interval Project (NORIP) was a major project that was designed to establish common Nordic reference intervals for more than 25 of the most frequently requested laboratory biomarkers based on a large well-characterized population [Citation9].
The aim of the present study was to use the NORIP data to calculate non-HDL-C and remnant-C in females and males to facilitate the reporting of these markers. In addition, we wanted to evaluate potential differences in sex and age strata.
Methods
Setting and participants
A detailed description of reference individuals, blood collection, treatment of samples, and descriptive data has previously been published [Citation9]. The production and characterization of the used controls for triglycerides, total cholesterol and HDL-C to verify the results from participating laboratories have also been published [Citation10]. Data on methods used are also previously published [Citation11].
Clinical and biochemical calculations
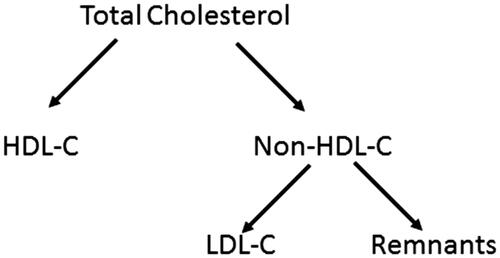
Triglycerides, total cholesterol, and HDL-C were analyzed as parts of the initial NORIP study [Citation11]. LDL-C in mmol/L was calculated according to the Friedewald equation as LDL-C = total cholesterol minus HDL-C minus 0.456 × total triglyceride concentration [Citation12]. Non-HDL-C was calculated as total cholesterol minus LDL-C and remnant-C was calculated as non-HDL-C minus LDL-C (). No truncation for high triglyceride values was used when calculating non-HDL-C or remnant-C.
Figure 1. Relationship among total cholesterol, HDL-cholesterol, non-HDL-cholesterol, LDL-cholesterol, and remnants.
Statistical analysis
Calculations of reference intervals and 90% confidence intervals were performed by bootstrap estimation with the software RefVal 4.0 [Citation13,Citation14]. The determination and evaluation of equality of the reference intervals were performed according to Clinical Laboratory Standards Institute guidelines EP28-A3C. The Lahti et al method described in EP28-A3C was used to test (0.9–4.1%) if there were differences between reference intervals [Citation15].
Results
Description of the study population
The study population consisted of 1392 females and 1236 males. The median age of the females was 46 years (interquartile range (IQR) 30–58 years) and their median non-HDL-C level was 3.44 mmol/L (IQR 2.75–4.31). The median age of the males was 47.5 years (30–60) and their median non-HDL-C value was 3.77 mmol/L (3.07–4.50). The median remnant-C level for females was 0.42 mmol/L (0.32–0.57) and 0.50 mmol/L (0.37–0.69) for males. There was a strong Spearman rank correlation between age and non-HDL for both females (R = 0.587; p < .0001) and males (R = 0.431; p < .0001). Although also significant, the corresponding Spearman rank correlation between age and remnants was clearly lower for both females (R = 0.235; p < .0001) and males (R = 0.102; p = .0004).
Reference intervals by sex and age strata
The upper and lower limits for the reference intervals (2.5th and 97.5th percentiles and 90% confidence intervals) for males and females were calculated for the age groups used in the NORIP study for cholesterol, 18–<30, 30–49, and ≥50 years are shown in . Limits that differ significantly between sex and age strata according to Lahti et al. are marked in the table [Citation15].
Table 1. Reference intervals for non-HDL cholesterol and remnant cholesterol calculated from the NORIP cohort.
Discussion
This study reports the reference values for non-HDL-C and remnant-C from the Nordic Reference Interval Project. We used the same reference interval partition as for total cholesterol in the initial NORIP study [Citation11]. There is a clear increase in non-HDL-C values with age in both males and females. There is also a sex difference for non-HDL-C with higher values for males. It is thus reasonable to use gender specific and age specific reference intervals. As a comparison, we also included reference intervals without age separation for the whole population. The age and sex effects are less pronounced for remnant-C, especially for the lower reference interval limits. Based on calculations according to Lahti [Citation15], there were no differences in reference intervals for different age strata in females and the whole female population. In men, the upper reference limits for remnant-C in the age groups 19–29 and 30–49 years were different.
There is an increased interest in primarily non-HDL-C but also in remnant-C in line with increasing data suggesting that, especially for some subpopulation patients, these variables may add information on risk and residual risk, beyond that of traditionally reported lipoprotein fractions [Citation16]. Several countries already automatically report non-HDL-C together with total cholesterol, HDL-C and triglycerides and several international studies favor the use of non-HDL-C as a complement to the traditional lipid biomarkers. The Swedish Medical Product Agency also recommends the use of non-HDL-C for patients with elevated triglyceride values (https://lakemedelsverket.se/upload/halso-och-sjukvard/behandlingsrekommendationer/Att_forebygga_aterosklerotisk_hjart-karlsjukdom_med%20_lakemedel_behandlingsrekommendation.pdf). Non-HDL-C can easily be calculated from total cholesterol and HDL-C. Most analyses of lipoprotein profile include these variables so the addition of non-HDL-C could easily be achieved without any additional laboratory costs. In more complex patients, the same can be done for remnant-C. The availability of a well characterized reference interval should in our opinion facilitate the reporting of non-HDL-C.
A recent international consensus statement recommended that lipoprotein fractions do not require that the patient is in a fasting state at the time of blood draw [Citation17]. This means that there may be a shift from fasting samples to non-fasting samples with an increase the triglyceride values. We are also seeing a change from Friedewald estimated LDL-C to direct LDL-C measurements in laboratories. Direct LDL-C are reported without any restrictions for the triglyceride values. We have recently showed a good agreement between Friedewald-LDL-C and direct LDL-C also at elevated triglyceride values [Citation18]. Taking this information into account, we have not truncated high triglyceride values in this study when calculating non-HDL-C or remnant-C.
The strengths of our investigation include a large reference population from several countries. The sampling quality was carefully monitored to ensure minimal preanalytical errors. Limitations comprise the inability to replicate the results in an independent cohort and the inability to generalize the results to other ethnic groups. A problem with the reference interval for remnant-C is that we used the Friedewald equation to calculate LDL-C. Currently several of the laboratories are changing from Friedewald-LDL-C to direct LDL-C measurements. Even if the direct-LDL are reported to provide similar results as Friedewald-LDL-C there is a risk that the method used at the individual laboratory may differ from the methods used in NORIP. There are also intralaboratory differences in external quality assurance programs indicating method variations for LDL-C. It is thus important that laboratories that use external reference intervals verify that the reference interval is in agreement with the local method.
In conclusion, we here report gender and age specific reference values for non-HDL-C and remnant-C based on data from the Nordic Reference Interval Project (NORIP). Based on these reference intervals, an introduction of automatic reporting of non-HDL-C may be facilitated.
Ethical considerations
The study was approved by the ethics committees in the participating Nordic countries [Citation19] and all participants gave informed consent prior to inclusion. The study was conducted according to the Declaration of Helsinki.
Acknowledgements
The authors acknowledge the valuable work of all the laboratories and the organizing group responsible for all the measurements in the Nordic Reference Interval Project (NORIP). The authors thank the Nordic Society of Clinical Chemistry (NFKK) for making data from the Nordic Reference Interval Project Database (NOBIDA) available to this project.
Disclosure statement
The authors stated that there are no conflicts of interest regarding the publication of this article. Maria K Svensson is currently employed by Amgen AB Sweden.
Additional information
Funding
References
- Roth GA, Johnson CO, Abate KH, et al. The burden of cardiovascular diseases among US States, 1990–2016. JAMA Cardiol. 2018;3:375–389.
- Ballantyne CM, Hoogeveen RC. Role of lipid and lipoprotein profiles in risk assessment and therapy. Am Heart J. 2003;146:227–233.
- Averna M, Stroes E, Ogura M, et al. How to assess and manage cardiovascular risk associated with lipid alterations beyond LDL. Atheroscler Suppl. 2017;26:16–24.
- Blaha MJ, Blumenthal RS, Brinton EA, et al. The importance of non-HDL cholesterol reporting in lipid management. J Clin Lipidol. 2008;2:267–273.
- Bergmann K. Non-HDL cholesterol and evaluation of cardiovascular disease risk. Ejifcc. 2010;21:64–67.
- Meeusen JW, Donato LJ, Jaffe AS. Lipid biomarkers for risk assessment in acute coronary syndromes. Curr Cardiol Rep. 2017;19:48.
- Langlois MR, Chapman MJ, Cobbaert C, et al. Quantifying atherogenic lipoproteins: current and future challenges in the era of personalized medicine and very low concentrations of LDL cholesterol. A Consensus Statement from EAS and EFLM. Clin Chem. 2018;64:1006–1033.
- Cederholm J, Eliasson B, Zethelius B, et al. Risk factors for cardiovascular disease. Results from the Swedish national diabetes register compared with international studies. Lakartidningen. 2013;110:882–885.
- Felding P, Rustad P, Martensson A, et al. Reference individuals, blood collection, treatment of samples and descriptive data from the questionnaire in the Nordic Reference Interval Project 2000. Scand J Clin Lab Invest. 2004;64:327–342.
- Henriksen GM, Pedersen MM, Norgaard I, et al. Minimally processed fresh frozen human reference sera: preparation, testing, and application to international external quality assurance. Scand J Clin Lab Invest. 2004;64:293–308.
- Rustad P, Felding P, Franzson L, et al. The Nordic Reference Interval Project 2000: recommended reference intervals for 25 common biochemical properties. Scand J Clin Lab Invest. 2004;64:271–284.
- Friedewald WT, Levy RI, Fredrickson DS. Estimation of the concentration of low-density lipoprotein cholesterol in plasma, without use of the preparative ultracentrifuge. Clin Chem. 1972;18:499–502.
- Solberg HE. The IFCC recommendation on estimation of reference intervals. The RefVal program. Clin Chem Lab Med. 2004;42:710–714.
- Solberg HE. RefVal: a program implementing the recommendations of the International Federation of Clinical Chemistry on the statistical treatment of reference values. Comput Methods Programs Biomed. 1995;48:247–256.
- Lahti A, Hyltoft PP, Boyd JC, et al. Objective criteria for partitioning Gaussian-distributed reference values into subgroups. Clin Chem. 2002;48:338–352.
- Jepsen AM, Langsted A, Varbo A, et al. Increased remnant cholesterol explains part of residual risk of all-cause mortality in 5414 patients with ischemic heart disease. Clin Chem. 2016;62:593–604.
- Nordestgaard BG, Langsted A, Mora S, et al. Fasting is not routinely required for determination of a lipid profile: clinical and laboratory implications including flagging at desirable concentration cutpoints – a Joint Consensus Statement from the European Atherosclerosis Society and European Federation of Clinical Chemistry and Laboratory Medicine. Clin Chem. 2016;62:930–946.
- Larsson A, Hagstrom E, Nilsson L, et al. Treatment target re-classification of subjects comparing estimation of low-density lipoprotein cholesterol by the Friedewald equation and direct measurement of LDL-cholesterol. Ups J Med Sci. 2018;1–6.
- Rustad P, Simonsson P, Felding P, et al. Nordic Reference Interval Project Bio-bank and Database (NOBIDA): a source for future estimation and retrospective evaluation of reference intervals. Scand J Clin Lab Invest. 2004;64:431–438.