
 ?Mathematical formulae have been encoded as MathML and are displayed in this HTML version using MathJax in order to improve their display. Uncheck the box to turn MathJax off. This feature requires Javascript. Click on a formula to zoom.
Abstract
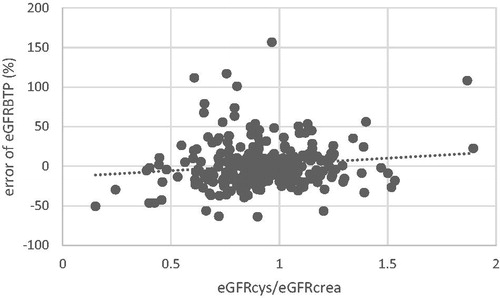
The link between cystatin C and mortality independent of glomerular filtration rate (GFR) in adults has prompted the “Shrunken Pore Syndrome” (SPS) hypothesis, where high serum cystatin C with normal creatinine is explained by smaller glomerular pores, through which creatinine can pass freely, while the larger cystatin C, beta-trace protein (BTP) and pro-inflammatory molecules are retained. This study set out to apply the definition of SPS to children. In 294 children who underwent inulin clearance (Cin) test, serum creatinine, cystatin C and BTP were measured. For all three markers eGFRx was calculated using the full age spectrum equations. The ratio eGFRcys/eGFRcrea was plotted against the error of eGFRBTP(%) (i.e. eGFRBTP-Cin)/Cin*100%). Patients with and without SPS according to different cut-off points of eGFRcys/eGFRcrea and eGFRcys/Cin (i.e. ≤0.6,0.7,0.8) were compared in terms of eGFRx, Cin, error of eGFRx(%) and eGFRBTP/eGFRcrea-ratio. The ratio eGFRcys/eGFRcrea and error of eGFRBTP(%) were positively correlated. The prevalence of SPS by eGFRcys/eGFRcrea with a cut-off of 0.6 was 4.8%. Patients with SPS had a more negative error of eGFRcys(%) and eGFRBTP(%) and higher Cin regardless of the definition. Overestimation of eGFRcrea in patients with SPS was only present when using the eGFRcys/eGFRcrea rather than the eGFRcys/Cin definition. Cystatin C and BTP are related independent of creatinine, suggesting glomerular pore size as a common denominator. The prevalence of SPS in children is comparable to adults. For research in SPS, a definition based on eGFRcys/exogenous clearance study may be useful to study the effect of SPS on creatinine metabolism.
Introduction
Cystatin C, a low molecular weight protein marker of GFR, has been correlated to increased all-cause and cardiovascular mortality, independent of kidney function [Citation1–4]. When comparing the creatinine-based with the cystatin C-based estimated GFR (eGFRcrea and eGFRcys, respectively) in adults, Grubb et al. noted that in around 8% of their adult population, eGFRcys was less than 60% of the respective eGFRcrea [Citation5] in the absence of known factors influencing creatinine or cystatin C metabolism. This group had excess mortality, both in the subgroups with advanced renal failure (CKD stage 3 and higher) and in CKD 1 and 2 patients [Citation6]. In this subgroup, beta-trace protein (molecular weight (MW) 23 kDa) and beta-2 microglobulin (MW 11.8 kDa), two other low-molecular weight protein (LMWP) markers of GFR, along with renally excreted macromolecules also accumulate in excess of creatinine [Citation7,Citation8]. During the course of pregnancy, cystatin C, along with beta-trace protein and beta-2 microglobulin concentrations, showed an increase relative to measured GFR, while no placental production was found, suggesting alterations in filtration selectivity [Citation9,Citation10].
In pregnant women, elevated cystatin C, beta-trace protein and beta-2 microglobulin concentrations with normal levels of creatinine have also been associated with an increased incidence of pre-eclampsia [Citation11]. Recently, lower markers for nitric oxide were demonstrated in these pregnant women, suggesting increased vessel tone as a causal factor [Citation12].
These observations prompted Grubb et al. to propose the concept of “Shrunken Pore Syndrome”, i.e. an alteration in glomerular pore size underlying the discordance between the LMWP GFR markers and creatinine associated with adverse outcomes. In Shrunken Pore Syndrome, cystatin C (MW 13.3 kDa) accumulates in excess of creatinine (MW 113 Da) due to changes in the filtration characteristics of the glomerular filter. The alterations in glomerular pore size lead to accumulation not only of LMWP GFR markers, but also of pro-inflammatory molecules of similar size, such as interleukin 1-β (MW 17 kDa) and interleukin 6 (MW 23–25 kDa) [Citation13,Citation14]. This might result in a chronic inflammatory state underlying the observed excess mortality in patients with Shrunken Pore Syndrome.
In line with observations in adults, we recently described a similar distribution of eGFRcys compared to eGFRcrea in children in whom larger discrepancies between the two reflected overestimation of eGFRcrea and underestimation of eGFRcys [Citation15]. We therefore hypothesize that the changes in filtration characteristics observed in Shrunken Pore Syndrome are also present in children. Aim of the present study was to compare the two LMWP GFR markers cystatin C and beta-trace protein with serum creatinine using inulin clearance as gold standard to establish a physiological link between cystatin C and beta-trace protein independent of the filtration of small solutes, such as creatinine or inulin, which would support the existence of Shrunken Pore Syndrome in children.
Methods
Study population
We retrospectively analyzed data from pediatric patients who underwent a single injection inulin clearance test on clinical grounds between 2004 and 2015. We excluded patients with neural tube defects, since the body composition of these patients precludes effective use of creatinine and beta-trace protein as markers for kidney function [Citation16]. Also excluded were patients undergoing glucocorticosteroid treatment, since this is known to affect cystatin C as well as beta-trace protein concentrations [Citation17], and patients with thyroid dysfunction [Citation18].
Analytical methods
The single injection inulin clearance (Cin) was performed as described previously [Citation17,Citation19]. In short, patients were injected with a single dose of inulin (Inutest®, Fresenius, Bad Homburg, Germany) of 5000 mg/m2, with a maximum of 5000 mg. Subsequently, at timed intervals blood was taken for inulin measurement. Inulin was measured by acid hydrolysis at 80 °C with perchloric acid and subsequent conversion of fructose to glucose-6-phosphate by hexokinase and isomerase. The final enzymatic step used glucose-6-phosphate-dehydrogenase [Citation20,Citation21]. GFR was calculated from the rate of decline of inulin concentrations with MW/Pharm 3.5 (Mediware, Groningen, The Netherlands) using a Bayesian model incorporating patient and population data. During the test, blood was taken for the measurement of creatinine, cystatin C and beta-trace protein. From 2008 onwards, creatinine was measured using the creatinase-sarcosine oxidase enzymatic method, which is traceable to isotope dilution mass spectrometry (IDMS), whereas before 2008, a kinetic Jaffe method was used. The low-molecular weight proteins were measured by particle-enhanced immunonephelometry on a Behring Nephelometer II (Siemens Healthcare, Marburg, Germany), which, in the case of cystatin C, was calibrated to the International Federation of Clinical Chemists (IFCC) standard [Citation22]. For both creatinine and cystatin C, data pre-dating IFCC standardization were recalculated using the factors described in an earlier publication (IFCC creatinine in µmol/l = non-IFCC creatinine in µmol/l × 1.1-26; IFCC cystatin C in mg/l = non-IFCC cystatin C in mg/l × 1.17) [Citation23].
eGFR equations
In order to minimize bias from the equation structure, we selected eGFR equations that were established following the same principle and which have been demonstrated to perform well in our hands [Citation15,Citation16,Citation23]. These equations are:
(i) The creatinine-based FASage equation [Citation24]
(ii) The cystatin C-based FAScys equation [Citation25]
with cystatin C in mg/l
(iii) The beta-trace protein-based FASBTP equation [Citation16]
with beta-trace protein in mg/l
Definitions
To assess the accuracy of the equations within this population, we use P10 and P30 accuracy levels, which describe the percentage of cases in which eGFRx is within ±10 or ±30% of Cin, respectively.
The common definition of Shrunken Pore Syndrome is eGFRcys/eGFRcrea ≤0.6 [Citation6], which is also applied in this study. Besides, an inulin clearance-based definition is used, i.e. eGFRcys/Cin below arbitrary thresholds of 0.6, 0.7 and 0.8.
To identify whether there is over- or underestimation of eGFRx compared to the gold standard we use error of eGFRx(%), defined as:
(iv) (eGFRx-Cin)/Cin x 100%
The Cin-based definition of Shrunken Pore Syndrome is mathematically linked to the error of eGFRcys (%): eGFRcys ≤0.6 Cin corresponds to an error of eGFRcys of −40% or lower.
Statistical methods
The relationship between eGFRBTP and eGFRcys/eGFRcrea is analyzed using linear regression analysis with the ratio as dependent variable and the error of eGFRBTP(%) as independent variable. Results are given as B-values with 95% confidence intervals (CI), statistical significance is defined as p < .05.
Differences in eGFR, Cin, error (%) and eGFRBTP/eGFRcrea ratio between groups of patients who fit the definition of Shrunken Pore Syndrome and those who do not are given in medians [interquartile range (IQR)] and statistical significance is tested by independent samples median test. Here, a non-parametric test is used due to the size differences between the groups, causing a non-Gaussian distribution. All statistical analyses were performed using SPSS version 25.
Results
Patient characteristics and performance of eGFR equations
Data on 294 unique patients undergoing inulin clearance tests were analyzed. Mean age was 12.6 years (range 2.1–19.5), mean Cin was 90.9 ml/min/1.73m2 (range: 13.4–185.0). About 59.2% of the patients were male. The primary diagnosis was malignancy in 20.7%, single kidney in 31.6%, nephritis in 15.3%, urological in 12.2%, follow-up after malignancy in 4.4% and other in 15.6%.
The performance of all three eGFR equations in our population in terms of mean error (%) and P30 and P10 accuracy rates is summarized in , with all three equations performing adequately.
Table 1. Performance of the eGFR three equations in the entire group.
Relationship between the error of eGFRBTP(%) and the eGFRcys/eGFRcrea ratio
The error of eGFRBTP(%) is plotted against the ratio eGFRcys/eGFRcrea in . Here, a positive correlation is seen between the error of eGFRBTP(%) and the eGFRcys/eGFRcrea ratio, indicating underestimation of GFR by beta-trace protein with decreasing eGFRcys/eGFRcrea (B = 0.107 [95% CI 0.202 to 0.013], p = .026), i.e. a parallel filtration impairment of both protein GFR markers.
Figure 1. Relationship between the ratio eGFRcys/eGFRcrea and error of eGFRBTP (%).
Shrunken pore syndrome defined by the eGFRcys/eGFRcrea ratio
Grubb et al. suggest the somewhat arbitrary cut-off point of eGFRcys ≤0.6 eGFRcrea for the definition of Shrunken Pore Syndrome [Citation5]. However, other cut-off points have also been used [Citation8]. compares patients who fit the definition for Shrunken Pore Syndrome (SPS+) and those who do not (SPS−) using cut-off points of 0.6 and 0.7. Depending on the cut-off used the prevalence is 4.8% and 13.9%.
Table 2. Comparison between patients with (SPS+) and without (SPS−) Shrunken Pore Syndrome defined by different cut-offs of eGFRcys/eGFRcrea.
Patients who fit the definition of Shrunken Pore Syndrome have significantly negative error of eGFRcys(%) and positive error of eGFRcrea(%), regardless of the cut-off level used. This is to be expected since this group is defined by low eGFRcys compared to eGFRcrea and, therefore, underestimation of GFR by eGFRcys and overestimation by eGFRcrea is likely. Interestingly, the difference in eGFRcys is very small, indicating that the difference in error is mainly due to shifts in Cin between the two groups as Cin levels are higher in SPS + than SPS−. The link between eGFRcys/eGFRcrea and Cin was confirmed by linear regression analysis demonstrating a significant negative correlation (B = −0.228 [95% CI −0.313 to −0.143], p = .000). Like eGFRcys, eGFRBTP is very similar between SPS + and SPS−, while the error of eGFRBTP(%) tends to be more negative in the SPS + group reaching significance when a cut-off of 0.7 is used. Also, eGFRBTP/eGFRcrea is significantly lower in SPS + patients irrespective of the cut-off used to define Shrunken Pore Syndrome.
When comparing cystatin C and creatinine, the changes for creatinine are more pronounced than for cystatin C indicating that the eGFRcys/eGFRcrea–based definition is strongly driven by creatinine. This is a potential confounding factor in Shrunken Pore Syndrome research as patients with adequate levels of cystatin C for their GFR but abnormally low levels of creatinine for any reason also meet the definition of Shrunken Pore Syndrome. To counter this problem, we studied an alternative definition based on eGFRcys/Cin.
Shrunken pore syndrome defined by the eGFRcys/cin ratio
compares patients who fit the definition for Shrunken Pore Syndrome (SPS+) and those who do not (SPS−), using cut-off points of eGFRcys/Cin of 0.6, 0.7 and 0.8. Depending on the cut-off used, the incidence of Shrunken Pore Syndrome is 2.7%, 8.2% and 20.4%.
Table 3. Comparison between patients with (SPS+) and without (SPS−) Shrunken Pore Syndrome defined by different cut-offs of eGFRcys/Cin.
Here, too, the lower error of eGFRcys(%) in the SPS + group is driven by a higher Cin rather than a lower eGFRcys. The error of eGFRcys(%) and eGFRBTP(%) is more negative in the SPS + group indicating impaired filtration of these proteins, while there is little to no difference for creatinine. While the eGFRBTP/eGFRcrea– ratio was statistically lower in SPS + patients using the eGFRcys/eGFRcrea-based definition [median 0.45 versus 0.99 p = .003], this is not the case when using the inulin clearance-based definition [0.73 versus 0.97 p = .720].
Discussion
This is the first study addressing Shrunken Pore Syndrome in children and studying the relationship between the low-molecular weight protein markers cystatin C and beta-trace protein versus serum creatinine using inulin clearance as gold standard. The prevalence of Shrunken Pore Syndrome in children using the commonly used eGFRcys/eGFRcrea definition is similar to adult patients. We demonstrate that cystatin C and beta-trace protein are linked independent of serum creatinine supporting the role of pore size affecting their elimination.
The similarity in distribution of the two LMWP markers can potentially be explained by a number of renal and non-renal factors: (i) The rate of synthesis might be linked, (ii) there might be similarities in renal tubular re-absorption or (iii) the equations used to estimate eGFR might add a bias depending on the population where they were derived and (iv) glomerular elimination might be linked by either similar electric charge or similar molecular size. Of course, all these potential similarities must not apply to creatinine and measured GFR in order to fit with our findings.
It has been shown that production sites and production pathways of all three markers are different [Citation26,Citation27]. However, several factors influencing the production of beta-trace protein and cystatin C, such as genetic polymorphisms [Citation28,Citation29] as well as age and gender differences [Citation30,Citation31], are still being investigated so that some links in the synthesis of the two LMWP markers might still emerge. It is also unlikely that our findings are related to the equations used to estimate eGFR as the mean error of eGFRBTP(%) is positive for the population as a whole so that the negative error found in patients with Shrunken Pore Syndrome defined by eGFRcys/eGFRcrea or eGFRcys/Cin ratios cannot be explained by bias within the equations. The iso-electric point differs, being 9.3 for cystatin C and 5.8–6.7 for beta-trace protein [Citation32].
Therefore, the strongest link between cystatin C and beta-trace protein when compared to creatinine and inulin is molecular weight, which is 23-29 kDa for beta-trace protein and 13.3 kDa for cystatin C, while the molecular weight of inulin is 5 kDa and 0.113 kDa for creatinine [Citation32]. Although the glomerular sieving of beta-trace protein [Citation33] is not as well defined as that of cystatin C [Citation34], molecular size affecting passage through the glomerular pores is the most likely common denominator [Citation35]. Therefore, changes in glomerular sieving characteristics as observed during pregnancy and in particular in pre-eclampsia lead to a parallel rise in cystatin C, beta-trace protein and other molecules of similar size [Citation36], an observation which led Anders Grubb to coin the term “Shrunken Pore Syndrome” [Citation5].
While one would expect eGFRcys or eGFRBTP to be decreased in SPS + patients, this is not the case. Still, errors of both parameters are strongly negative in SPS + patients, indicating underestimation in relation to a much higher Cin. This finding is in line with physiology data describing an inverse relationship between glomerular sieving coefficients and GFR for molecules of the size of cystatin C and beta-trace protein, while the sieving coefficient of small molecules like creatinine is not affected by GFR [Citation37,Citation38]. This also explains why these markers are not suitable for the recognition of hyperfiltration in diabetics as demonstrated by Perrin and Berg [Citation39]. The study by Huang et al. also showed an inverse relationship between measured GFR and eGFRcys, while the opposite was true for eGFRcrea and eGFRBTP was the least affected [Citation40].
The common definition of Shrunken Pore Syndrome relies on the relationship between serum levels of cystatin C and creatinine [Citation8] or the eGFRcys/eGFRcrea ratio [Citation6]. Due to the age-dependency of creatinine production, only the latter is applicable in children [Citation41]. Using this definition, a low eGFRcys is associated with a high eGFRcrea reflecting either accumulation of cystatin C or a decrease in serum creatinine or both [Citation5,Citation15]. The concept of Shrunken Pore Syndrome explains the underestimation of eGFRcys and eGFRBTP, but does not directly explain the overestimation of eGFRcrea compared to exogenous marker clearance studies found both in the present study and in adults when using eGFRcys/eGFRcrea definition [Citation42]. One potential explanation is the accumulation of pro-inflammatory molecules, which are roughly the same size as the LMW GFR markers and which might induce a catabolic state with (subclinical) muscle wasting and decreased creatinine production. This theory is supported by a recent study using proteomics, which showed higher concentrations of pro-inflammatory and atherosclerosis promoting proteins in patients with Shrunken Pore Syndrome compared to GFR-matched controls [Citation42]. This study also demonstrated an inverse relationship between molecular size and accumulation in Shrunken Pore Syndrome, a trend which can also been seen in our data where underestimation of GFR by cystatin C is more pronounced than by beta-trace protein. This pro-inflammatory state may also explain the increased mortality risk associated with cystatin C in general [Citation1–4] and in patients with Shrunken Pore Syndrome in particular [Citation6,Citation43,Citation44]. Indeed, there is a similar link between beta-trace protein and beta-2 microglobulin and cardiovascular and all-cause mortality [Citation45–48]. It must be borne in mind, however, that in all these studies, the definition used to identify patients with Shrunken Pore Syndrome is strongly affected by serum creatinine levels or eGFRcrea.
When comparing and , the strongly positive error of eGFRcrea(%) in SPS + patients defined by eGFRcys/eGFRcrea disappears when shrunken pores are defined based on Cin while the underestimation of eGFRBTP persists. This supports the presence of Shrunken Pore Syndrome in children and argues against prominent changes in creatinine metabolism underlying the definition of Shrunken Pore Syndrome. The different findings for eGFRcrea(%) using the two definitions can also be due to the size difference between creatinine and inulin (0.113 vs. 5 kDa). This might be tested by using iohexol clearance as the size of iohexol (MW 0.821 kDa) is more similar to creatinine than inulin. Data from recent studies linking clinical outcome data with measured GFR, cystatin C and beta-trace protein [Citation47–49] might be used for this purpose to determine a eGFRcys/measuredGFR-cut off to define Shrunken Pore Syndrome.
The association between the accumulation of LMWP markers and mortality found in adult populations is a gradual effect and does not appear to be an “on-off” phenomenon [Citation1]. This is reflected by the more negative errors of eGFRcys and eGFRBTP when broadening the definition of Shrunken Pore Syndrome in and . Therefore, the cut-off point suggested to define Shrunken Pore Syndrome is somewhat arbitrary and also affected by the eGFR equations used [Citation8]. Grubb et al. suggest a cut-off of eGFRcys/eGFRcrea ≤0.6, which is a level at which a clear difference in mortality is seen in adults, giving Shrunken Pore Syndrome its clinical relevance [Citation6]. Using this cut-off in our population, we find a prevalence of 4.8%, which is in line with the reported prevalence in adults ranging between 2.1% and 5.7% depending on the eGFR equation and population studied [Citation6]. However, a much lower (0.2–0.7%) [Citation8] as well as a higher (10.5–22.1%) [Citation43] prevalence have also been reported. With the Cin-based definition, the prevalence dropped to 2.7% when using a cut-off of 0.6. This can be explained by the augmenting factor of a low creatinine in the eGFRcys/eGFRcrea definition of Shrunken Pore Syndrome. It might therefore be preferable to use a higher cut-off of 0.7 (prevalence 8.2%) when using the Cin-based definition. However, the cut-off to define Shrunken Pore Syndrome ultimately needs to be defined based on hard clinical end-points (e.g. pre-eclampsia, mortality) using ROC analysis.
Our study has a number of limitations. First, as noted above, the definition of Shrunken Pore Syndrome should be based on adverse mortality outcomes, which is not feasible in a pediatric population. Second, the cross-sectional set-up of our study precluded an analysis of the intrapersonal variation of eGFRcys/Cin. Based on the association with adverse long-term outcomes one would expect that the presence of shrunken pores is a patient characteristic with little variability, in particular if defined based on Cin and not on eGFRcrea. It is also conceivable, however, that glomerular filtration characteristics in children and adolescents change with age, calling for serial measurements. Third, we did not measure creatinine excretion as parameter for creatinine production. Fourth, although in line with adult data, the prevalence data described need further study as they are currently based on arbitrary cut-offs.
Conclusion
Cystatin C and beta-trace protein are related independent of creatinine in children, too, suggesting glomerular pore size as a common denominator. The prevalence of Shrunken Pore Syndrome in children is comparable to adult data. For research in Shrunken Pore Syndrome, a definition based on eGFRcys/exogenous clearance study may be useful to study the effect of Shrunken Pore Syndrome on creatinine metabolism.
Disclosure statement
No potential conflict of interest was reported by the authors.
Related Research Data
References
- Bokenkamp A, Herget-Rosenthal S, Bokenkamp R. Cystatin C, kidney function and cardiovascular disease. Pediatr Nephrol. 2006;21:1223–1230.
- Meng L, Yang Y, Qi LT, et al. Elevated serum cystatin C is an independent predictor of cardiovascular events in people with relatively normal renal function. J Nephrol. 2012;25(3):426–430.
- Shin MJ, Song SH, Kwak IS, et al. Serum cystatin C as a predictor for cardiovascular events in end-stage renal disease patients at the initiation of dialysis. Clin Exp Nephrol. 2012;16(3):456–463.
- Foster MC, Inker LA, Levey AS, et al. Novel filtration markers as predictors of all-cause and cardiovascular mortality in US adults. Am J Kidney Dis. 2013;62(1):42–51.
- Grubb A, Lindström V, Jonsson M, et al. Reduction in glomerular pore size is not restricted to pregnant women. Evidence for a new syndrome: ‘Shrunken pore syndrome’. Scand J Clin Lab Invest. 2015;75(4):333–340.
- Dardashti A, Nozohoor S, Grubb A, et al. Shrunken Pore Syndrome is associated with a sharp rise in mortality in patients undergoing elective coronary artery bypass grafting. Scand J Clin Lab Invest. 2016;76(1):74–81.
- Risch M, Risch L, Purde MT, et al. Association of the cystatin C/creatinine ratio with the renally cleared hormones parathyroid hormone (PTH) and brain natriuretic peptide (BNP) in primary care patients: a cross-sectional study. Scand J Clin Lab Invest. 2016;76(5):379–385.
- Purde MT, Nock S, Risch L, et al. The cystatin C/creatinine ratio, a marker of glomerular filtration quality: associated factors, reference intervals, and prediction of morbidity and mortality in healthy seniors. Transl Res. 2016;169:80–90.
- Strevens H, Wide-Swensson D, Torffvit O, et al. Serum cystatin C for assessment of glomerular filtration rate in pregnant and non-pregnant women. Indications of altered filtration process in pregnancy. Scand J Clin Lab Invest. 2002;62(2):141–147.
- Kristensen K, Strevens H, Lindström V, et al. Increased plasma levels of beta2-microglobulin, cystatin C and beta-trace protein in term pregnancy are not due to utero-placental production. Scand J Clin Lab Invest. 2008;68(7):649–653.
- Risch M, Purde MT, Baumann M, et al. High first-trimester maternal blood cystatin C levels despite normal serum creatinine predict pre-eclampsia in singleton pregnancies. Scand J Clin Lab Invest. 2017;77(8):634–643.
- Jarquin Campos A, Risch L, Baumann M, et al. Shrunken pore syndrome, preeclampsia, and markers of NO metabolism in pregnant women during the first trimester. Scand J Clin Lab Invest. 2019;79(1-2):91–98.
- Simpson RJ, Hammacher A, Smith DK, et al. Interleukin-6: structure-function relationships. Protein Sci. 1997;6(5):929–955.
- March CJ, Mosley B, Larsen A, et al. Cloning, sequence and expression of two distinct human interleukin-1 complementary DNAs. Nature. 1985;315(6021):641–647.
- den Bakker E, Gemke R, van Wijk JAE, et al. Accurate eGFR reporting for children without anthropometric data. Clin Chim Acta. 2017;474:38–43.
- den Bakker E, Gemke R, Pottel H, et al. Estimation of GFR in children using rescaled beta-trace protein. Clin Chim Acta. 2018;486:259–264.
- Abbink FC, Laarman CA, Braam KI, et al. Beta-trace protein is not superior to cystatin C for the estimation of GFR in patients receiving corticosteroids. Clin Biochem. 2008;41(4-5):299–305.
- Fricker M, Wiesli P, Brändle M, et al. Impact of thyroid dysfunction on serum cystatin C. Kidney Int. 2003;63(5):1944–1947.
- Blufpand HN, Westland R, van Wijk JA, et al. Height-independent estimation of glomerular filtration rate in children: an alternative to the Schwartz equation. J Pediatr. 2013;163(6):1722–1727.
- Jung K, Klotzek S, Schulze BD. Refinements of assays for low concentrations of inulin in serum. Nephron. 1990;54(4):360–361.
- Degenaar CP, Frenken LAM, von Hooff JP. Enzymatic method for the determination of inulin. Clin Chem. 1987;33(6):1070–1071.
- Grubb A, Blirup-Jensen S, Lindström V, et al. First certified reference material for cystatin C in human serum ERM-DA471/IFCC. Clin Chem Lab Med. 2010;48(11):1619–1621.
- den Bakker E, Gemke R, van Wijk JAE, et al. Combining GFR estimates from cystatin C and creatinine-what is the optimal mix? Pediatr Nephrol. 2018;33(9):1553–1563.
- Pottel H, Hoste L, Dubourg L, et al. An estimated glomerular filtration rate equation for the full age spectrum. Nephrol Dial Transplant. 2016;31(5):798–806.
- Pottel H, Delanaye P, Schaeffner E, et al. Estimating glomerular filtration rate for the full age spectrum from serum creatinine and cystatin C. Nephrol Dial Transplant. 2017;32(3):497–507.
- Juraschek SP, Coresh J, Inker LA, et al. Comparison of serum concentrations of β-trace protein, β2-microglobulin, cystatin C, and creatinine in the US population. Clin J Am Soc Nephrol. 2013;8(4):584–592.
- den Bakker E, Gemke R, Bökenkamp A. Endogenous markers for kidney function in children: a review. Crit Rev Clin Lab Sci. 2018;55(3):163–183.
- Tin A, Astor BC, Boerwinkle E, et al. Genome-wide significant locus of beta-trace protein, a novel kidney function biomarker, identified in European and African Americans. Nephrol Dial Transplant. 2013;28(6):1497–1504.
- Loew M, Hoffmann MM, Koenig W, et al. Genotype and plasma concentration of cystatin C in patients with coronary heart disease and risk for secondary cardiovascular events. Arterioscler Thromb Vasc Biol. 2005;25(7):1470–1474.
- Groesbeck D, Köttgen A, Parekh R, et al. Age, gender, and race effects on cystatin C levels in US adolescents. Clin J Am Soc Nephrol. 2008;3(6):1777–1785.
- Ziegelasch N, Vogel M, Müller E, et al. Cystatin C serum levels in healthy children are related to age, gender, and pubertal stage. Pediatr Nephrol. 2019;34(3):449–457.
- Lindström V, Grubb A, Alquist Hegbrant M, et al. Different elimination patterns of beta-trace protein, beta2-microglobulin and cystatin C in haemodialysis, haemodiafiltration and haemofiltration. Scand J Clin Lab Invest. 2008;68(8):685–691.
- White CA, Ghazan-Shahi S, Adams MA. β-Trace protein: a marker of GFR and other biological pathways. Am J Kidney Dis. 2015;65(1):131–146.
- Tenstad O, Roald AB, Grubb A, et al. Renal handling of radiolabelled human cystatin C in the rat. Scand J Clin Lab Invest. 1996;56(5):409–414.
- Deen WM, Lazzara MJ, Myers BD. Structural determinants of glomerular permeability. Am J Physiol Renal Physiol. 2001;281(4):F579–F596.
- Kristensen K, Wide-Swensson D, Schmidt C, et al. Cystatin C, beta-2-microglobulin and beta-trace protein in pre-eclampsia. Acta Obstet Gynecol Scand. 2007;86(8):921–926.
- Rippe C, Asgeirsson D, Venturoli D, et al. Effects of glomerular filtration rate on Ficoll sieving coefficients (theta) in rats. Kidney Int. 2006;69(8):1326–1332.
- Lund U, Rippe A, Venturoli D, et al. Glomerular filtration rate dependence of sieving of albumin and some neutral proteins in rat kidneys. Am J Physiol Renal Physiol. 2003;284(6):F1226–F1234.
- Perrin N, Berg UB. Estimated glomerular filtration rates cannot replace measured GFR in type 1 diabetes patients with hyperfiltration. Acta Paediatr. 2015;104(7):730–737.
- Huang SH, Sharma AP, Yasin A, et al. Hyperfiltration affects accuracy of creatinine eGFR measurement. Clin J Am Soc Nephrol. 2011;6(2):274–280.
- Leion F, Hegbrant J, den Bakker E, et al. Estimating glomerular filtration rate (GFR) in children. The average between a cystatin C- and a creatinine-based equation improves estimation of GFR in both children and adults and enables diagnosing Shrunken Pore Syndrome. Scand J Clin Lab Invest. 2017;77(5):338–344.
- Almén MS, Björk J, Nyman U, et al. Shrunken Pore Syndrome is associated with increased levels of atherosclerosis-promoting proteins. Kidney Int Rep. 2019;4(1):67–79.
- Christensson A, Grubb A, Molvin J, et al. The shrunken pore syndrome is associated with declined right ventricular systolic function in a heart failure population – the HARVEST study. Scand J Clin Lab Invest. 2016;76(7):568–574.
- Purde MT, Nock S, Risch L, et al. Ratio of cystatin C and creatinine-based estimates of the glomerular filtration rate predicts mortality in healthy seniors independent of kidney function. Scand J Clin Lab Invest. 2016;76(4):341–343.
- Cheung CL, Lam KS, Cheung BM. Serum beta-2 microglobulin concentration predicts cardiovascular and all-cause mortality. Int J Cardiol. 2013;168(5):4811–4813.
- Shafi T, Parekh RS, Jaar BG, et al. Serum β-trace protein and risk of mortality in incident hemodialysis patients. Clin J Am Soc Nephrol. 2012;7(9):1435–1445.
- Tangri N, Inker LA, Tighiouart H, et al. Filtration markers may have prognostic value independent of glomerular filtration rate. J Am Soc Nephrol. 2012;23(2):351–359.
- Bhavsar NA, Appel LJ, Kusek JW, et al. Comparison of measured GFR, serum creatinine, cystatin C, and beta-trace protein to predict ESRD in African Americans with hypertensive CKD. Am J Kidney Dis. 2011;58(6):886–893.
- Sundin PO, Sjöström P, Jones I, et al. Measured glomerular filtration rate does not improve prediction of mortality by cystatin C and creatinine. Nephrol Dial Transplant. 2017;32(4):663–670.