
 ?Mathematical formulae have been encoded as MathML and are displayed in this HTML version using MathJax in order to improve their display. Uncheck the box to turn MathJax off. This feature requires Javascript. Click on a formula to zoom.
Abstract
Measurement uncertainties in clinical chemistry are commonly regarded as heteroscedastic – having a constant relative standard deviation irrespective of the concentration of the measurand. The uncertainty is usually determined at two concentrations using stabilized control materials and assumed to represent the analytical goal. The purpose of the present study was to use duplicates of unselected patient samples to calculate the absolute and relative repeatability component of the intra-laboratory measurement uncertainty from duplicates, using the Dahlberg formula and analysis of variance components. Estimates were made at five different concentration intervals of ALT, AST, Calcium, Cholesterol, Creatinine, CRP, Triglycerides and TSH covering the entire concentration interval of the patient cohort. This partioning allows detailing their repeatability profiles. The calculations of the profiles were based on randomly selected results from sets of duplicates ranging from 12,000 to 65,000 pairs. The repeatability of the measurands showed substantial variability within the measuring interval. Therefore, characterizing imprecision profiles as purely homo- or heteroscedastic or by a single number may not be optimal for the intended use. The present data make a case for nuancing the evaluation of analytical goals and minimal differences of measurement results by establishing uncertainty profiles under repeatability conditions, using natural patient samples.
Introduction
Laboratories have an obligation, e.g. according to accreditation standards and legal requirements, to provide method performance criteria. Among other parameters, determination of the uncertainty of the measurement method is required, prompting laboratories to report a standard deviation (s) or coefficient variation (%CV, i.e. the standard deviation expressed relative to a specified value). The measurement uncertainty of laboratory results is important in their own rights and for their use in clinical decisions e.g. in comparing patient results with reference intervals or with previous results, i.e. in defining the minimal difference (MD) or reference change value (RCV). Metrologically, the uncertainty, expressed as absolute (s) or relative (%CV) standard deviation may differ within the measuring interval and a detailed account of the performance can be summarized in an uncertainty profile [Citation1,Citation2].
Measurement procedures are described as having either a constant absolute (s) or a relative (%CV) standard deviation in the measuring interval. These situations are called homoscedastic – shows constant standard deviation and heteroscedastic – does not show a constant standard deviation. In practice, however, measurement procedures are rarely purely homoscedastic or heteroscedastic [Citation3]. Consequently, the measurement uncertainty at a particular concentration cannot always be extrapolated from the available measurements of control materials.
Measurement uncertainty is the combined uncertainty of many sources, both physical and conceptual. Physical sources may be volume, temperature, pre-analytical effects etc. whereas the ‘conceptual’ can be repeatability, reproducibility and combined, i.e. total or intra-laboratory uncertainty. Methods for appraising the physical uncertainty are described and formalized in the standard GUM, ISO-BIPM [Citation4] document whereas the conceptual may be detailed in the scientific and professional literature [Citation5–7].
The Dahlberg uncertainty, also recognized as the Dahlberg error or the Dahlberg factor, is calculated under ‘repeatability’ conditions and therefore addresses only a part of the combined uncertainty under stable analytical conditions. Recently, we described and explored the mechanism of calculating the standard deviation according to the Dahlberg procedure [Citation6] and compared that estimate with standard deviations derived conventionally [Citation7,Citation8] and by means of analysis of variance components (ANOC). We concluded that the Dahlberg procedure offers a ‘best estimate’ of the uncertainty expressed as a weighted standard deviation under repeatability conditions in a defined measuring interval. Conventional formulas provide the repeatability or intra-laboratory imprecision and the analysis of variance components method (ANOC) can identify the repeatability and reproducibility components of the intra-laboratory imprecision depending on the experimental design [Citation9,Citation10]. The Dahlberg method is commonly based on patient samples of varying concentrations analysed in duplicates, and the results will only be valid in the actual concentration interval. The conventional formula and the ANOC require that the same sample is used. If, however, a set of duplicates of varying concentration is analysed by the ANOC, the calculated repeatability profile will be valid and show the same result as the Dahlberg formula whereas the between group variance describes the distribution of the sample results and thus not the true reproducibility.
The ANOC has the advantage over the Dahlberg approach to allow several observations in each group rather than just duplicates since the mean squares are based on the sum of squares which can summarize any number of observations. The relative repeatability imprecision which can be calculated according to Dahlberg should be based on the relative difference of each pair of duplicates, i.e. related to the average of the results of the pair [7]. It will therefore be relative to the average of the measured samples and not a predetermined value. A similar calculation might be difficult to achieve with the ANOC.
In the present study we calculated the repeatability profiles for eight commonly requested quantities, in order to determine to what extent the profiles were homo- or heteroscedastic. The data were previously accumulated during about one year for a study of the frequency of extreme differences between duplicate measurements [8]. The measurement procedure was based on duplicate measurements, repeats, performed adjacent to each other to ascertain that there is no or a negligible bias.
Method and materials
Recently, we reported the results of a study of the frequency of outliers and extreme differences identified by a large number of duplicate measurements of natural patient samples [Citation8]. Between about 12,000 and 64,000 duplicate values of eight frequently requested measurands were measured (). The data were collected from unselected patients but even so and foreseeable, there was an overrepresentation of results within the reference intervals and thus the distributions of the data were skewed.
Table 1. Number of duplicate observations (rounded down to the nearest hundred) within the interval indicated in the parenthesis.
All measurements were performed in the routine laboratory in Greifswald which used three Dimension Vista 1500 instruments. Procedures and reagents were according to the manufacturer´s instruction (Siemens Healthcare Diagnostics, Eschborn, Germany). The measurements were monitored according to the Rili-BAEK [Citation11,Citation12] IQC procedures and only results from clinically accepted measurements were included in the study. To be included in the presently used database both results had to comply with the quality rules. For further details, see Neubig et al. [Citation8].
The clinical samples were randomly measured by three different instruments and all results were pooled and sorted to remove extremes e.g. values close to the limit of quantitation (LoQ) and substantially above the upper reference limit (URL) since they would be outside the clinically relevant intervals. The remaining results were randomized, and two types of experiments performed.
The absolute and relative Dahlberg s and %CV were calculated from 1,000 pairs of randomized results. These were then partitioned as evenly as practical and possible into five partitions. The absolute and relative Dahlberg uncertainties were calculated for each partition and displayed in graphs. The MD (repeat) was derived. This was repeated ten times and the median and interquartile intervals (IQR) calculated.
For each quantity, the total bulk of randomized results was partitioned according to the groups defined in experiment 1). Thirty groups of 25 results, in all 750 pairs, were selected for each of the studied quantities and the Dahlberg uncertainties calculated for each group. The results were summarized as the median and IQR for each partition and quantity. The results were displayed in scattergrams.
By re-randomizing the datasets, partitions could be selected that utilized different data for experiments (1) and (2) and thus limiting confounding by overlap. This also allowed confirming experiments when unexpected results were obtained.
The ANOC analysis was applied to five partitions of the measurands of the entire dataset. The number of observations in each partition was in the order of 2,500 (P-TSH) to 23,000 (P-Creatinine) () but was not further subdivided. The repeatability was directly calculated as the square root of the mean square obtained in the standard ANOVA table.
Table 2. Number observations in each of the partitions analyzed by the ANOC. Concentration intervals as in .
Statistical procedures
The repeatability component of the measurement uncertainty was calculated by the Dahlberg procedure [Citation13] using the formula
where d is the difference between paired results and N is the number of pairs [Citation6].
The relative standard deviation is based on the relative difference of each pair, i.e. the difference in relation to the average of the observations.
The %CVD calculated expresses the weighted repeatability coefficient of variation, relative to the average of the concentrations in the measuring interval.
The minimal difference, MD, between measurements of two patient samples can be calculated at each partition as
where k, the coverage factor, was set to 2, conventionally representing a level of confidence of 95% and sD the best estimate of the repeatability.
An Excel spreadsheet program was developed to accommodate up to 1,000 pairs of duplicates and used for experiment (1). This spreadsheet was designed to provide the results presented in and and the adhering graphs ( and ). It allowed interactive adjustments of the partitions. A separate spreadsheet was used to calculate and summarize the median and IQR of the sD and %CVD of the 30 groups and presented in and , respectively.
Figure 1. Repeatability profiles based on 10 sets of1,000 duplicates. Absolute uncertainty (SS) are shown on the left Y-axis, relative uncertainty on the right axis. The X-axis shows the partitions (1–5), the corresponding concentration intervals are reported in . Error bars represent the IQR.
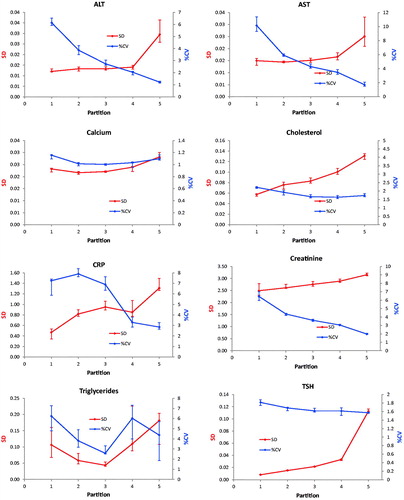
Figure 2. Repeatability profiles based on 30 sets of 25 duplicates. Absolute uncertainty (SD) are shown on the left Y-axis, relative uncertainty on the right axis. The X-axis shows the average concentration of the partitions. The concentration of the fifth partition has been selectively reduced to make the diagrams more readable. Error bars represent the IQR.
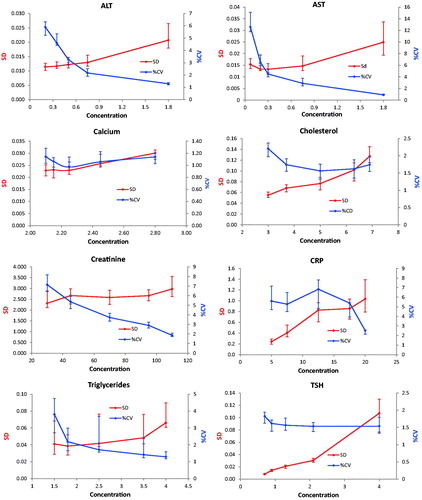
Table 3. The medians and 25- and 75 percentiles of results calculated from 10 repeated selections of 1,000 unique results. The minimal differences are based on the repeatability standard deviation in each partition.
Table 4. The medians and interquartile intervals were based on 30 groups of 750 pairs of observations after randomization of the initial dataset.
The ANOC is based on a standard ANOVA table. The mean square (MS) of the within group equals the within group variance and can be shown to be equal the Dahlberg expression. The relative standard deviation (%CV) was calculated using the average of the corresponding partition.
Results
The Dahlberg standard deviation and coefficients of variation were displayed together in scatter diagrams with either the partition number or concentration as the independent variable ( and ). The s was presented on the primary y-axis and the %CVD on the secondary ordinal axis. The partition number was used in presenting results of experiment 1 whereas the concentration was used in experiment 2. The concentrations used in the graphs of are the middle of the partition interval (average of the upper and lower limit). The notion of the highest value was reduced to improve readability in the graphs of ALT, AST, Creatinine and TSH in . Therefore, the slope of the connecting line in the last partition is not correctly shown. This approximation was not necessary when the partition number was used since these were represented by equal divisions of the axis.
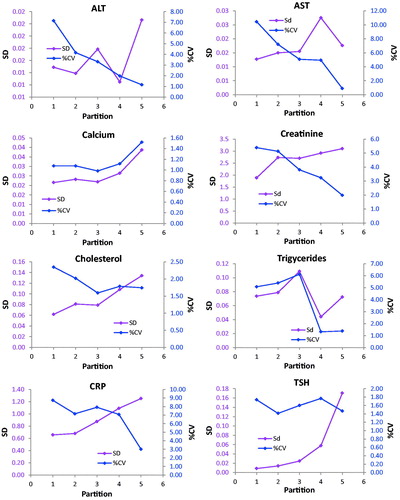
The profiles of the enzymes AST and ALT showed practically identical uncertainty profiles in both experiments and similar patterns were found for Creatinine, Triglycerides and TSH. A similar tendency was obtained for Cholesterol, whereas the profile of CRP was irregular with a heap covering the upper reference limit. The Calcium profile also showed a decrease in both sD and %CVD from the very low concentrations and then small increases. The imprecision profiles based on the ANOC analysis () of the entire dataset were generally the same as obtained by the experiments.
Figure 3. Repeatability profiles generated by ANOC analysis of the entire database.
Discussion
Measurement uncertainty/imprecision profiles in clinical chemistry were highlighted in the early days of competitive immunoassays [Citation1,Citation14,Citation15]. The four-parameter logistic (sigmoid) calibration functions used in those procedures described the data particularly well and is widely used to limit and devise the measuring interval. Imprecision profiles have been much less, or hardly at all, discussed for substrate or endpoint reactions where the calibration functions commonly are linear.
The profession has spent considerable efforts searching for optimal methods to calculate ‘analytical goals’. Dedicated conferences in Stockholm 1999 [Citation16] and in Milan 2014 [Citation17,Citation18] have been launched for the purpose. Subsequent to these conferences, procedures for establishing analytical goals were agreed. High on the hierarchal scale of recommendations were those based on measurement uncertainty and the biological variation. Less attention has been paid to how the recommended analytical goals should be assessed in the laboratory. However, quality manuals e.g. the international accreditation standard (ISO 15189) and the German laboratory quality system Rili-BAEK [Citation11,Citation12] require that control materials of two different concentrations are used to monitor the measurement precision and trueness. Commonly, the imprecision, e.g. the average relative standard deviation (%CV), calculated over time, of the two stabilized control materials is presented as the uncertainty of the measurement procedure whether the uncertainty profile is known or not. This is thus based on the reproducibility or intra-laboratory imprecision.
In case the relative standard deviation is constant throughout the measurement interval or the measurement uncertainty at the concentration which is best discerning between health and disease is used, the current practice is appropriate. However, for some measurands the absolute standard deviation is constant in a wide concentration interval and is likely to illustrate the performance of a measurement more appropriately. For instance, in the present report the uncertainty profile for AST shows a fourteen-fold decrease of the %CV whereas the increase of s was only two-fold ( and ). On the other hand, cholesterol showed a 2.5-fold increase of the s and a 1.5-fold decrease of the %CV within the measuring interval ( and ).
It was not generally possible to classify a method’s uncertainty profile as either homo- or heteroscedastic although specific intervals could be identified in which the standard deviation (Creatinine) or the coefficient of variation were almost constant (TSH) or both (Calcium), whereas the profiles for ALT, AST, Cholesterol and CRP could not be sensibly fitted to either.
The access to the very large database of duplicate measurements allowed utilizing the entire material to analysis of variance components. In those experiments each sample – consisting of two measurements – was regarded as a group in the ANOVA setup. The material was partitioned as in the general experiment of the present study. The mean square of the ‘within group’ is equivalent to the Dahlberg variance [Citation7] and liable to the same limitations. The general patterns of the imprecision profiles were comparable with those obtained in the experimental setup with randomly selected results. However, this approach will not give the intra-laboratory imprecision since the ‘between group’ mean square will essentially represent the variance of the distribution of the sample results. It therefore has no place in elucidation of the imprecision profile and only the square root of the within group mean square are reported.
The commutability of the materials used in estimating measurement uncertainty is crucial. Hage-Sleiman et al. [Citation19] showed that for troponin I, a systematically higher %CV, 13%, was obtained when stabilized control materials were used for estimating measurement uncertainty than when natural patient samples, 4%, were used. Similar effects have been cautioned by Sadler [Citation15,Citation20]. The results of the present study, which by definition uses fully communicable samples, i.e. patient samples, are therefore likely to illustrate the general pattern of the performance of the measurement methods used. The transferability of the absolute and relative uncertainty can only be judged by complying with requirements of the internal quality system. Although the study period was about one year, only values which were released to the clinic and thus fulfilling the quality requirements were used.
Raggatt [Citation21] used duplicates for estimating both ‘catastrophic errors’ and detecting outliers in addition to calculating precision profiles in immunoassays. Subsequent studies have had a primary focus on precision-/imprecision profiles in the context of measurement uncertainty [Citation2,Citation20–27].
The Dahlberg formula can be derived and understood in many ways. In a previous report [Citation4] the origin of the Dahlberg variance and its formal and practical relation to repeatability variance was discussed. The degrees of freedom in the Dahlberg calculation is the same as the number of duplicate pairs, which is equal to the degrees of freedom of the within-group variance in the ANOC approach.
The experimental setting for an analysis according to Dahlberg does not consider the between series variance and can therefore not be used for calculating the corresponding MD or RCV. However, it is important to recognize that these diagnostic aids may take different values if based on the repeatability or the intra-laboratory variation. The repeatability imprecision is generally smaller that the intra-laboratory imprecision and therefore signals a higher analytical sensitivity that the reproducibility. The differentiation of the imprecision profiles is important in inferring laboratory data in a rapid progressing disease, e.g. in intensive care, or chronic diseases or screening situations [Citation6].
We have used data from a large cohort to demonstrate the effects. A reliable estimate of the repeatability uncertainty using the Dahlberg approach can, however, be obtained using about 25 pairs of duplicates [Citation7].
Conclusions
Duplicate measurements can be used in the Dahlberg or ANOC to calculate the repeatability and the repeatability profile. To calculate both the repeatability and reproducibility and their profiles an experimental design must provide measurements under both conditions, i.e. several runs with repeated measurements using the same sample. In case ANOC analysis is applied to a series of IQC results additional information can be obtained, e.g. about differences between reagent lots, measurement systems or laboratories. Taken together, our results indicate that repeatability imprecision profiles calculated from duplicate measurements of natural patient samples within the intervals of concentration encountered in a laboratory may provide nuanced repeatability imprecision profiles compared to those provided by a few observations using stabilized control materials. It is emphasized that the repeatability which is obtained by the procedures presented in the present report do not represent the method imprecision except when used in similar repeatability conditions i.e. repeated measurement within a short time e.g. intensive care.
Disclosure statement
No potential conflict of interest was reported by the authors.
Additional information
Funding
References
- Ekins RP. The precision profile: its use in assay design, assessment and quality control. In: Hunter WM, Corrie JT, editors. Immunoassays for clinical chemistry. London: Churchill Linvingstone; 1983. p. 111–122.
- Sadler WA, Smith MH. Use and abuse of imprecision profiles – some pitfalls illustrated by computing and plotting confidence-intervals. Clin Chem. 1990;36(7):1346–1350.
- Hyslop NP, White WH. Estimating precision using duplicate measurements. J Air Waste Manage Assoc. 2009;59:1032–1039.
- JCGM. Evaluation of measurement data — guide to the expression of uncertainty in measurement. JCGM. 2008;100. GUM 1995 with minor corrections. [cited 2019 Dec 27]. http://www.bipm.org/utils/common/documents/jcgm/JCGM_100_2008_E.pdf
- Oosterhuis WP, Bayat H, Armbruster D, et al. The use of error and uncertainty methods in the medical laboratory. Clin Chem Lab Med. 2018;56(2):209–219.
- Kallner A, Theodorsson E. Repeatability imprecision from analysis of duplicates of patient samples. Scand J Clin Lab Invest Accepted for Publ. 2019.
- Kallner A, Theodorsson E. An experimental study of methods for the analysis of variance components in the inference of laboratory information. Scand J Clin Lab Invest Accepted for Publ. 2019.
- Neubig S, Grotevendt A, Kallner A, et al. Analytical robustness of nine common assays: frequency of outliers and extreme differences identified by a large number of duplicate measurements. Biochem Med. 2017;27:192–198.
- Aronsson T, Groth T. Nested control procedures for internal analytical quality control. Theoretical design and practical evaluation. Scand J Clin Lab Invest Suppl. 1984;172:51–64.
- ISO/DIS 5725. Accuracy (trueness and precision) of measurement methods and results - Part 2 Basic method for the determination of repeatability and reproducibility of a standard measurement method. ISO Geneva. 1994.
- Bundesärztekammer. Neufassung der “Richtlinie der Bundesärztekammer zur Qualitätssicherung laboratoriumsmedizinischer Untersuchungen – Rili-BÄK”. Bundesärztekammer. [cited 2019 Dec 27]. https://www.bundesaerztekammer.de/fileadmin/user_upload/downloads/pdf-Ordner/RL/Rili-BAEK-Laboratoriumsmedizin.pdf
- Revision of the “Guideline of the German Medical Association on Quality Assurance in Medical Laboratory Examinations – Rili-BAEK” (unauthorized translation). Laboratoriumsmedizin. 2015;39:26–69.
- Dahlberg G. Statistical methods for medical and biological students. London: G. Allen & Unwin Ltd.; 1940.
- Rodbard D. Statistical quality control and routine data processing for radioimmunoassays and immunoradiometric assays. Clin Chem. 1974;20(10):1255–1270.
- Sadler WA. Imprecision profiling. Clin Biochem Rev. 2008;29(Suppl 1):S33–S36.
- Fraser CG, Kallner A, Kenny D, et al. Introduction: strategies to set global quality specifications in laboratory medicine. Scand J Clin Lab Invest. 1999;59(7):477–478.
- Panteghini M, Sandberg S. Defining analytical performance specifications 15 years after the Stockholm conference. Clin Chem Lab Med. 2015;53(6):829–832.
- Sandberg S, Fraser CG, Horvath AR, et al. Defining analytical performance specifications: consensus Statement from the 1st Strategic Conference of the European Federation of Clinical Chemistry and Laboratory Medicine. Clin Chem Lab Med. 2015;53(6):833–835.
- Hage-Sleiman M, Capdevila L, Bailleul S, et al. High-sensitivity cardiac troponin-I analytical imprecisions evaluated by internal quality control or imprecision profile. Clin Chem Lab Med. 2019;57(4):E49–E51.
- Sadler WA, Smith MH, Legge HM. A method for direct estimation of imprecision profiles, with reference to immunoassay data. Clin Chem. 1988;34(6):1058–1061.
- Raggatt PR. Duplicates or singletons – an analysis of the need for replication in immunoassay and a computer-program to calculate the distribution of outliers, error rate and the precision profile from assay duplicates. Ann Clin Biochem. 1989;26(1):26–37.
- Berweger CD, Muller-Plathe F, Hanseler E, et al. Estimating imprecision profiles in biochemical analysis. Clin Chim Acta. 1998;277(2):107–125.
- Gonzalez AG, Herrador MA. Accuracy profiles from uncertainty measurements. Talanta. 2006;70:896–901.
- Gonzalez AG, Herrador MA. A practical guide to analytical method validation, including measurement uncertainty and accuracy profiles. TRAC-Trends Anal Chem. 2007;26:227–228.
- Kenward MG. A method for comparing profiles of repeated measurements. Appl Statist. 1987;36(3):296–308.
- Lee KY, Yanagisawa Y, Spengler JD, et al. Assessment of precision of a passive sampler by duplicate measurements. Environ Int. 1995;21(4):407–412.
- Macarthur R, Feinberg M, Bertheau Y. Construction of measurement uncertainty profiles for quantitative analysis of genetically modified organisms based on interlaboratory validation data. J Aoac Int. 2010;93(3):1046–1056.