
Abstract
Impaired insulin secretion and action are important for development of type 2 diabetes (T2D) and metabolic syndrome (MetS). Despite recognized heterogeneity of these glucometabolic disorders, few data are available of biological variation in insulin secretion and action among individuals with T2D and MetS. The aim of this study was to explore the inter-individual variations using gold standard methods in a cross-sectional study of two independent cohorts of phenotypically well-characterized subjects. Cohort I included 486 subjects with MetS, and cohort II 62 subjects with established T2D. First phase insulin secretion was defined as the incremental area under the curve 0–8 min (iAUC0–8 min) during an intravenous glucose tolerance test (IVGTT). Insulin sensitivity was measured as the insulin sensitivity index (SI) modelled from IVGTT in cohort I, and in II as total glucose disposal (TGD) estimated from a euglycaemic-hyperinsulinaemic clamp. Variation is given as total range and, fold-variation between 5%- and 95%-percentile. The iAUC0–8 min ranged from −60 to 3397 mUL−1min−1 among subjects with MetS and from −263 to 1194 mUL−1min−1 in subjects with T2D, representing a more than 10-fold variation. Insulin sensitivity ranged from SI 0.19 to 15.29 (mU/L)−1min−1 among subjects with MetS and TGD 12.9–101.6 μmolkgFFM−1min−1 in subjects with T2D, representing a 6.8 and 5.5-fold variation, respectively. The other components of MetS; BMI, waist-hip ratio, HDL-cholesterol, triglycerides and blood pressure (BP), showed a 1.4–4.7-fold variation. In conclusion, our data demonstrated extensive inter-individual variations in insulin secretion and sensitivity. These variations may be essential to take into account when planning clinical research and treatment in subjects with T2D and MetS.
Introduction
Type 2 diabetes (T2D) is considered to result from a combination of insulin secretory dysfunction and insulin resistance [Citation1]. Insulin resistance is often associated with a number of cardiovascular risk factors in a metabolic syndrome (MetS) characterized by hyperglycaemia, abdominal adiposity, hypertension and dyslipidaemia [Citation2]. During the development of T2D, fasting and/or post-prandial glucose levels most often increase gradually through states of impaired fasting glucose or impaired glucose tolerance before reaching manifest T2D [Citation3]. The β-cell dysfunction in T2D reflects insufficient adaptation to the increased demand due to peripheral and hepatic insulin resistance [Citation3]. Initially, insulin resistance leads to elevated insulin secretion to maintain normal blood glucose levels [Citation3]. When β-cells decompensate, plasma insulin concentrations fall, glucose concentrations increase and T2D develops [Citation3]. Emerging evidence also suggests that the process is accompanied by loss of β-cells [Citation4].
Whereas various in vivo tests of insulin sensitivity mostly estimate the same phenomenon (insulin-driven flux of glucose into cells), different in vivo tests of insulin secretion explore very different aspects of β-cell function, and no single test allows β-cell function to be assessed with accuracy and specificity [Citation1].
Kahn et al. [Citation5] have pioneered the concept that a hyperbolic relationship exists between β-cell function and insulin sensitivity [Citation5]. The hyperbola hypothesis implies that the product β-cell function x insulin sensitivity is nearly constant, called the disposition index (DI) [Citation5]. In response to increasing insulin resistance, a compensatory increase in insulin secretion will normally maintain glucose tolerance, but result in increased basal insulin levels and more pronounced glucose-stimulated insulin responses. In T2D, the pancreatic β-cells are unable to compensate for the increasing insulin resistance. Plasma insulin levels will decrease and the patients ‘fall off’ the hyperbolic curve [Citation5].
Although the general pathogenic aspect assumed here applies to groups of subjects, few studies have reported the between-subject variation in insulin secretion and sensitivity observed among individuals with prediabetes and T2D. Thus, the aim of this study was to explore the inter-individual variation in different parameters of insulin secretion and sensitivity measured in two cohorts of subjects across the glucometabolic spectrum; cohort I consists of subjects with MetS and cohort II subjects with established T2D.
Materials and methods
Subjects
To assess the inter-individual variations in insulin secretion and insulin sensitivity we used data from two previously established cohorts. Cohort I includes 486 subjects of Caucasian ethnicity, aged 35–70 years, with BMI 20–40 kg/m2, having MetS defined by three or more of the following slightly modified National Cholesterol Education Programme (NCEP) Adult Treatment Panel (ATP)-III criteria [Citation6]: levels of fasting plasma glucose >5.5 mmol/L, triglycerides ≥1.5 mmol/L, high-density lipoprotein (HDL)-cholesterol <1.0 mmol/L (men) or <1.3 mmol/L (women), systolic blood pressure (BP) ≥130 mmHg or diastolic BP ≥85 mmHg or on BP-lowering medication, and waist circumference >102 cm (men) or >88 cm (women). Participants were recruited to a randomized controlled dietary intervention trial, performed in eight European centres as part of the EU 6th Framework integrated project ‘Diet, genomics and the metabolic syndrome – LIPGENE’. Details of the study design and main results have been published previously [Citation7–9]. In this study, we have only used data from the baseline investigations. Study exclusion criteria were pre-diagnosed diabetes, inflammatory diseases, use of statins and anti-inflammatory drugs, fatty acid supplements, alcohol abuse and recent weight change ≥3 kg. The study was approved by local ethics committees at each of the eight intervention centres (Dublin, Reading, Oslo, Marseille, Maastricht, Cordoba, Krakow and Uppsala), and written consent was obtained from all study participants.
Cohort II included 62 men and women >18 years of age with established T2D of Nordic or South Asian ethnicity, recruited to a randomized placebo-controlled vitamin D intervention trial. Details of the study design and main results have been published previously [Citation10,Citation11]. In this study, we have only used data from the baseline examinations. Exclusion criteria were: plasma concentrations of 25(OH)D3 >50 nmol/L, serum levels of free calcium >1.35 mmol/L, HbA1c >11%, autoimmune diabetes and BMI >45 kg/m2. Subjects with malignancy, a history of kidney stones, cardiovascular events during the past 6 months, glomerular filtration rate <30 mL/min/1.73 m2, BP >160/100 mmHg, or chronic inflammatory disease in an active phase, or pregnant and lactating women were not allowed to participate. The study was approved by the Regional Committee for Medical and Health Research Ethics (REK Sør-Øst) and adhered to the Declaration of Helsinki. All participants gave written, informed consent before any study-related procedure.
Methods
In cohort I, an insulin-modified intravenous glucose tolerance test (IVGTT) was performed. After an overnight fast a catheter was inserted into an antecubital vein for blood sampling and into a contralateral antecubital vein for glucose and insulin infusion. At time 0, 0.3 g/kg bodyweight of a 500 mg/mL glucose suspension was injected intravenously, and after 20 min a bolus of 0.03 IU/kg bodyweight of human insulin (Actrapid, NovoNordisk, Bagsvaerd, Denmark) was injected. Blood samples were drawn before, and 2, 4, 8, 19, 22, 30, 40, 50, 70, 90 and 180 min after the initial glucose injection. The MINMOD Millenium Programme version 6.02 (Richard N Bergman) was used to estimate insulin sensitivity (SI). The first phase insulin secretion was defined as the incremental area under the curve from time 0–8 min (iAUC0–8 min) i.e. the acute insulin response to glucose (AIRg). DI, insulin secretion adjusted for insulin sensitivity, was calculated as the product of SI and iAUC0–8 min. IVGTT modelling was performed according to a pre-specified standard operating procedure and 434 subjects had acceptable models.
BP was measured using an automatic BP measuring device. Measurements were taken with an appropriate-size cuff positioned on the upper arm at the level of the heart, and the patient had been resting for at least five minutes. The same arm was used for each measurement, at least two measurements were performed at each visit, and the average value was used for data processing.
All laboratory samples and clinical investigations were taken, processed and stored in accordance with the study-specific standard operating procedure. Body composition was measured by bio-impedance methodology [Citation8].
In cohort II, insulin secretion was similarly estimated as first phase insulin response to glucose after an IVGTT, but insulin sensitivity was measured by euglycaemic-hyperinsulinaemic clamp with infusion of deuterium labelled glucose to estimate endogenous glucose production before and during clamp. Briefly, a primed continuous infusion of [6,6-2H2]-glucose (Cambridge Isotope Laboratories, Andover, MA) was maintained throughout the experiment. After a 2-h tracer equilibration period, the IVGTT was performed, where 0.3 g/kg bodyweight of a 500 mg/mL glucose suspension was injected intravenously and blood was drawn for measurements of plasma glucose and serum insulin at 0, 2, 4, 6, 8, 10, 15, 20 and 30 min. Insulin secretion was calculated as iAUC0–8 min. Insulin secretion adjusted for insulin sensitivity (DI) was calculated as the product of incremental iAUC0–8 min and clamp total glucose disposal (TGD) in µmol/kg fat-free mass per minute.
Immediately after the IVGTT, the euglycaemic clamp was started with an insulin infusion rate of 80 mU/m2/min, using human insulin (Actrapid; Novo Nordisk, Bagsvaerd, Denmark). A variable infusion of glucose 200 mg/mL enriched with 8 mg [6,6-2H2]glucose/g glucose was continually adjusted to maintain euglycaemia. The clamp was maintained for at least 150 min until at least 30 min of stable euglycaemia was obtained. At the end of the clamp, three measurements of serum insulin and plasma deuterated glucose concentrations were performed at 10 min intervals. The glucose infusion rate (GIR) in µmol/kg FFM × min was calculated. Endogenous glucose production (EGP) was estimated at the end of the basal equilibrium period and at the end of the euglycaemic-hyperinsulinaemic clamp. At both measurements, plasma glucose was in steady state, with only minor variations in plasma glucose and tracer concentrations. Based on this, steady state equations were used, with the rate of supply corresponding to rate of disappearance to calculate EGP and TGD. Insulin sensitivity was calculated as TGD, including both the exogenous GIR and EGP.
Whole blood glucose concentration was measured by the glucose oxidase method (YSI 2300; Yellow Springs Instruments, Yellow Springs, OH), and plasma glucose was calculated (whole blood glucose × 1.119). [6,6-2H2]glucose was measured by liquid chromatography combined with tandem mass spectrometry (Sciex API 3000; Applied Biosystems, Foster City, CA) at the Clinical Metabolomics Core Facility (Rigshospitalet, Copenhagen, Denmark).
In both cohorts, routine clinical chemistry methods were used for measurements of HbA1c, glucose, lipids, C-peptide and insulin. The HOMA2 calculator version 2.2.2 (https://www.dtu.ox.ac.uk/homacalculator. . . . . . . ) was used to calculate HOMA2-IR and HOMA2-B values based on fasting glucose and C-peptide. The calculator can only be used for fasting C-peptide from 0.2 to 3.5 nmol/L and fasting blood glucose from 3.0 to 25.0 mmol/L [Citation12]. Individuals with values outside these ranges were excluded from the calculations. In cohort I, 79 individuals had fasting C-peptide values >3.5 nmol/L.
Clustering analysis
Data-driven cluster analysis (k-means) was performed in the MetS cohort. Clusters were based on four variables (age, BMI, HOMA2-IR and HOMA2-B). The optimal number of clusters for k-means clustering was k = 4 using factoextra and the elbow-method in R version 3.6.0 ((R Foundation for Statistical Computing, Vienna, Austria). Testing differences in the four variables between patients in the identified clusters were performed using ANOVA with Tukey’s HSD post hoc correction for multiple testing.
Statistical analysis
Data are presented as means ± SD unless otherwise specified. Student’s t tests were used for comparison of two groups, and Mann–Whitney U tests were used for comparison of two independent groups where the measured parameter did not follow a normal distribution. A two-sided p < .05 was deemed significant. Ranges of the different parameters of insulin secretion and action and MetS were examined by reporting the lowest and the highest values of the entire cohort. To avoid that few individuals and errors will have a decisive impact, truncated range after exclusion of the extreme values, <5th and >95th percentiles, are also given. Fold variation was calculated as the 95th percentile divided by the absolute value of the 5th percentile. To assess the relationship between insulin secretion and sensitivity, we performed model selection by constructing a simple linear model (y ∼ x) and several non-linear negative exponential models (y ∼ x−b), where b ranged from 0.1 to 1 (hyperbola), as well as a log-hyperbola function (y ∼ log(1/x)). The different models were evaluated against each other by performing analysis of variance (ANOVA). We used the IBM SPSS Statistics version 24 (SPSS, Chicago, IL) and R version 3.5.3 software packages.
Results
Clinical characteristics of the two cohorts are shown in and . There were 220 men and 266 women in cohort I, with a mean (±SD) age of 54.5 ± 9.1 years and BMI 32.3 ± 4.4 kg/m2. Of the total cohort, 95 individuals (19.6%) qualified for all five criteria of MetS, according to the NCEP III definition [Citation6], and 409 individuals (84.2%) for three or more of the criteria. Although established diabetes was an exclusion criterion for participating in cohort I, 46 individuals had a single fasting glucose measurement of 7 mmol/L or higher at the day of investigation. In cohort II, there were 37 men and 25 women with a mean (±SD) age of 55.7 ± 9.4 years, BMI 31.9 ± 4.9 and duration of diabetes of 10.0 ± 6.4 years. In cohort II, 10 patients were non-pharmacologically treated and 52 used insulin and/or oral antihyperglycaemic agents. Eleven of the participants in this cohort (17.7%) qualified for all five criteria of MetS and 48 individuals (77.4%) qualified for three or more of the criteria.
Table 1. Clinical characteristics of subjects in Cohort I.
Table 2. Clinical characteristics of subjects in cohort II.
Insulin secretion
There was a large inter-individual variation in measures of insulin secretion, measured as AUC0–8 min, DI and HOMA2-B among the participants in both cohorts. shows individual data for insulin secretion measured as HOMA2-B and AUC0–8 min, and shows the inter-individual variation for different parameters of insulin secretion in the two cohorts. In cohort I, HOMA2-B ranged from 67% to 992%. Insulin secretion, measured as iAUC0–8 min, ranged from −60 to 3397 mU L−1min−1. DI had the greatest spread of all measurements, with a range from −89 to 4053. Among participants in cohort II, the HOMA2-B ranged from 15% to 153%, iAUC0–8 min from −263 to 1194 mU L−1min−1 and DI from −5238 to 43,818.
Figure 1. Individual data for insulin secretion. Measured as HOMA2-B in cohort I (A) and cohort II (B), and as iAUC0–8 min in cohort I (C) and in cohort II (D). iAUC0–8 min: incremental area under the curve for the first phase (0–8 min) insulin response to glucose.
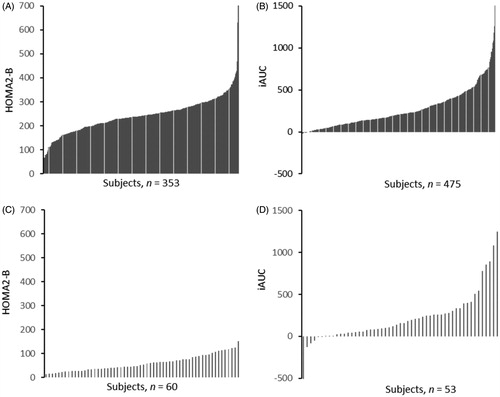
Table 3. Variation in insulin secretion indices for subjects in cohorts I and II.
Insulin action
The inter-individual variations in indices of insulin resistance, measured as fasting insulin, fasting C-peptide, HOMA2-IR, SI, GIR and TGD were also substantial, but tended to be smaller than for indices of insulin secretion. shows individual data for insulin resistance measured as HOMA-IR in both cohorts and SI in cohort I and TGD in cohort II. displays the inter-individual variation for some parameters of insulin action in the two cohorts. In cohort I, the measures of SI ranged from 0.19 to 15.29 (mU/L)−1min−1 and in cohort II, TGD ranged from 12.9 to 101.6 μmol kgFFM−1min−1.
Figure 2. Individual data for insulin resistance. Measured as HOMA2-IR in cohort I (A) and cohort II (B), and as SI in cohort I (C) and as TGD in cohort II (D). HOMA2-IR: homeostatic model assessment for insulin resistance, SI: insulin sensitivity index; TGD: total glucose disposal.
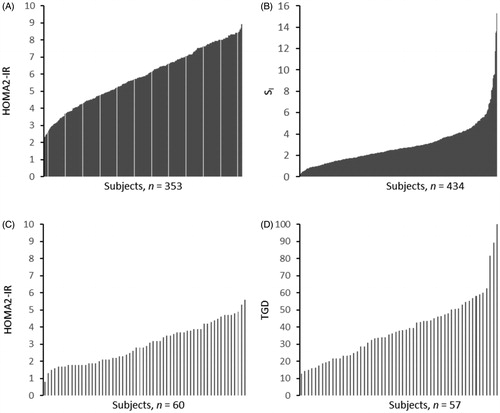
Table 4. Variation in insulin resistance or insulin sensitivity indices for subjects in cohorts I and II.
In order to put the large inter-individual variation in the measures of insulin secretion and sensitivity into perspective, we also calculated the inter-individual variation and fold variation in components of MetS (). In cohort I, the truncated fold variations were 1.5 for fasting plasma glucose, 4.1 for triglycerides and 1.5 for BMI. Corresponding findings in cohort II were 2.6 for glucose, 4.7 for triglycerides and 1.6 for BMI.
Table 5. Variation in components of the metabolic syndrome for subjects in cohorts I and II.
Relationship between insulin sensitivity and insulin response
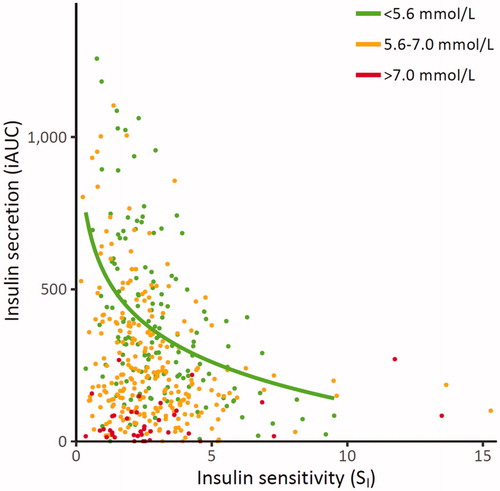
Plotting individual data of insulin sensitivity (SI) and insulin secretion (iAUC0–8 min) revealed a hyperbolic relationship in normoglycaemic individuals from cohort I, as expected based on the studies of Pacini [Citation13] and Ahren and Pacini [Citation14] (). In our data, the log-hyperbola function exhibited a superior data fit with the smallest sum of squared errors (SSE) of prediction, as based on ANOVA for model selection. demonstrates that individuals with impaired fasting plasma glucose or diabetic glucose range did ‘fall off the hyperbolic curve’ [Citation5]. In addition, reveals that several individuals with abnormal fasting plasma glucose values had insulin secretion and insulin sensitivity estimates indistinguishable from normoglycaemic individuals.
Figure 3. Relationship between insulin sensitivity (SI) and first-phase insulin secretion (iAUC) across different categories of fasting plasma glucose in cohort 1. Green points: subjects with fasting plasma glucose <5.6 mmol/L, orange points: subjects with fasting plasma glucose 5.6–7.0 mmol/L and red points: subjects with fasting plasma glucose >7.0 mmol/L. The green trend line shows the log-hyperbola relationship between insulin sensitivity and secretion within those with normal fasting plasma glucose. iAUC0–8 min: incremental area under the curve for the first phase (0–8 min) insulin response to glucose.
Data-driven k means clustering in the MetS cohort
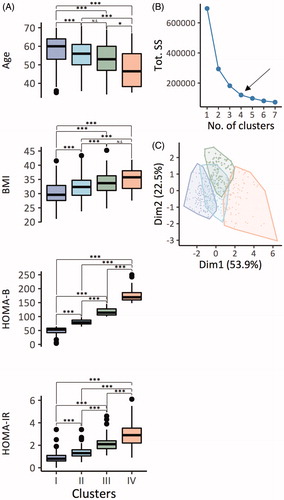
We identified four clusters of patients with MetS, which had significantly different patient characteristics (). In particular, individuals in cluster 1–4 exhibited decreasing age, and increasing BMI, HOMA-B and HOMA-IR (). The optimal number of clusters was chosen using the elbow-method (). Principal component analysis separated the means of four clusters using the first and second dimension () at a confidence level of 99%.
Figure 4. Distribution of MetS patients (n = 486) according to k-means clustering. (A) Pairwise comparison of age, BMI, HOMA-B and HOMA-IR between patients in the identified four clusters. The comparison was made using ANOVA with Tukey HSD post hoc correction for multiple testing. (B) The optimal number of clusters was chosen using the elbow-method. (C) Clustering of patients according to k means and principal component analysis. ***p< .001, **p< .01 and *p< .05. N.S: not significant. Tot. SS: total within the sum of squares. Dim1/2 = principal component 1/2.
Discussion
Although subjects with prediabetes and T2D display insulin resistance and reduced first-phase insulin secretion as compared to groups of normoglycaemic subjects, we show that there is an extensive inter-individual variation in both these parameters, with substantial overlap between groups. The individual variation in insulin resistance and first-phase insulin secretion were considerably larger than the variability in the common components used to characterize MetS.
Furthermore, we observed a log-hyperbolic relationship between insulin secretion and sensitivity in normoglycaemic subjects, consistent with previous reports [Citation13,Citation14]. This relationship indicates that insulin sensitivity is reduced with increasing hyperinsulinaemia, but after a certain threshold, which is different for each individual, even excessive insulin secretion results in near undetectably increased insulin sensitivity. Hence, the hyperbolic relationship fits well with the underlying biological processes for insulin signalling, such as thresholds and saturation of enzymatic reactions.
Surprisingly few studies have reported individual data and analysed the variation in insulin secretion and action depending on different degrees of glucose intolerance. However, a number of studies have reported insulin secretion and sensitivity in groups of normoglycaemic individuals [Citation5,Citation15–21]. Bardet et al. [Citation21] reported large inter- and intra-individual variability in AIRg measured by IVGTT in 41 healthy volunteers [Citation21]. Their results suggest that AIRg should be interpreted with caution even in normoglycaemic individuals due to the large variation. A population-based study of 380 young healthy Caucasians from Denmark reported that the insulin sensitivity index (SI) varied widely [Citation15]. The distribution of SI was skewed to the right, and the variation in SI was highest among the leanest subjects [Citation15]. About one-third of the variation in SI could be explained by body fat, maximum aerobic capacity, and women’s use of oral contraceptives [Citation15]. The strength of our study is a large number of individuals investigated with appropriate methods for measuring insulin secretion and sensitivity. Few studies of similar size have examined inter-individual variation with appropriate methods. IVGTT and subsequent minimal modelling is a well-known tool for estimating insulin sensitivity and insulin secretion, and the euglycaemic hyperinsulinaemic clamp is considered a gold standard to determine insulin sensitivity [Citation22].
The glucose clamp depends on steady state, whereas the minimal model technique uses dynamic data. IVGTT-based SI correlates well with insulin sensitivity estimates from the euglycaemic clamp in healthy subjects, but correlates poorer among subjects with overweight, impaired glucose tolerance or T2D [Citation23]. Another limitation of the IVGTT is that it requires a greater insulin response than clamp to get a precise estimate of insulin sensitivity, and this limits the use among individuals with insulin deficiency. It can be argued that IVGTT is not the optimal method for measuring insulin secretion in individuals with hyperglycaemia because the first-phase insulin secretion (AIRg) often disappears at fasting plasma glucose concentrations >7.0 mmol/L [Citation23]. However, an interesting finding in this study is that many people with fasting hyperglycaemia and even established diabetes still have significant first-phase insulin secretion intact.
Cohort I was a multi-centre study and the eight intervention centres used different recruitment strategies for participants in the study [Citation7,Citation8]. This may contribute to the observed variations. On the other hand, such a pan-European multi-centre study may increase the generalizability of the findings. Only individuals with Caucasian ethnicity participated in the LIPGENE study, which limits the generalizability to such individuals.
Another consideration that should be taken into account when interpreting the results is that participants in cohort I were selected to have MetS, which favours the inclusion of subjects with insulin resistance, although not all the individuals included in cohort I can be classified as insulin resistant.
Participants in cohort I were selected for vitamin D deficiency, and although vitamin D deficiency is fairly common, at least during the winter, this criterion may limit the extrapolation of our results to the general population of T2D patients. However, we found no effect of vitamin D supplementation on insulin secretion and action in our study [Citation11].
For the components of MetS, the variation in measurements between individuals was less than the variation in measurements of insulin sensitivity and resistance. The inter-individual variability is somewhat greater in the participants in cohort I than in cohort II. It is uncertain whether a single primary abnormality triggers a cascade of various events leading to manifestation of MetS, but some evidence suggests insulin resistance as the main defect linking the various components of MetS. The strength of this correlation varies between, and also within, different populations [Citation2].
It may be important to investigate whether more sophisticated methods to measure insulin secretion and action as reported in our present paper can contribute to improved phenotypic characterization of T2D. Being aware of the large inter-individual variation at different degrees of glucose tolerance may be important for understanding T2D and possible underlying disease mechanisms. Different individuals may have a different clinical course, risk of complications and the need for different types of treatment.
It is well known that T2D is a heterogeneous disease with regard to clinical presentation, progression and probably underlying disease mechanisms. Several studies have attempted to subclassify the T2D population based on pathophysiological subphenotypes with the ultimate aim able to individualize diabetes treatment. Ahlqvist et al. proposed in 2018 a new classification of T2D into five subgroups with different characteristics, and risk of diabetic complications [Citation24]. The subgroups were based on cluster analysis of six variables; the presence of autoantibodies, age at diagnosis, BMI, HbA1c, HOMA2-IR and HOMA2-B. The different clusters had significantly different patient characteristics and risk of diabetic complications such as diabetic kidney disease and diabetic retinopathy. Based on the classification suggested by Ahlquist et al., Zaharia et al. subclassified 1105 patients with newly diagnosed T1D or T2D in the German Diabetes Study into five clusters [Citation25]. They wanted to see if there was any association between cluster assignment and risk of diabetic neuropathy and non-alcoholic fatty liver disease (NAFLD) within 5 years after diagnosis. The prevalence of diabetes complications at early stages of NAFLD and diabetes neuropathy were also different in specific diabetic clusters.
In 2018, Stidsen et al. subphenotyped 4285 Danish patients with newly diagnosed T2D after WHO’s definition of T2D according to their beta-cell function, measured as HOMA-B, and insulin sensitivity, measured as HOMA-S [Citation26]. The patients were subclassified into insulinopenic T2D (low IS and low β-cell function), classical T2D (low IS and low β-cell function) and hyperinsulinemic T2D (low IS and low β-cell function). These researchers also examined the association between different T2D subphenotypes and important clinical characteristics such as age, gender, waist circumference and history of cardiovascular morbidity. There was a clinically significant difference in cardiovascular morbidity and waist circumference between the groups. All these findings support the notion that targeted treatment and prevention for diabetes complications may be more beneficial than treating all patients with T2D equally. We used a similar cluster-analysis approach and show a trend for clustering; however, the overlap between the clusters are substantial and we have no long-term outcome data from our cohorts to evaluate the predictive power of this clustering.
In conclusion, our data demonstrated extensive inter-individual variation in insulin secretion and somewhat less in insulin sensitivity. These inter-individual variations are essential to take into account when planning clinical research and treatment in subjects with MetS or T2D.
Acknowledgements
We thank the participants and the staff at all the clinical centres for their enthusiasm and support: Trinity College Dublin/University College Dublin, Ireland, University of Reading, UK, Oslo University Hospital Aker/University of Oslo, Norway, INSERM, Marseille, France, Maastricht University, The Netherlands Hospital Universitario Reina Sofía/University of Córdoba, Spain, Jagiellonian Medical College, Krakow, Poland and Uppsala University, Sweden. The authors also thank research nurses Åse Halsne and Gøril Vinje at Oslo University Hospital, Professor Gerrit Van Hall at the Clinical Metabolomics Core Facility, Rigshospitalet, Copenhagen, Denmark and the Simon Fougner Hartmann Foundation.
Disclosure statement
No potential conflict of interest was reported by the authors.
Additional information
Funding
References
- Ferrannini E, Mari A. Beta cell function and its relation to insulin action in humans: a critical appraisal. Diabetologia. 2004;47(5):943–956.
- Eckel RH, Alberti KG, Grundy SM, et al. The metabolic syndrome. Lancet. 2010;375(9710):181–183.
- Ferrannini E, Gastaldelli A, Miyazaki Y, et al. Beta-cell function in subjects spanning the range from normal glucose tolerance to overt diabetes: a new analysis. J Clin Endocrinol Metab. 2005;90(1):493–500.
- Marchetti P, Lupi R, Del Guerra S, et al. The beta-cell in human type 2 diabetes. Adv Exp Med Biol. 2010;654:501–514.
- Kahn SE, Prigeon RL, McCulloch DK, et al. Quantification of the relationship between insulin sensitivity and beta-cell function in human subjects. Evidence for a hyperbolic function. Diabetes. 1993;42(11):1663–1672.
- Third Report of the National Cholesterol Education Program (NCEP). Expert panel on detection, evaluation, and treatment of high blood cholesterol in adults (adult treatment panel III) final report. Circulation. 2002;106:3143–3421.
- Shaw DI, Tierney AC, McCarthy S, et al. LIPGENE food-exchange model for alteration of dietary fat quantity and quality in free-living participants from eight European countries. Br J Nutr. 2008;101(5):750–759.
- Tierney AC, McMonagle J, Shaw DI, et al. Effects of dietary fat modification on insulin sensitivity and on other risk factors of the metabolic syndrome–LIPGENE: a European randomized dietary intervention study. Int J Obes. 2011;35(6):800–809.
- Gulseth HL, Gjelstad IMF, Tiereny AC, et al. Effects of dietary fat on insulin secretion in subjects with the metabolic syndrome. Eur J Endocrinol. 2019;180(5):321–328.
- Wium C, Gulseth HL, Eriksen EF, et al. Characteristics of glucose metabolism in Nordic and South Asian subjects with type 2 diabetes. PLoS One. 2013;8(12):e83983.
- Gulseth HL, Wium C, Angel K, et al. Effects of vitamin D supplementation on insulin sensitivity and insulin secretion in subjects with type 2 diabetes and vitamin D deficiency: a randomized controlled trial. Diabetes Care. 2017;40(7):872–878.
- Wallace TM, Levy JC, Matthews DR. Use and abuse of HOMA modeling. Diabetes Care. 2004;27(6):1487–1495.
- Pacini G. The hyperbolic equilibrium between insulin sensitivity and secretion. Nutrition, metabolism, and cardiovascular diseases. NMCD. 2006;16:S22–S27.
- Ahren B, Pacini G. Importance of quantifying insulin secretion in relation to insulin sensitivity to accurately assess beta cell function in clinical studies. Eur J Endocrinol. 2004;150:97–104.
- Clausen JO, Borch-Johnsen K, Ibsen H, et al. Insulin sensitivity index, acute insulin response, and glucose effectiveness in a population-based sample of 380 young healthy Caucasians. Analysis of the impact of gender, body fat, physical fitness, and life-style factors. J Clin Invest. 1996;98(5):1195–1209.
- Martin BC, Warram JH, Krolewski AS, et al. Role of glucose and insulin resistance in development of type 2 diabetes mellitus: results of a 25-year follow-up study. Lancet. 1992;340(8825):925–929.
- Lillioja S, Mott DM, Spraul M, et al. Insulin resistance and insulin secretory dysfunction as precursors of non-insulin-dependent diabetes mellitus. Prospective studies of Pima Indians. N Engl J Med. 1993;329(27):1988–1992.
- Hollenbeck C, Reaven GM. Variations in insulin-stimulated glucose uptake in healthy individuals with normal glucose tolerance. J Clin Endocrinol Metab. 1987;64(6):1169–1173.
- Allemann Y, Horber FF, Colombo M, et al. Insulin sensitivity and body fat distribution in normotensive offspring of hypertensive parents. Lancet. 1993;341(8841):327–331.
- Osei K, Cottrell DA, Orabella MM. Insulin sensitivity, glucose effectiveness, and body fat distribution pattern in nondiabetic offspring of patients with NIDDM. Diabetes Care. 1991;14(10):890–896.
- Bardet S, Pasqual C, Maugendre D, et al. Inter and intra individual variability of acute insulin response during intravenous glucose tolerance tests. Diabetes Metab. 1989;15(5):224–232.
- Clinical Diabetes Research: Methods and techniques. Chichester: John Wiley & Sons, Ltd; 2007.
- Mari A, Tura A, Pacini G, et al. Relationships between insulin secretion after intravenous and oral glucose administration in subjects with glucose tolerance ranging from normal to overt diabetes. Diabet Med. 2008;25(6):671–677.
- Ahlqvist E, Storm P, Karajamaki A, et al. Novel subgroups of adult-onset diabetes and their association with outcomes: a data-driven cluster analysis of six variables. Lancet Diabetes Endocrinol. 2018;6:361–369.
- Zaharia OP, Strassburger K, Strom A, et al. Risk of diabetes-associated diseases in subgroups of patients with recent-onset diabetes: a 5-year follow-up study. Lancet Diabetes Endocrinol. 2019;7:684–694.
- Stidsen JV, Henriksen JE, Olsen MH, et al. Pathophysiology-based phenotyping in type 2 diabetes: a clinical classification tool. Diabetes Metab Res Rev. 2018;34(5):e3005.