
Abstract
Homocysteine, a risk factor for cardiovascular disease, is commonly analyzed using enzymatic measurements and immunoassays. We compared the results of a new enzymatic assay with those of an immunoassay, using new reagents for homocysteine. The 87 serum samples were analyzed using the Abbott Architect i2000sr (immunoassay) and Toshiba TBA-c16000 (enzymatic assay), and the results obtained from the two assays were compared for precision, correlation, linearity, sample carryover, and reference range verification according to the Clinical and Laboratory Standards Institute guidelines. Repeatability and total imprecision were within the desirable range (Westgard QC, 4.15%). Correlation analysis revealed a strong correlation with a slope ranging from 0.9887 to 1.052, a correlation coefficient (R2) of 0.9886 [95% confidence interval (CI) of 0.9899–0.9968], and a y-intercept from −0.5741 to 0.6252. Linearity was acceptable (R2 = 0.9993), and the recovery rate was within ±10% of the expected value. The enzymatic assay showed an acceptable carryover rate (−0.15%) and a shorter turnaround time (10–12 min) compared with that of the immunoassay (30 min). Our new enzymatic assay for the measurement of homocysteine showed an acceptable performance in terms of precision, correlation, linearity, carryover test, cost-effectiveness, and speed.
Introduction
Homocysteine (Hcy), discovered in 1932, was named so owing to its chemical similarity with cysteine [Citation1]. Hcy is a sulfur-containing amino acid produced by the intracellular demethylation of methionine. It is an unstable intermediate of methionine metabolism and normally does not accumulate in the blood. Metabolism of methionine and Hcy requires cofactors such as folic acid, vitamin B-6, and vitamin B-12. Hcy can undergo remethylation through a vitamin B-12-dependent reaction carried out by methionine synthetase to form methionine, or can be metabolized to cysteine via a vitamin B-6-dependent transsulfuration pathway. Folic acid affects Hcy levels by remethylation of Hcy to methionine via methionine synthetase using vitamin B-12 as a cofactor [Citation2]. Accordingly, a deficiency of folic acid, vitamin B-6, or vitamin B-12 may lead to impaired Hcy metabolism, resulting in elevated Hcy levels in the plasma or serum [Citation3].
Deficiency of folic acid and vitamin B-12 causes various health problems in all age groups and lead to medical burden of morbidity; megaloblastic anemia and neurologic complications are classic examples of such adverse consequences. Since these deficiencies can be prevented by diet modification, an accurate and timely assessment of folic acid and vitamin B-12 status is of paramount importance [Citation4]. Increased circulating levels of Hcy is one of the well-established indicators of such deficiencies.
Since the publication of the influential study by Kilmer McCully on young individuals with hyperhomocysteinemia presenting progressive fatal arterial disease [Citation5], Hcy has been considered to be a marker for cardiovascular disease (CVD), as an increase in the Hcy levels is linked to endothelial cell damage and reduced flexibility of blood vessels [Citation1]. However, whether the elevated Hcy is a consequence of CVD or a causative factor is a subject of debate [Citation6], and there is insufficient evidence that lowering Hcy levels could reduce the incidence of CVD [Citation7].
While it is uncertain whether Hcy is an indicator or a cause of disease, recent studies revealed other relationships between the elevated Hcy levels and pathological disorders, including neurodegenerative disease, renal dysfunction, cognitive impairments, and defective congenital development [Citation8]. Accordingly, multiple assays using chromatography, enzymatic assays, and immunoassays have been developed for accurate evaluation of Hcy levels and are practiced on automated platforms [Citation9].
In Korea, most commonly used methods by laboratories participating in proficiency surveys are the enzymatic assay (Roche) and the immunoassay (Abbott). Although high-performance liquid chromatography (HPLC) has been considered as the reference method, it has mostly been replaced by enzymatic assays and immunoassays because of several factors, including cost, performance, and speed. Here, we compare the performance of a new enzymatic assay with that of the Abbott immunoassay, which is currently being used in the Korea University Guro Hospital laboratory. To our knowledge, this is the first study describing this new enzymatic assay, with a cost-effective and easy-to-prepare reagent that can be used in various types of chemistry analyzers.
Materials and methods
Samples
A total of 87 stored serum samples were collected from 1 to 31 August 2019. These samples were originally acquired for routine inspection by the outpatient clinic, wards, and the health examination center from which they were collected. The samples were immediately centrifuged, and the Hcy levels were measured using an Architect i2000sr (Abbott Diagnostics, Abbott Park, IL). All samples were anonymized, and the remaining serum was stored at −70 °C until analysis. Two independent Hcy measurements, with a period of about one month between them, were performed using the new enzymatic assay kit with TBA-c16000. This study was approved by the institutional review board of the Korea University Guro Hospital, Seoul, Korea (2018GR0301).
Two Hcy assays
The Hcy assay using the Architect i2000sr is a one-step chemiluminescent microparticle immunoassay (CMIA) for the quantitative determination of Hcy levels in serum or plasma. The protein-bound Hcy i reduced to its free form by dithiothreitol (DTT) treatment, followed by conversion of Hcy into S-adenosyl Hcy (SAH) using the recombinant enzyme S-adenosyl Hcy hydrolase (rSAHHase) in the presence of adenosine. The produced SAH competes with acridinium-labeled S-adenosyl cysteine for a particle-bound monoclonal antibody. Chemiluminescence is measured as relative light units (RLUs) by Architect optics after washing, magnetic separation, and addition of pre-trigger and trigger solutions. The obtained RLUs are indirectly related to the concentration of Hcy in the sample. The measurement range was 1.00–50.00 µmol/L.
The remaining serum samples were evaluated on a TBA-c16000 (Toshiba, Tokyo, Japan) with a new spectrophotometric enzymatic assay kit (BSBE, Beijing Strong Biotechnologies, Inc., Beijing, China). This assay is based on the measurement of a co-substrate conversion product (a molecule that is not a substrate of the Hcy conversion enzyme, and does not contain any element from Hcy in the sample) instead of the co-substrate or the Hcy conversion products. In this assay, oxidized Hcy is reduced to free Hcy, which then reacts with the co-substrate and S-adenosylmethionine (SAM) in a reaction, catalyzed by Hcy S-methyltransferase to form methionine and SAH. SAH reacts with SAH hydrolase, adenosine deaminase, and glutamate dehydrogenase, and is hydrolyzed to adenosine and Hcy by SAH hydrolase. Hcy produced from the co-substrate SAM is cycled back into the Hcy conversion reaction by Hcy S-methyltransferase. This creates a co-substrate conversion product-based enzyme cycling reaction system with significant amplification of the detection signal. Adenosine is immediately hydrolyzed into inosine and ammonia, which react with glutamate dehydrogenase and concomitantly convert NADH to NAD+. The concentration of Hcy in the sample is indirectly proportional to the amount of NADH converted to NAD+ (A340 nm). The measurement range of this assay was 1.50–50.00 μmol/L.
Study design
Performance evaluation was carried out according to the Clinical and Laboratory Standards Institute (CLSI) guidelines in terms of precision, correlation, linearity, sample carryover, and reference range verification. Repeatability (within-run precision) and total imprecision were calculated as the coefficient of variation (CV), according to the CLSI guideline EP05-A3 [Citation10] with five runs per day, every 4 h for low and high concentrations of QC materials (level 1, low, level 2, high) for 5 days. The Architect immunoassay used QC materials with three different concentrations. The CLSI guideline EP09-A3 [Citation11] was used for correlation studies, and a regression equation was obtained by Passing–Bablok analysis. The difference in values between the two assays was represented as a graph using the Bland–Altman plot. To validate the linearity and recovery, single samples with a high (H) and low (L) Hcy concentration, respectively, were serially diluted to yield samples with concentrations of 0%, 25%, 50%, 75%, and 100% of the initial concentration [Citation12]. All measurements were performed in duplicate. The measurement range of the BSBE assay varied from 1.5–50 µmol/L, and the acceptable recovery range was between 90% and 110%, with a slope R value of more than 0.975. The carryover verification tests using patient samples with L and H Hcy concentrations were sequentially performed by measuring the Hcy concentrations in the order H1, H2, H3, H4, L1, L2, L3, and L4. The percent carryover (%) were calculated using the following equation: (L1 − [L3 + L4]/2) × 100/([H2 + H3]/2 − [L3 + L4]/2). The acceptability criteria for the carryover test were less than 1% [Citation13]. For reference interval validation, a total of 30 samples from the health examination center were used assuming that they were obtained from healthy individuals. As per the CLSI guideline C28-AC, the assay may be adopted for use if no more than 2 out of 20 samples fall out of the range of the existing reference intervals [Citation14]. The data for accuracy and interference testing were available from the insert provided by the manufacturer. The interference study was performed by testing a serum sample with various concentrations of possible interfering substances. Accuracy testing used two different levels of Hcy control (control 1: 12.3 μmol/L, control 2: 31.5 μmol/L) and Standard Reference Material (SRM) 1955, formulated by the National Institute of Standards and Technology (NIST) (8.5 μmol/L), which were measured three times in a row. The substances tested for interference studies were blood ammonia, sodium phosphate (NaPi), sodium fluoride (NaF), triglyceride, ascorbic acid, direct bilirubin, hemoglobin, glutathione, L-cysteine, S-adenosylmethionine (SAM), adenosine, cystathionine, and heparin. LaboStats version 1.5. (Laboratory Medicine Foundation, Seoul, Korea) was used to calculate precision, and GraphPad Prism 8 (GraphPad Software Inc., La Jolla, CA) was used in correlation/linearity analysis with figure.
Results
Precision of the BSBE assay and the Architect immunoassay
The repeatability (within-run precision) and total imprecision of both assays are summarized in . For low and high QC materials, the repeatability was 3.00% and 1.50%, and the total imprecision was 3.20% and 1.60%, respectively, in BSBE enzymatic assay. The Architect immunoassay was the least precise for the detection of low concentrations (level 1) with a CV of 5.40%. The desirable precision of Hcy according to Westgard QC, was 4.15% [Citation15].
Table 1. Precisions of Hcy assays.
Correlation with the Architect immunoassay
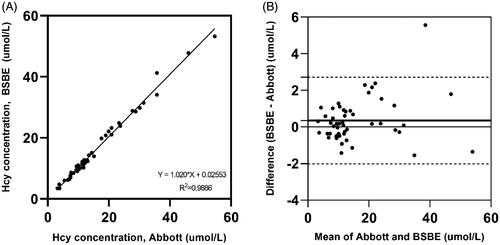
The results of the correlation analysis between the Architect immunoassay and the BSBE enzymatic assay are described in . The values derived from the Architect immunoassay and the BSBE enzymatic assay showed a strong correlation with a slope ranging from 0.9887 to 1.052, a correlation coefficient of 0.9886 [95% confidence interval (CI) of 0.9899–0.9968], and a y-intercept from −0.5741 to 0.6252. The mean difference between the immunoassay and enzymatic assay was 0.3436 µmol/L, with a 95% CI of −4.013 to 4.700. No significant systematic bias was observed in the Bland–Altman plot () showing the difference between the Architect immunoassay and the BSBE enzymatic assay (bias: 0.3436 µmol/L, 95% limits of agreement: −2.022 to 2.709 µmol/L). The bias of one sample, however, was beyond the limits of agreement lines; the Hcy concentration was 35.73 μmol/L according to the Architect immunoassay, and it was 41.29 µmol/L according to the BSBE enzymatic assay.
Figure 1. Comparison of Architect immunoassay and BSBE enzymatic assay by Passing–Bablok regression analysis (A) and Bland–Altman analysis (B).
Linearity and recovery
The linearity and recovery rate at five different concentrations are presented in and . The linearity was acceptable (R2 = 0.9993), and the recovery rate was within ±10% of the expected value.
Figure 2. Linearity test on five different levels of Hcy were measure by BSBE enzymatic assay. The linearity of the assay was 0.5–53.3 µmol/L.
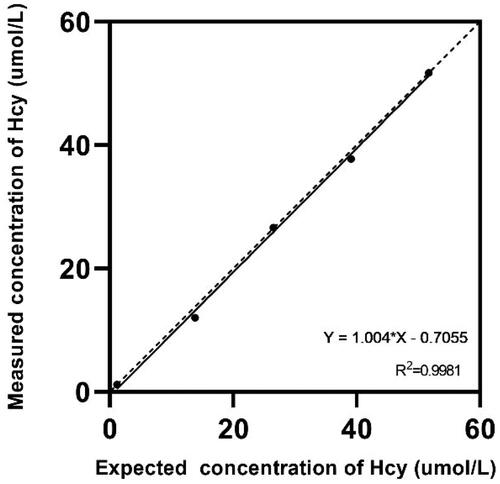
Table 2. Recovery rate.
Carryover
The carryover verification test showed an acceptable rate of −0.15%, within the range of ±1%.
Reference interval
The Hcy concentrations of all 30 samples measured by the BSBE enzymatic assay were within the reference interval provided by the manufacturer (0–15 μmol/L), so the reference interval could be adopted.
Turnaround time
While the Architect immunoassay requires approximately 30 min per test to compute the results, the new enzymatic assay takes only 10–12 min when performed using common chemistry analyzers.
Accuracy and interference testing
The relative bias of each test value was less than 10% in accuracy testing, and the results are summarized in . In the interference testing, when the blood ammonia level was <500 μmol/dL, NaPi <1 mmol/L, NaF <1 mmol/L, triglyceride <2500 mg/dL, ascorbic acid < l0 mmol/L, direct bilirubin <20 mg/dL, hemoglobin <1200 mg/dL, glutathione <0.5 mmol/L, L-Cysteine <1 mmol/L, SAM < 20 μmol/L, adenosine < l00 μmol/L, cystathionine <20 μmol/L, and heparin < l00 u/mL, the recovery ratio met the requirements (< ±10%).
Table 3. Accuracy test results from the insert provided by the manufacturer.
Discussion
While Hcy is mainly found in a protein-bound form in circulation, a small fraction is present in free or mixed cysteine–Hcy disulfide forms. The total Hcy (tHcy) measured in clinical laboratories is indicative of the sum of the concentrations of all three forms [Citation16]. Various methods have been developed to measure tHcy, most of which rely on liquid chromatography (LC) techniques such as HPLC. The development of LC with tandem mass spectrometry (LC-MS-MS) has given rise to HPLC with MS or gas-LC (GLC) methods. These assays are considered as reference methods and are useful for the standardization of tHcy measurements, owing to their high selectivity for Hcy and high precision. Nevertheless, these methods have drawbacks, such as the need for expensive specialized equipment, making their use in hospital laboratories challenging and impractical.
Prior to the development of mouse monoclonal antibodies, immunoassays were not the mainstream detection methods for Hcy analysis. Frantzen et al. introduced the technique of employing a monoclonal mouse anti-SAH antibody to measure the amount of SAH in a competitive enzyme immunoassay [Citation17]. Without the use of radioisotopes and tedious chromatographic separation, this method allowed the development of an automated platform for Hcy analysis. The precision and correlation values of HPLC were acceptable. In addition, a fluorescence polarization immunoassay has been developed [Citation18] and can be performed using an Abbott IMX analyzer (Abbott Park, IL). These methods facilitated the commercialization of Hcy assays, as most clinical laboratories have such equipment necessary to perform immunoassays. The use of a monoclonal antibody is the key to immunoassays, but it is also responsible for a major limitation of immunoassays due to additional antibody interactions in serum from patients receiving human anti-mouse antibody therapy or in those with heterophilic antibodies [Citation19,Citation20].
At present, an average of more than 300 samples per month are referred to our laboratory for Hcy measurement. While most tests are ordered from different wards, approximately a third of them are from the health examination center. Hcy, recently termed as ‘the next (bad) cholesterol’, is gaining attention in Korea for its association with cardiovascular diseases such as stroke and myocardial infarction. However, the controversy about the role of Hcy as a real risk factor for CVD is still ongoing. According to a recent meta-analysis, methylenetetrahydrofolate reductase (MTHFR) gene variants with moderate hyperhomocysteinemia have little to no effect on CHD when unpublished data sets were analyzed, which is indicative of publication bias [Citation21]. Another meta-analysis study also revealed that folic acid supplementation for lowering Hcy levels had insignificant effects on the risk of CVD [Citation22]. In contrast, the relationship between Hcy and vascular calcification in a multi‐ethnic study of atherosclerosis (MESA) cohort was examined in a recently published paper. This analysis confirmed the association between elevated Hcy levels and vascular calcification, and concluded that Hcy is a biomarker for both coronary and extra-coronary vascular calcification incidence and progression [Citation23]. There is room for controversy, but Hcy appears to be a valuable biomarker. Although Hcy measurement is not currently recommended in the routine screening of the general population, the American Association for Clinical Chemistry presented three clinical settings for screening regimens, which are follows: assessment as a risk factor for CVD, diagnosis of homocystinuria, and identification of folate or cobalamin (vitamin B12) deficiency [Citation24].
As the number of Hcy measurements is expected to increase, the development of rapid and cost-effective methods is imperative. A potential method is the use of enzymatic assays incorporating photometric measurements. In the enzymatic cycling method analyzed in this study, the produced Hcy from the co-substrate SAM is cycled back into the Hcy conversion reaction. Such enzymatic assays are more cost-effective, faster, and easier to perform than immunoassays. Moreover, they use fewer reagents and do not require sample pretreatment, special equipment, or trained operators. Apart from the BSBE enzymatic assay, there are other commercially available Hcy assays based on the enzymatic cycling method. However, the BSBE assay is advantageous because it uses an easy-to-prepare reagent with an openly available formula and can be performed using common automated clinical chemistry analyzers.
In this study, we evaluated the overall analytic performance of the BSBE enzymatic assay by investigating its precision, correlation, linearity with recovery, and carryover. The precision evaluation revealed a repeatability of 3.00% at a low level and 1.50% at a high level with a total imprecision of 3.20% and 1.60%, respectively. The comparison study showed a very strong correlation between this assay and the Abbott immunoassay (R2 = 0.9886). No significant positive or negative bias was observed in the Bland–Altman plot (mean bias: 0.3436 µmol/L). In addition, linearity (R2 = 0.9993) in clinically relevant range (0–15 µmol/L), and the recovery rate were also acceptable.
Our study has some limitations. Although the performance of the immunoassay was reported to be comparable to that of the HPLC method, we could not perform HPLC analysis in this study. According to the 2019 proficiency survey of Hcy with 180 participants, the majority of clinical laboratories in Korea use immunoassays (39/180 [27.7%], Abbott) and enzymatic assays (43/180 [23.9%], Roche; 33/180 [18.3%], Beckman Coulter Inc., Brea, CA). Hence, it is more meaningful to investigate the performance of an enzymatic assay as compared to the widely used immunoassay. Second, as this was a retrospective study, there was a time difference between the measurements performed using the two assays. The test using the BSBE assay kit was performed one month after the immunoassay. Hence, the delayed measurement may have affected the BSBE assay results; for example, the one outlier shown in the Bland-Altman plot could have been obtained for this reason. Third, the small number of samples in the high concentration group (above the upper limit of reference interval) is likely to be insufficient to detect a statistically significant difference. Further studies are needed to determine the possible presence of systematic errors in the high concentration group.
In conclusion, the new enzymatic assay showed acceptable performance in terms of precision, correlation, linearity, and carryover according to the CLSI guidelines. This assay is advantageous because it is accurate, rapid, flexible, and cost-effective; it can be applied under various laboratory conditions.
Disclosure statement
The authors declare that there are no conflicts of interest regarding the publication of this paper.
Additional information
Funding
References
- Ganguly P, Alam SF. Role of homocysteine in the development of cardiovascular disease. Nutr J. 2015;14:6.
- Krebs MO, Bellon A, Mainguy G, et al. One-carbon metabolism and schizophrenia: current challenges and future directions. Trends Mol Med. 2009;15(12):562–570.
- Rifai N, Horvath AR. Tietz textbook of clinical chemistry and molecular diagnostics. St. Louis, MO: Elsevier; 2018.
- Green R. Indicators for assessing folate and vitamin B-12 status and for monitoring the efficacy of intervention strategies. Am J Clin Nutr. 2011;94(2):666S–672S.
- McCully KS. Vascular pathology of homocysteinemia: implications for the pathogenesis of arteriosclerosis. Am J Pathol. 1969;56(1):111–128.
- Kumar A, Palfrey HA, Pathak R, et al. The metabolism and significance of homocysteine in nutrition and health. Nutr Metab (Lond). 2017;14:78.
- Chrysant SG, Chrysant GS. The current status of homocysteine as a risk factor for cardiovascular disease: a mini review. Expert Rev Cardiovasc Ther. 2018;16(8):559–565.
- Azzini E, Ruggeri S, Polito A. Homocysteine: its possible emerging role in at-risk population groups. Int J Mol Sci. 2020;21:1421.
- La'ulu SL, Rawlins ML, Pfeiffer CM, et al. Performance characteristics of six homocysteine assays. Am J Clin Pathol. 2008;130(6):969–975.
- CLSI. Evaluation of Precision of Quantitative Measurement Procedures; Approved Guideline‐Third Edition. CLSI document EP05‐A3. 2014.
- CLSI. Measurement procedure comparison and bias estimation using patient samples; Approved guideline-Third Edition. CLSI document EP09-A3. 2013.
- CLSI. Evaluation of the linearity of quantitative measurement procedures: a statistical approach. Approved Guideline. CLSI document EP06-A. 2003.
- CLSI. Preliminary Evaluation of Quantitative Clinical Laboratory Measurement Procedures; Approved Guideline-Third Edition. CLSI document EP10‐A3. 2006.
- CLSI. Establishing, and verifying reference intervals in the clinical laboratory. Approved Guidline-Third Edition. CLSI Document C28-A3. Pennsylvania, PA: CLSI; 2008.
- Wf J. Westgard QC. [cited 2020 Feb 20]. Available from: http://www.westgard.com/biodatabase1.htm.
- Ubbink JB. Assay methods for the measurement of total homocyst(e)ine in plasma. Semin Thromb Hemost. 2000;26(3):233–241.
- Frantzen F, Faaren AL, Alfheim I, et al. Enzyme conversion immunoassay for determining total homocysteine in plasma or serum. Clin Chem. 1998;44(2):311–316.
- Shipchandler MT, Moore EG. Rapid, fully automated measurement of plasma homocyst(e)ine with the Abbott IMx analyzer. Clin Chem. 1995;41(7):991–994.
- Price T, Beatty BG, Beatty JD, et al. Human anti-murine antibody interference in measurement of carcinoembryonic antigen assessed with a double-antibody enzyme immunoassay. Clin Chem. 1991;37(1):51–57.
- Boscato LM, Stuart MC. Heterophilic antibodies: a problem for all immunoassays. Clin Chem. 1988;34(1):27–33.
- Clarke R, Bennett DA, Parish S, for the MTHFR Studies Collaborative Group, et al. Homocysteine and coronary heart disease: meta-analysis of MTHFR case-control studies, avoiding publication bias. PLoS Med. 2012;9(2):e1001177.
- Li Y, Huang T, Zheng Y, et al. Folic acid supplementation and the risk of cardiovascular diseases: a meta‐analysis of randomized controlled trials. J Am Heart Assoc. 2016;5(8):e003768.
- Karger AB, Steffen BT, Nomura SO, et al. Association between homocysteine and vascular calcification incidence, prevalence, and progression in the MESA Cohort. J Am Heart Assoc. 2020;9(3):e013934.
- Refsum H, Smith AD, Ueland PM, et al. Facts and recommendations about total homocysteine determinations: an expert opinion. Clin Chem. 2004;50(1):3–32.