
 ?Mathematical formulae have been encoded as MathML and are displayed in this HTML version using MathJax in order to improve their display. Uncheck the box to turn MathJax off. This feature requires Javascript. Click on a formula to zoom.
Abstract
Purine metabolism is essential for all known living creatures, including humans in whom elevated serum concentration of purine break-down product uric acid (UA) is probably an independent risk factor for mortality, type 2 diabetes and cardiovascular events. An automated multiplex assay that measures several purine metabolites could therefore prove useful in many areas of medical, veterinary and biological research. The aim of the present work was to develop a sensitive LC-MS/MS method for simultaneous quantitation of xanthine, hypoxanthine, UA, allantoin, and creatinine in biobanked urine samples. This article describes details and performance of the new method studied in 55 samples of human urine. Archival sample preparation and effect of storage conditions on stability of the analytes are addressed. The intra-day and inter-day coefficients of variation were small for all the analytes, not exceeding 1% and 10%, respectively. Measurements of UA and creatinine in biobanked urine showed good agreement with values obtained using routine enzymatic assays on fresh urine. Spearman's correlation coefficients were 0.869 (p < .001) for creatinine and 0.964 (p < .001) for UA. Conclusion: the newly developed LC-MS/MS method allows reliable quantitative assessment of xanthine, hypoxanthine, allantoin, UA and creatinine. The proposed pre-analytical processing makes the method suitable for both fresh and biobanked urine stored frozen at −80 °C for at least 5.5 years.
Introduction
Assays that allow simultaneous determination of several substances in biological fluids are useful tools in medical and veterinary research. Such assays are particularly advantageous when location of enzymatic error along a pathway can be deducted from relative abundances of precursors and reaction products. Multiplexed testing helps overcome problems when freeze-thawing cycles compromise measurability of analytes, and when access to sample, time or resources are limited which is almost always true for academic research.
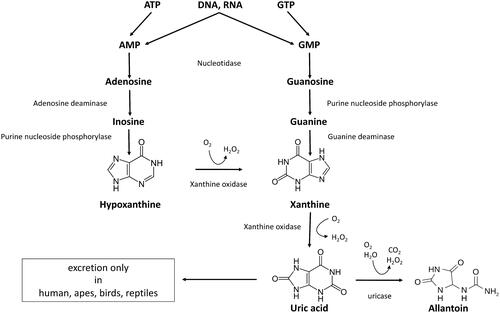
Purine metabolism is essential for all known terran creatures defined as living (within the current materialistic life science paradigm) [Citation1], which also includes non-cellular forms, such as viruses and viroids, but excludes prions. Therefore an assay determining several key metabolites in purine pathway could find an application in many areas of biology, particularly medicine. Uric acid (UA) is the break-down product of purines from DNA, RNA and nucleotides, such as GTP, cGMP, ATP, cAMP, NADH and coenzyme A. During purine catabolism, adenosine, inosine and guanine are converted to UA via precursors xanthine and hypoxanthine (). UA can be further hydrolyzed by the enzyme uricase to a highly soluble excretory product allantoin in all mammals except humans and higher apes. Allantoin can still be measured in the circulation of humans where it is believed to represent a non-enzymatic oxidation product of UA which renders it a marker of oxidative stress and ageing [Citation2].
Figure 1. Diagram of purine degradation pathway.
Hyperuricemia is a modifiable condition that can lead to gout, and may be an independent risk factor for mortality [Citation3], cardiovascular events [Citation4–7], hypertension [Citation8,Citation9], renal disease [Citation10,Citation11], cancer [Citation12,Citation13], and diabetes [Citation14]. Hyperuricemia is also a common problem after solid organ transplantation [Citation15,Citation16]. It is not known if UA is just a marker of these diseases or a true risk factor for upcoming clinical events. Relative abundance of purine metabolites up- and downstream of UA combined with measure of UA itself could help uncover the exact mechanism behind hyperuricemia and be a better predictor for UA-associated risks than serum UA alone. Longitudinal association between purine levels and risk of developing type 2 diabetes has recently been shown [Citation17]. Xanthine, hypoxanthine and uric acid were proposed as biomarker of neonatal hypoxia [Citation18]. The concentration of hypoxanthine is independently associated with BMI and smoking habit [Citation19].
Measurements of UA in serum and urine are offered routinely by the majority of clinical chemistry laboratories as a step in the diagnostic workup of gout and kidney stones. The assays are typically based on either colorimetric or enzymatic methodology. They offer different advantages, but both are subject to interference and require fresh samples due to poor analyte stability [Citation20], particularly following freezing [Citation21], which aggravates low solubility of UA in biological fluids. Assays of xanthine and hypoxanthine are used in the diagnostic workup of a number of inborn errors of metabolism; however, due to low prevalence of such conditions, these tests are only performed by few specialized laboratories.
Creatinine is a metabolite of creatine phosphate which is released to the circulation from muscles at a steady rate and is excreted by kidneys in an unchanged form and thus is an indication of the urine concentration. This property of creatinine allows its measurement to be used to correct for urine concentration when measuring other metabolites in a random urine sample. Measurements done in urine collected over a period of 24 h do not require creatinine normalization, but because such samples are tedious and impractical to collect, using first void or spot urine is considerably more common in routine clinical practice and research.
Liquid chromatography (LC)–tandem mass spectrometry (MS/MS) can be the method of choice for a multiplex purine-creatinine assay as it provides outstanding specificity and dynamic range. Because of their high polarity, purines exhibit poor retention on reversed-phase columns [Citation22,Citation23]. Hydrophilic interaction liquid chromatography (HILIC) appears to be promising for separation of polar compounds [Citation24–27] including purines [Citation28–30]. Zwitterionic hydrophilic interaction (ZIC)-HILIC-MS/MS method for quantification of purines and creatinine in cow’s urine has been published [Citation22]. However, quantitation of creatinine, allantoin and UA by this method requires different degrees of sample dilution compared to xanthine and hypoxanthine, therefore, not all the analytes have been assessed simultaneously [Citation22]. Published ZIC-HILIC-MS method for metabolomic profiling of Drosophila extracts does allow measurement of allantoin, UA, xanthine and hypoxanthine in one run, but not creatinine [Citation30,Citation31]. This, unfortunately, does not allow for measurement of metabolites corrected for creatinine concentrations in the same assay. Matrix effects in urine would probably be very different from the extracts of Drosophilas’ bodies.
The aim of the present work was to develop a specific and sensitive automated assay that allows simultaneous quantitation of xanthine, hypoxanthine, UA, allantoin and creatinine in biobanked urine samples. To the best of our knowledge, no such method has been developed so far.
Materials and methods
LC-MS/MS: LC-MS/MS was performed on ACQUITY UPLC (Waters, Milford, MA) with SeQuant ZIC-HILIC, 150 × 2.1 mm, 3.5 μm, 100 Å analytical column (Merck, Kenilworth, NJ) and Xevo TQ-XS (Waters, Milford, MA) equipped with electrospray ionization source. Column oven was set to 40 °C and an autosampler to 20 °C. The injection volume was 1 µl. Elution was performed using mobile phases A (20 mM Ammonium acetate buffer pH 5) and B (100% acetonitrile (ACN)). Chromatographic and MS parameters are described in .
Table 1. Chromatographic conditions.
Table 2. Specific mass spectrometric parameters and retention times (RT) for the analytes and internal standards (IS).
Table 3. General mass spectrometric parameters.
The column was equilibrated with one gradient run with four successive urine sample injections then one normal run with one injection before injecting the first study sample. All analytes were quantified by multiple reaction monitoring (MRM) with IS using negative electrospray ionization mode. MS/MS fragmentations using various collision energies and cone voltages were evaluated to determine optimal conditions (). Data acquisition and analyses were performed with MassLynx v4.2 (Waters, Milford, MA) and Skyline 20.1 (MacCoss Lab Software), respectively.
Chemicals
UA, hypoxanthine, xanthine, creatinine, allantoin, urea, NaCl, KH2PO4, K2HPO4X3H2O, MgSO4X7H2O, KOH and LiOH were purchased from Sigma-Aldrich (St. Louis, MO). K2SO4, acetic acid, ammonium acetate, ACN and LC glass vials were purchased from VWR International, Oslo, Norway. All solvents and chemicals were of HPLC grade or higher.
Isotope-labelled IS
1,3-15N2-UA and 13C5-Hypoxanthine were from Cambridge Isotop Laboratories Inc., Tewksbury, MA. 13C,15N2-Xanthine was from Chemtos, Round Rock, TX. 13C2,15N4-allantoin was from Toronto Research Chemicals, Toronto Canada, D3-Creatinine (methyl-d3) was from C/D/N Isotopes Inc., Toronto, Canada
Solutions
Allantoin and 13C2,15N4-allantoin were dissolved in water to 2561 µM and 121.9 µM, respectively. Xanthine and 13C15N2-xanthine were dissolved in 0.66 mM KOH to 300 µM both. Hypoxanthine and 13C5-hypoxanthine were dissolved in water to 2200 µM and 708.8 µM, respectively. Creatinine and D3-creatinine were dissolved in water to 706,825 µM and 43,040 µM, respectively. UA was dissolved in 14 mM LiOH to 7000 µM and 1,3-15N2-UA was dissolved in 6.2 mM KOH to 3000 µM. All stock solutions were aliquoted and stored at −80 °C.
IS and calibrators mixtures were prepared by mixing stock solutions to yield concentrations given in . Sample diluent was prepared by mixing 10.5 volumes of water with 1 volume of IS mixture.
Table 4. Concentration of labeled standards in the IS mixture and non-labeled standards in the calibrators’ mixture.
Study samples
First void morning urine from participants of cross-sectional PURIKOTA study (n = 55) was used for method validation.
The study was approved by the Regional Committee for Medical and Health Research Ethics, Norway (REK 2015/1790). All participants have signed written informed consent. All methods were performed in accordance with the relevant guidelines and regulations.
Urine was aliquoted and one fresh sample from each participant was sent to Clinical Chemistry laboratory for measurement of UA and creatinine with routine assays. The rest were frozen and stored at −80 °C for 3 years before analysis.
Quality controls (QC)
Over-concentrated, UA-enriched urine was collected from a healthy volunteer who had been on a high purine diet (daily red meat, liver, ground offal, and alcohol-free beer ad libitum for 3 days). The day before urine collection, the volunteer abstained from drinking water from 16:00. First-void urine was collected next morning and mixed with first-void urine known to have high levels of xanthine and hypoxanthine (accidental finding in PURIKOTA study during a pilot experiment) in proportion 30–70% respectively. The mixture was aliquoted and stored at −80 °C until being used as high-QC.
Low-concentrated, low purines urine was collected from a healthy volunteer who had been avoiding purine-rich foods for 3 days. Water intake was not limited. The night before urine collection, the volunteer drank an extra glass of water. First-void urine was collected next morning, aliquoted and stored at −80 °C until being used as low-QC samples. Each QC aliquot was used only once.
Sample processing
Frozen urine samples were thawed at room temperature. Following vigorous vortexing (10 s), 50 µl of each sample were immediately transferred to a new vial and heated at +40 °C for 15 min in dry block heaters. Aliquots were then vortexed again, and 22 µl were transferred to a new vial and mixed with 242 µl of sample diluent preheated to +40 °C (see Discussion) to achieve 12× dilution and simultaneous spiking with IS at the following final concentrations: 2.1 µM 13C5-hypoxanthine; 1.3 µM 13C,15N2-xanthine; 483.5 µM D3-creatinine; 3.7 µM 13C2,15N4-allantoin; 91.7 µM 1,3-15N2-UA. Spiked samples were centrifuged for 10 min at 16,000×g and 200 µl supernatants were transferred to a new vial followed by mixing with 200 µl of 100% ACN. Sample/ACN mixtures were incubated at room temperature for 30 min, centrifuged for 10 min at 16,000×g and 200 µl of supernatant were transferred to LC glass vials and sealed with screw caps.
Calibration curve
Concentration of purines and creatinine was determined against a calibration curve. Artificial urine (AU) prepared according to a recipe developed at Oslo University Hospital was used as a matrix for calibrators. AU stock solution was prepared 4× concentrated () and added to calibration standards to yield final salts and urea concentrations mimicking 12× diluted human urine to match dilution of the study samples. The calibration standards were prepared by diluting calibrators mixture () in AU, followed by 9 subsequent serial 1:2 dilutions in AU. IS mixture was added to each of the 10 resulting calibration standards to yield the same final concentration as in the urine samples. Calibration standards were then mixed with 100% ACN in proportion 50/50 (V/V), incubated at room temperature for 30 min, and centrifuged for 10 min at 16,000×g before injection to the column. The calibration curves were derived from the peak area ratio of the primary MRM transition for calibrator to that of corresponding IS and plotted as concentration of calibrators (x-axis) versus peak areas ratio (y-axis). The concentrations of calibrators were chosen to cover the expected concentrations ranges in 12× diluted urine samples.
Table 5. Composition of four times concentrated AU.
Selectivity
AU spiked with calibrators, AU spiked with IS and non-spiked urine were analyzed to evaluate the method for selectivity.
Matrix effects
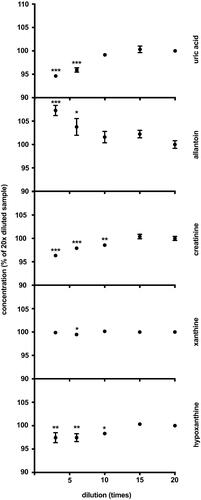
Matrix effects were tested in quadruplicates of over-concentrated urine diluted 3×–20× with diluent containing water and internal standards. Obtained concentrations were multiplied by the corresponding dilution factor and normalized to the average concentration of 20× diluted sample taken as 100% ().
Figure 2. Matrix effects. The results are quadruplicates of different dilutions of over-concentrated urine samples. Obtained concentrations were multiplied by the corresponding dilution factor and normalized to the average concentration of 20× diluted sample taken as 100% The dots and whiskers represent mean ± SD. Stars above the dots represent significant mean difference at p-levels: * < 0.05, ** < 0.001, *** < 0.0001.
Precision
The precision of the method was determined by calculating the intra-day and inter-day variability coefficients (CV%) for all analytes. The inter-day CV% was calculated based on the results of analyses of two QC samples. The same high and low QC samples were run in quadruplicate on 7–8 consecutive days. The daily means for high and low QC were used to calculate the overall mean, standard deviation (SD), and CV%. . The intra-day CV% was calculated based on all measurements accomplished on the same day. The CV% for each sample is calculated as
The average of the individual CV%s on a given day is reported as intra-assay CV%.
Freeze-thaw stability
Over-concentrated urine samples were subjected to one, three and six complete freeze-thaw cycles (thawing at room temperature and freezing at −80 °C). Samples were analyzed in quadruplicates. The first freeze-thaw cycle was taken as 100%.
Storage stability
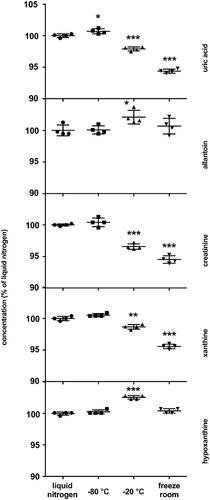
At the beginning of the project, first void morning urine from a healthy volunteer was collected, and aliquots were placed for storage under the following conditions: liquid nitrogen (−196 °C), −80 °C freezer, −20 °C freezer, and freezer room. The temperature in the freezer room is set to −20 °C but is subject to frequent rises. After 5.5 years the samples were analyzed as described above. The concentration of sample stored in liquid nitrogen was taken as 100% ().
Figure 3. Storage stability. The results are quadruplicates of urine aliquots stored at different conditions for 5.5 years. The dots and whiskers represent mean ± SD. Stars above the dots represent significant mean differences at p-levels: * < 0.05, ** < 0.0003, *** < 0.0001.
Comparison of analytical methods
Measurement of UA and creatinine in fresh first void morning urine samples collected at the study baseline was performed at the routine laboratory of the University Hospital of North Norway using enzymatic colorimetric assay and enzymatic assay respectively on Cobas 8000 instrument (Roche, Basel, Switzerland). These assays served as reference tests for our LC-MS/MS assay.
Measurement of UA and creatinine in thawed aliquots of the same urine samples stored at −80 °C for 3 years was performed using LC-MS/MS method (index test) as described above. Fifty-one samples from different participants were available for analyses of creatinine and 46 for UA. Three creatinine and eight UA samples were excluded from the comparison due to unavailability of data for the reference test at baseline.
Statistics
Statistical analyses were performed using IBM SPSS Statistics 26 (IBM, Armonk, NY). Group comparisons were done using one-way ANOVA and Dunnett’s post hoc test. The agreement between methods was assessed using the Bland–Altman plot [Citation32] and the Passing–Bablok method [Citation33] built with Excel (Microsoft Corporation, Redmond, MA).
Results
Calibration curve
The curves were linear over at least the following concentration ranges: 0.02–11.7 μM for hypoxanthine (r2=0.99993); 0.04–18.0 μM for xanthine (r2=0.99996); 5.7–2924 μM for creatinine (r2=0.99934); 0.05–28.1 μM for allantoin (r2=0.99980); 0.94–481.5 μM for UA (r2=0.99993).
Urine samples
First void morning urine from 55 individuals was used for method validation. The median age was 54 years, (range: 18–80), 61.8% were females, and 18.2% had reduced kidney function (eGFR < 60 ml/min/1.73 m2).
The typical LC–MS/MS chromatograms of four purines and creatinine in human urine are shown in . The retention time was very stable for all the purines. Creatinine showed very slow retention time drift (−5.4 s over 352 runs), not seen for other analytes. Distribution of concentrations of purines and creatinine in urine obtained with LC-MS/MS method is shown in .
Figure 4. Typical LC–MS/MS chromatograms of four purines and creatinine in human urine. x-axis: retention time (min); y-axis: relative abundance (%).
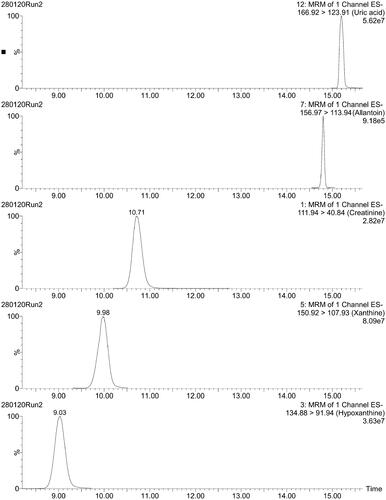
Table 6. Concentration of purine metabolites and creatinine in 1st void morning urine by LC-MS/MS.
Concentrations of all the analytes, either in urine samples or in standard curve were above quantification limit defined as the concentration that yield a peak with signal-to-noise ratio of 10.
Selectivity
No co-eluted interfering peaks for calibrators were detected in AU spiked with IS and vice versa. However, co-eluted interfering peaks for 1,3-15N2-xanthine and 13C2,15N-hypoxanthine were detected in non-spiked urine (data not shown). The problem was solved by switching to 13C,15N2-xanthine and 13C5-hypoxanthine as IS.
Matrix effects
Xanthine concentration remained unchanged over the whole range of urine dilution () indicating no considerable matrix effects. Although there was a difference between dilutions 6 and 20 that reached statistical significance, the difference was only 0.5% and assumed to be of no practical or clinical significance. The concentration of allantoin measured in the least diluted urine was higher than the concentration measured in the most diluted samples, resulting in 7.3% difference. The concentrations of UA, creatinine and hypoxanthine measured in the least diluted samples were lower than the concentrations measured in most diluted samples by 5.7%, 4.1% and 2.9%, respectively. However, the differences observed disappeared in samples diluted 10 times and more ().
Precision
The inter-day variation was small ranging between 0.7% and 4.4% except for allantoin in low QC and creatinine in high QC where CV% of 8.2% and 6.2%, respectively, were observed ().
Table 7. Inter-day variation for QC samples.
The intra-day variation was very small () being below 0.27% for hypoxanthine, 0.28% for xanthine, 0.62% for creatinine, 1.07% for allantoin and 0.63% for UA. Intra-day CV% of less than 10% are generally acceptable.
Table 8. Intra-day variation, CV%.
Intra-day CV% did not vary significantly from day to day and did not correlate with analytes concentration (data not shown).
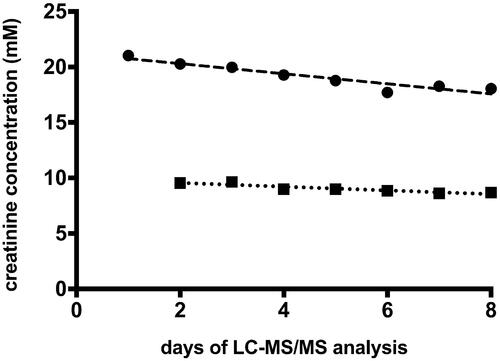
shows a gradual but steady decline in measured creatinine concentration (9% over 7 days for low QC and 14% over 8 days for high QC). Other analytes in QC samples did not show any negative or positive day to day dynamic (data not shown).
Figure 5. Dynamics of changes in creatinine concentration in quality controls (QC) samples. Circles: high QC; squares: low QC; dashed line: linear regression of high QC; R2 = 0.894, slope −0.454 mM/day ± 0.0639 SE; dotted line: linear regression of low QC, R2 = 0.841, slope −0.17 mM/day ± 0.033 SE.
Freeze-thaw stability
Six freeze-thaw cycles did not affect UA levels. At the same time, this treatment induced a small but statistically significant decrease in levels of creatinine (−1.1% after 6 cycles), hypoxanthine (-0.4% and −1.2% after 3 and 6 cycles, respectively) and xanthine (−0.6% and −1.6% after 3 and 6 cycles, respectively). In contrast, levels of allantoin increased by 2.0% and 3.2% after 3 and 6 cycles, respectively ().
Table 9. Freeze-thaw stability.
Storage stability
No difference in analytes’ concentrations was detected between liquid nitrogen and −80 °C storage conditions, except for UA where a tiny but statistically significant rise in concentration (+0.7%) was detected at −80 °C (). Storage in −20 °C freezer resulted in decrease in concentrations of UA, creatinine and xanthine by −2.1%, −3.4% and −1.3%, respectively, and increase in concentrations of allantoin and hypoxanthine by +2.1% and +2.5%, respectively, over 5.5 years. Storage in a freeze room did not affect the concentration of hypoxanthine and allantoin but markedly decreased the concentrations of UA, creatinine and xanthine by −5.6%, −5.5% and −4.4%, respectively, over a period of 5.5 years ().
Stability in autosampler
The concentration of analytes inside sealed LC vials in autosampler did not change for at least 28 h (data not shown).
Comparison of analytical methods
shows distribution of values for urinary creatinine and UA obtained with reference and index tests. Normal ranges for UA and creatinine for the reference tests are 2200–5475 µM [Citation34] and 2.55–24.6 mM [Citation35], respectively. Two study participants had UA values above, 18 within, and 26 below the normal range of the reference assay and 4, 16, and 26, respectively, when analyzed with the LC-MS/MS method. Three study participants had creatinine values above, 48 within, and none below the normal range of the reference assay and 2, 47, and 2, respectively, when analyzed with the LC-MS/MS method.
Table 10. Descriptive statistics for creatinine and UA measured using reference and index assays.
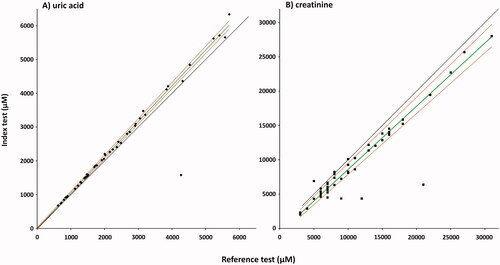
Although the LC-MS/MS method measured consistently lower creatinine in biobanked samples, there was good correlation between the results of the two tests. Spearman's correlation coefficients were 0.869 (p = 1.289E − 16) for creatinine and 0.964 (p = 5.6582E − 27) for UA. Passing-Bablok regression analyses are presented in . For creatinine, the regression equation resulted in an intercept median of −0.620 (95% CI: −0.979 to −0.161) and a slope of 0.921 (95% CI: 0.886–0.964). For UA, the regression equation resulted in an intercept median of −3.539 (95% CI: −28.560 to 24.247) and a slope of 1.057 (95% CI: 1.041–1.074).
Figure 6. Passing–Bablok regression analysis of the two methods for UA (A), and creatinine (B). Index test: LC-MS/MS method; reference test: enzymatic colorimetric assay (A), and enzymatic assay (B); diamonds: UA samples (n = 46); squares: creatinine samples (n = 51); green line: regression line; red lines: 95%CI, black line: y = x. Spearman's correlation coefficients (A) 0.964, (p = 5.6582E-27), intercept median (A) −3.539 (95% CI: −28.560 to 24.247), slope (A) 1.057 (95% CI: 1.041–1.074). Spearman's correlation coefficients (B) 0.869 (p = 1.289E-16), intercept median (B) −0.620 (95% CI: −0.979 to −0.161), slope (B) 0.921 (95% CI: 0.886–0.964).
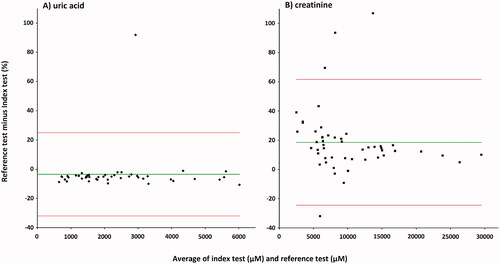
Bland–Altman plots are presented in . The mean bias for UA with respect to the mean of the two methods was −3.5% (1.96 SD, − 32.0 to 25.0%) for the enzymatic colorimetric assay minus LC-MS/MS method (). The deviation from the mean was small over the whole concentration range except for one sample, which showed large upward deviation. The LC-MS/MS method shows slightly higher concentrations compared to enzymatic colorimetric assay. The mean bias for creatinine with respect to the mean of the two methods was 18.6% (1.96 SD, − 24.43 to 61.63%) for the enzymatic assay minus LC-MS/MS method (). The deviation from the mean was moderate except for three samples with large upward deviation and one sample with large downward deviation. The LC-MS/MS method shows lower concentrations compared to enzymatic assay, and this tendency was somewhat more pronounced at low concentrations.
Figure 7. Bland–Altman plot for urinary UA (A), and creatinine (B). Index test: LC-MS/MS method; reference test: enzymatic colorimetric assay (A), and enzymatic assay (B); diamonds: UA samples (n = 46); squares: creatinine samples (n = 51); green line: average delta %; red lines: 1.96SD. The mean bias A: −3.5% (1.96 SD, −32.0 to 25.0%) for the enzymatic colorimetric assay minus LC-MS/MS method; B: 18.6% (1.96 SD, −24.43 to 61.63%) for the enzymatic assay minus LC-MS/MS method.
The CV% of LC-MC/MC method for UA were very similar to the reference assay (). The same coefficients were about two times higher for LC-MC/MC method for creatinine compared to the corresponding reference assay ().
Table 11. Comparison of variation coefficients for UA and creatinine.
Discussion
The present study describes a new method that allows reliable quantification of several purine metabolites and creatinine in 3–5.5 year old biobanked urine samples. The reference method for measuring urinary UA used in our clinical routine demands the use of fresh samples presumably because precipitation of UA makes results unreliable for samples with longer storage time. This represents a serious limitation both for users from remote areas who need to send samples to centralized laboratories for analyses, and for researchers who would like to study UA metabolism in biobanked urine.
Selection of MS instrument
Urinary reference ranges for allantoin are not established yet. To the best of our knowledge, the lowest concentration of allantoin in urine reported was 8 µM in a study with 21 participants [Citation36]. Therefore, in the general population or among diseased subjects, even lower concentrations of allantoin can be expected which would fall below the assay’s quantitation limit. Due to the current gold standard position and the excellent sensitivity of triple quadrupoles, we chose to utilize the low-resolution instruments.
Chromatographic separation
Long runtime is a common disadvantage of HILIC due to the necessity for prolonged extensive re-equilibration. We have optimized the LC protocol in order to decrease the total runtime by using a steep gradient and higher than optimal (0.1 ml/min) flow rate during elution (0.25–0.3 ml/min) as well as high flow rate during re-equilibration (0.5 ml/min). Despite this, the total runtime was still 31 min (), which is quite long compared to a typical reversed-phase chromatography protocol, but not unusual for HILIC.
Analyte recovery
Thawed at room temperature, urine samples may contain sediment. This sediment often consists of or contains UA crystals. Heating urine samples to 40 °C for 15 min is usually sufficient to re-solubilize crystallized UA. However, urine samples with both UA above 4 mM and exceptionally high amount of sediment fail to release all crystallized UA even after prolonged heating (data not shown). We have therefore developed a simple procedure to circumvent this problem: thawed urine samples were vigorously vortexed to form fine suspension in the samples containing sediment followed by a simultaneous heating and dilution. No visible sediment was ever detected after this procedure. Measured UA concentrations were in good accordance with the results obtained by applying reference methods to fresh urine ( and ). All the urine pipetting was done directly after vortexing of each sample to prevent sedimentation of particulate material. Samples without sediment were treated exactly the same way as samples with sediment in order to unify samples’ preparation. This procedure allows simultaneous UA re-solubilization, sample dilution and introduction of IS.
The procedure also improved recovery of xanthine while concentrations of hypoxanthine, allantoin, and creatinine were unchanged presumably due to their good solubility (data not shown). Heating to 40 °C for 15 min did not affect the concentration of the studied analytes. However, heating may affect other analytes in biobanked samples, especially some proteins. Therefore, only 50 µl aliquote of biobanked samples were heated in order to preserve urine for other analyses.
In this study, the volume of processed urine sample significantly exceeded the final volume required for analysis (1 µl). Our attempts to reduce the initial volume of the samples revealed that pipetting of less than 20 µl increased pipetting error. However, we think that scaling down is still possible when dealing with very precious biobanked material, though at the expense of somewhat increasing pipetting error.
Matrix effects
Lower concentrations of UA, creatinine and hypoxanthine measured in the least diluted samples could probably be explained by ions suppression from other components in the urine-matrix (). Higher concentrations of allantoin observed in the least diluted samples could be caused by increased non-enzymatic degradation of UA to allantoin at higher UA concentrations. Nevertheless, this effect was not present at dilutions higher than 10 times, and we chose to dilute all study samples 12 times which allowed us to minimize matrix effects and at the same time reduce the risk to fall under the quantitation limits.
Precision
The method has shown an excellent intra-day precision () and good to acceptable inter-day precision (). Intra-day precision is largely attributed to instrument performance. In the early phase of our project we were using the older model of the same LC-MS instrument, which gave markedly inferior precision and sensitivity compared to the values reported here.
Inter-day variation () for creatinine in high QCs and for allantoin in low QCs was rather high (6.2% and 8.2%, respectively), however, still acceptable since inter-day CV% of less than 15% are generally acceptable [Citation37]. High inter-day CV% often could be explained by inaccurate pipetting. However, it is unlikely to be the cause for moderately high inter-day CV% for creatinine and allantoin as other analytes exhibited quite low inter-day variation.
Despite acceptable level of inter-day variation (), measured creatinine concentration in the QC samples decreased steadily day by day (). This may be at least partially due to the retention time drift of creatinine (−5.4 s over 352 runs) combined with the difference in retention time between creatinine and D3-creatinine (). In general, when the retention time of an analyte is changing, the analyte will experience corresponding changes in the matrix environment and as a result, changes in ion suppression. In our assay, decreasing retention over time was observed. Since deuterated creatinine has a longer retention time than the endogenous, non-labelled creatinine, the latter will be the first to experience the matrix change and be more susceptible to ion suppression. This would lead to a decrease in the analyte/standard ratio and therefore in lowering of calculated concentration values. However, given the very low drift rate (−0.015 s/run), it is unlikely that creatinine retention time drift alone could be responsible for the entire decline in measured concentration of creatinine. We do not have exact explanation for such a drift. Changing the mobile phase pH in the range from 4 to 5 alters creatinine retention time but does not prevent retention time drift. Switching to ammonium format in the mobile phase did not prevent retention time drift either. A solution to compensate for the decline in measured concentration of creatinine is to run the calibration curves for creatinine more often.
Freeze-thaw stability
Overall, all tested analytes have shown good freeze-thawing stability (). Despite statistical significance, the low magnitude of decrease in the levels of creatinine, xanthine and hypoxanthine (from −0.4% to −1.6%) would rarely have practical consequences. An increase in the levels of allantoin (2% after 3 cycles and 3.2% after 6 cycles) is somewhat more of a concern (). Researchers who wish to study urinary allantoin with high accuracy in biobanked samples should consider the number of times their samples were thawed.
Storage stability
Our method was not available when the first samples were collected, so we could not measure the analytes’ concentration with LC-MS/MS in fresh urine. Instead, we had to assume that no changes in analytes concentration would take place when samples are stored in liquid nitrogen. Storage of biobanked urine in liquid nitrogen is very unpractical, but we found no better gold standard for experimental storage. Long-term storage of biobanked urine in а freeze-room is also unusual and was used in this study only to demonstrate the effect of different storage conditions over a wide range of temperatures.
We can conclude that storage of urine samples at −80 °C is equivalent to storage in liquid nitrogen for purines and creatinine stability (). We would not recommend using −20 °C freezer for long-term storage due to its effect on concentrations of the analytes. However, the magnitude of these changes could still be acceptable for some studies. Although the storage of urine in a freeze room does not affect the concentrations of hypoxanthine and allantoin, the market drop in concentrations of UA, creatinine and xanthine makes this condition not acceptable for long-term storage.
Comparison of analytical methods
The results obtained for UA with LC-MS/MS method show excellent agreement with the results obtained by validated enzymatic colorimetric assay ( and ). Our data indicate that reference values for urinary UA obtained with the reference test are valid for the LC-MS/MS assays. The correlation of LC-MS/MS results with validated enzymatic assay results for creatinine is acceptable ( and ). However, consistently lower values were obtained with the LC-MS/MS method along with relatively high day to day variation and steady decrease of measured concentration of creatinine in the QC samples. This makes the LC-MS/MS method inferior to the enzymatic assay for creatinine measurements.
Our method has several advantages
It allows analyses of several purine metabolites in one run, analytical ranges are relevant not only for medical, but also veterinary and biological research, it uses low sample volumes, is suitable for analysis of biobanked material and offers relatively easy processing not requiring sample extraction. Moreover, creatinine concentration measured simultaneously is useful to correct for urine concentration, and to assess fractional excretion of the metabolites.
Considering the high sensitivity of the new LC-MS/MS method, we see no serious obstacles to its adaptation to other biological fluids, such as serum, plasma or cerebrospinal fluid.
Limitations of our study
We have not been able to compare measurements of allantoin, xanthine and hypoxanthine with a reference methodology due to unavailability of proper reference tests. Furthermore, our study lacks baseline for storage stability for the LC-MS method. A study of analytes stability at room temperature and at +4 °C mimicking transportation of the samples to an analytical lab, as well as data on the stability at freezing temperatures for longer than 5.5 years, would strengthen the relevance of the present work and could be a subject for further studies. We also have no data on effects of storage time, conditions and freeze-thaw cycles on the performance of our reference tests. Finally, our study population was limited to 55 persons.
Conclusion
A newly developed LC-MS/MS method allows reliable quantitative assessment of xanthine, hypoxanthine, allantoin, and UA. The proposed pre-analytical processing makes the method suitable for both fresh and biobanked urine stored frozen at −80 °C for at least 5.5 years.
Assessment of creatinine is slightly biased compared to the routinely used enzymatic assay. Such bias is not unusual for a principally different methodology and could be improved by more frequent run of creatinine calibration curves. Establishment of reference intervals for the new method is recommended.
Acknowledgments
The authors are very grateful to Dr Ingrid Toft for her contribution to the project, support and excellent working environment and thank Gro Bolstad for technical assistance, Dr Maria Averina for help with measurement of UA and creatinine at the routine clinical chemistry laboratory. The publication charges for this article have been funded by a grant from the publication fund of UiT – The Arctic University of Norway.
Disclosure statement
No potential conflict of interest was reported by the authors.
Data availability statement
The data that support the findings of this study are available from University Hospital of North Norway (UNN) – but restrictions apply to the availability of these data, which were used under license for the current study, and so are not publicly available. Data are, however, available from the authors upon reasonable request and with permission of UNN and the Regional committee for medical and health research ethics.
Additional information
Funding
References
- Benner SA. Defining life. Astrobiology. 2010;10(10):1021–1030.
- Il'yasova D, Spasojevic I, Wang F, et al. Urinary biomarkers of oxidative status in a clinical model of oxidative assault. Cancer Epidemiol Biomarkers Prev. 2010;19(6):1506–1510.
- Storhaug HM, Norvik JV, Toft I, et al. Uric acid is a risk factor for ischemic stroke and all-cause mortality in the general population: a gender specific analysis from the Tromsø Study. BMC Cardiovasc Disord. 2013;13:115.
- Niskanen LK, Laaksonen DE, Nyyssonen K, et al. Uric acid level as a risk factor for cardiovascular and all-cause mortality in middle-aged men: a prospective cohort study. Arch Intern Med. 2004;164(14):1546–1551.
- Fang J, Alderman MH. Serum uric acid and cardiovascular mortality the NHANES I epidemiologic follow-up study, 1971–1992. National Health and Nutrition Examination Survey. Jama. 2000;283(18):2404–2410.
- Hoieggen A, Alderman MH, Kjeldsen SE, et al. The impact of serum uric acid on cardiovascular outcomes in the LIFE study. Kidney Int. 2004;65:1041–1049.
- Holme I, Aastveit AH, Hammar N, et al. Uric acid and risk of myocardial infarction, stroke and congestive heart failure in 417,734 men and women in the apolipoprotein MOrtality RISk study (AMORIS). J Intern Med. 2009;266(6):558–570.
- Grayson PC, Kim SY, LaValley M, et al. Hyperuricemia and incident hypertension: a systematic review and meta-analysis. Arthritis Care Res. 2011;63(1):102–110.
- Sundstrom J, Sullivan L, D'Agostino RB, et al. Relations of serum uric acid to longitudinal blood pressure tracking and hypertension incidence. Hypertension. 2005;45(1):28–33.
- Obermayr RP, Temml C, Gutjahr G, et al. Elevated uric acid increases the risk for kidney disease. JASN. 2008;19(12):2407–2413.
- Iseki K, Oshiro S, Tozawa M, et al. Significance of hyperuricemia on the early detection of renal failure in a cohort of screened subjects. Hypertens Res. 2001;24(6):691–697.
- Strasak AM, Rapp K, Hilbe W, et al. The role of serum uric acid as an antioxidant protecting against cancer: prospective study in more than 28 000 older Austrian women. Ann Oncol. 2007;18(11):1893–1897.
- Strasak AM, Rapp K, Hilbe W, the VHM&PP Study Group, et al. Serum uric acid and risk of cancer mortality in a large prospective male cohort. Cancer Causes Control. 2007;18(9):1021–1029.
- Bhole V, Choi JW, Kim SW, et al. Serum uric acid levels and the risk of type 2 diabetes: a prospective study. Am J Med. 2010;123(10):957–961.
- Neal DA, Tom BD, Gimson AE, et al. Hyperuricemia, gout, and renal function after liver transplantation. Transplantation. 2001;72(10):1689–1691.
- Burack DA, Griffith BP, Thompson ME, et al. Hyperuricemia and gout among heart transplant recipients receiving cyclosporine. Am J Med. 1992;92(2):141–146.
- Papandreou C, Li J, Liang L, et al. Metabolites related to purine catabolism and risk of type 2 diabetes incidence; modifying effects of the TCF7L2-rs7903146 polymorphism. Sci Rep. 2019;9(1):2892.
- Plank MS, Calderon TC, Asmerom Y, et al. Biochemical measurement of neonatal hypoxia. J Vis Exp. 2011;54:2948.
- Furuhashi M, Koyama M, Higashiura Y, et al. Differential regulation of hypoxanthine and xanthine by obesity in a general population. J Diabetes Investig. 2020;11(4):878–887.
- Cuhadar S, Atay A, Koseoglu M, et al. Stability studies of common biochemical analytes in serum separator tubes with or without gel barrier subjected to various storage conditions. Biochem Med (Zagreb). 2012;22(2):202–214.
- Cuhadar S, Koseoglu M, Atay A, et al. The effect of storage time and freeze-thaw cycles on the stability of serum samples. Biochem Med. 2013;23:70–77.
- Boudra H, Doreau M, Noziere P, et al. Simultaneous analysis of the main markers of nitrogen status in dairy cow's urine using hydrophilic interaction chromatography and tandem mass spectrometry detection. J Chromatogr A. 2012;1256:169–176.
- Hemstrom P, Irgum K. Hydrophilic interaction chromatography. J Sep Sci. 2006;29(12):1784–1821.
- Vincent IM, Creek D, Watson DG, et al. A molecular mechanism for eflornithine resistance in African trypanosomes. PLoS Pathog. 2010;6(11):e1001204.
- Kamleh MA, Snowden SG, Grapov D, et al. LC-MS metabolomics of psoriasis patients reveals disease severity-dependent increases in circulating amino acids that are ameliorated by anti-TNFalpha treatment. J Proteome Res. 2015;14(1):557–566.
- Rad Pour S, Morikawa H, Kiani NA, et al. Exhaustion of CD4+ T-cells mediated by the kynurenine pathway in melanoma. Sci Rep. 2019;9(1):12150.
- Rende U, Niittyla T, Moritz T. Two-step derivatization for determination of sugar phosphates in plants by combined reversed phase chromatography/tandem mass spectrometry. Plant Methods. 2019;15:127.
- Turner R, Stamp LK, Kettle AJ. Detection of allantoin in clinical samples using hydrophilic liquid chromatography with stable isotope dilution negative ion tandem mass spectrometry. J Chromatogr B Analyt Technol Biomed Life Sci. 2012;891–892:85–89.
- Kamleh MA, Dow JA, Watson DG. Applications of mass spectrometry in metabolomic studies of animal model and invertebrate systems. Brief Funct Genomic Proteomic. 2009;8(1):28–48.
- Kamleh MA, Hobani Y, Dow JA, et al. Towards a platform for the metabonomic profiling of different strains of Drosophila melanogaster using liquid chromatography-Fourier transform mass spectrometry. Febs J. 2009;276(22):6798–6809.
- Kamleh MA, Hobani Y, Dow JA, et al. Metabolomic profiling of Drosophila using liquid chromatography Fourier transform mass spectrometry. FEBS Lett. 2008;582(19):2916–2922.
- Bland JM, Altman DG. Statistical methods for assessing agreement between two methods of clinical measurement. Lancet. 1986;1:307–310.
- Passing H., Bablok. A new biometrical procedure for testing the equality of measurements from two different analytical methods. Application of linear regression procedures for method comparison studies in clinical chemistry, Part I. J Clin Chem Clin Biochem. 1983;21:709–720.
- Urate in urine. [cited]; Available from: https://labhandbok.unn.no/medisinsk-biokjemi/urinsyre-i-urin-article1874-816.html.
- Creatinine in urine. [cited]; Available from: https://labhandbok.unn.no/medisinsk-biokjemi/kreatinin-i-urin-article1921-816.html.
- Kim KM, Henderson GN, Frye RF, et al. Simultaneous determination of uric acid metabolites allantoin, 6-aminouracil, and triuret in human urine using liquid chromatography-mass spectrometry. J Chromatogr B Analyt Technol Biomed Life Sci. 2009;877(1–2):65–70.
- Kadian N, Raju KS, Rashid M, et al. Comparative assessment of bioanalytical method validation guidelines for pharmaceutical industry. J Pharm Biomed Anal. 2016;126:83–97.