
Abstract
Glucagon is a key regulator of metabolism and is used in the diagnostic of neuroendocrine tumors. Accurate measurement of glucagon requires both extreme sensitivity and specificity since several peptides are derived from the same proglucagon precursor encoding part of the glucagon sequence and given that glucagon circulates in picomolar concentrations. A sandwich ELISA was recently developed and extensively evaluated; however, this method may not be accurate when measuring glucagon in patients with an enhanced production of proglucagon-derived peptides as seen after Roux-en-Y gastric bypass (RYGB). To overcome this, a modified version of the ELISA was developed. In this study, we evaluate an unmodified and a modified version of the ELISA in healthy individuals, individuals with obesity, and finally in two cohorts of patients following RYGB surgery using different nutrient stimuli to assess glucagon dynamics. Finally, in vitro spike-in recoveries using native glucagon and proglucagon-derived peptides were performed in buffer and in plasma. Our data support that both versions of the ELISA accurately capture endogenous and exogenous glucagon in healthy individuals and in individuals with obesity. However, the unmodified version of the assay may overestimate glucagon levels in patients following RYGB in line with minimal but consistent cross-reactivity to oxyntomodulin and glicentin that both are 50-fold increased after RYGB. Importantly, we did not find any changes between the two protocols at fasted conditions and therefore diagnostics of glucagonomas is not affected by the choice of assay procedure nor the surgical history of the patient (RYGB).
Introduction
Glucagon is an essential peptide hormone secreted from the pancreatic alpha cells in response to a variety of stimuli hereof in particular low blood glucose and amino acids [Citation1]. The exact physiological role of glucagon is widely debated but key aspects include impact on hepatic glycogenolysis and gluconeogenesis and probably equally important ureagenesis. These actions are suggested to be impaired in metabolic diseases, a concept termed glucagon resistance [Citation2]. Increased glucagon levels, reported in patients with metabolic diseases such as obesity, type 2 diabetes and non-alcoholic liver disease, may reflect impaired glucagon receptor signaling [Citation3]. Measurement of glucagon has and are essential to understand the biology of glucagon and its role in metabolic diseases. It has always been difficult to measure the pancreas hormone glucagon accurately, partly because the concentration of the hormone in plasma is low (in the low pmol/L range and therefore, in general, requiring immunological methods); and partly because of the complex and differential processing of the hormone from its precursor, proglucagon (PG) [Citation4]. This peptide of 160 amino acids is formed in the pancreas as well as in the gastrointestinal tract (and is additionally expressed in a small amount in the brain stem, probably with little or no impact on circulating levels), but is processed differentially in the two tissues. In the pancreas, glucagon itself––corresponding to PG 33-61 ()––is formed, but a larger peptide, PG 1-61, is also secreted and circulates in relatively low concentrations [Citation5]. In the gut, PG is processed to produce glicentin (corresponding to PG1-69 which may be further processed to oxyntomodulin (PG 33-69); it is also possible that some intact PG or other larger fragments are formed in the pancreas and in the gut [Citation6].
Figure 1. A schematical view of the tissue specific processing of the proglucagon molecule with a focus on glucagon and epitopes used for its measurements. The arrows reflect antibodies. The red antibody reflects an N-terminal specific antibody (NH2), the black a side-viewing antibody and the blue a C-terminal specific antibody (COOH). If one is using an assay that uses either an N-terminal antibody or side-viewing antibody the assay will also measure oxyntomodulin and for the side viewing antibody glicentin. An accurate glucagon assay must therefore include both N-terminal and C-terminal specific antibodies. Intervening peptide 1(IP-1) and 2 (IP-2). Glicentin-related polypeptide (GRPP). Glucagon-like peptide-1 (GLP-1) and 2 (GLP-2).
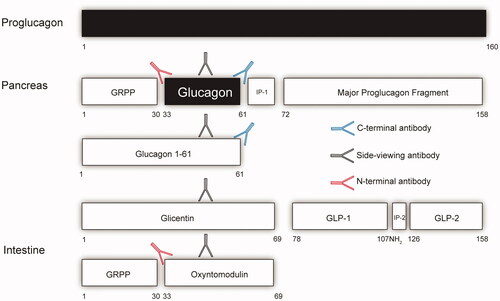
A classical radioimmunoassay with an antibody directed against a mid-region of glucagon (the predominating antigenic determinant) would therefore be able to react with no less than 5-7 different circulating PG products [Citation4]. Improved selectivity can be obtained by employing terminal-wrapping antibodies; for instance, an antibody against the C-terminus of glucagon would be expected to react with only glucagon and PG 1-61 from the pancreas, but not with the elongated gut products, glicentin and oxyntomodulin, and these so-called specific assays have been dominating for the last several decades [Citation7], However, because of the polyclonal nature of the antibodies typically used in such assays, their specificity over a larger concentration range of glucagon-like peptides cannot be guaranteed. Improved specificity might be obtained with a sandwich ELISA employing truly terminal-wrapping monoclonal antisera against the N-and the C-terminus, respectively, i.e. antisera that would not react with the molecule if the termini were modified, truncated, or elongated. During the last few years, sandwich ELISAs have been available from several producers [Citation8,Citation9]. One of the most popular has been the assay from the company Mercodia, which showed glucagon results in plasma resembling those obtained with the best C-terminal RIAs [Citation9]. In addition, this assay requires small plasma volumes, allowing for the first time reliable assays of glucagon in plasma from small rodents e.g. mice [Citation10].
However, in a study of gastrectomized subjects with very high postoperative levels of glicentin (and possible also oxyntomodulin), but also, unexpectedly, high levels of glucagon, cross-reactions of these components with the Mercodia glucagon assay were suspected [Citation11]. Formal tests of this hypothesis were not carried out, and other groups finding similar, very high responses of glicentin and oxyntomodulin in plasma from patients after gastrointestinal surgery (for instance pancreatectomy or Roux-en-Y gastric bypass, RYGB) concluded that the measured responses were due to a secretion of glucagon from the gut [Citation12]. Nevertheless, the Mercodia company developed a new assay protocol, the so-called sequential protocol, which included further washing steps designed to eliminate any cross-reactions with the intestinal components [Citation11]. We here report the results of studies, where we compare the two protocols (simultaneous and sequential) for formal comparison and measurements of plasma glucagon concentrations from subjects undergoing procedures resulting in the preferential secretion of pancreatic and/or gut-derived PG products.
Material and methods
Ethical considerations
Plasma samples used in this study were left-over material from three clinical studies. All studies were approved by the Danish regional ethics committees and were registered at Clinicaltrials.gov see NCT: NCT04907721, NCT03426956 and NCT02372526
Brief summary regarding the plasma samples from three clinical studies
Study A: Mixed amino acids (292 mg/hour/kg body weight, Vamin) were infused intravenously in 3 healthy subjects for 30 min, followed 30 min later (time 60 min) by an intravenous bolus infusion of glucagon (200 µg, Novo Nordisk A/S). Plasma was sampled before and after administration of exogenous glucagon.
Study B: Stored plasma from 10 RYGB operated (>12 months after surgery at weight stability) and eight BMI-matched individuals during 200 kcal (isocaloric) liquid meal tests containing >90 energy (E)% of either protein (whey protein) or glucose. For details, please consult the primary publication [Citation13].
Study C: Stored plasma from 10 RYGB operated (>12 months after surgery at weight stability) individuals during a 50 g oral glucose tolerance test (OGTT). For details, please consult the primary publication [Citation14].
Analytical details
Plasma concentrations of glucagon were measured using the simultaneous (the ‘conventional’) and the sequential (the ‘alternative’) protocol as instructed in the kit insert (Mercodia) and shortly described here:
The simultaneous protocol
Add sample/calibrator/controls
Add enzyme conjugate
Incubate for 18–22 hours at 2–8 °C at a plate shaker
Wash plate with 700 µL six times
Add substrate TMB and incubate 30 minutes
Add stop solution and read
The sequential protocol
Add sample/calibrator/controls
Add assay buffer
Incubate for 18–22 hours at 2-8 °C at a plate shaker
Wash plate with 700 µL six times
Add enzyme conjugate and incubate 1 hour
Wash plate with 700 µL six times
Add substrate TMB and incubate 30 minutes
Add stop solution and read
*italics represent differences between the two protocols
Plasma was not subjected to solvent or solid-phase extraction and samples were kept on ice until all samples had been aliquoted on the ELISA plates. The two versions of the washing procedure were performed simultaneously and using the exact same sample aliquot and assayed in duplicates using same calibrators to minimize bias.
Glucagon kits with identical LOT number: 32229 were obtained from the vendor Mercodia.
Plasma concentrations of glicentin and oxyntomodulin were measured as previously described [Citation6].
In vitro evaluation of the two washing procedures
For the in vitro experiments, assay buffer from the vendor (Mercodia) or pooled human plasma from 4 healthy individuals was used as matrix. Matrix samples were spiked with either glucagon, oxyntomodulin, GLP-1, or GLP-2 (peptide quantification by amino acid analysis was performed for all peptide stocks), or glicentin (Mercodia) at final concentrations of 5 pmol/L (glucagon only), 50 pmol/L (all peptides) or 500 pmol/L (oxyntomodulin, glicentin, GLP-1 or GLP-2). All tubes were stored in ice and were assayed in duplicates by a highly skilled medical technician Christine Rasmussen (Department of Clinical Biochemistry, Rigshospitalet, University of Copenhagen). Identical samples were used for the two washing procedures, which were performed simultaneously, and for each assay all samples were analyzed with kits of the same LOT number from the vendor.
Statistical analyses
All data are presented as mean ± SD unless otherwise stated. Unpaired t-tests were used to analyze data from two independent groups whereas ANOVA was used to compare multiple groups and or time points. Adjustment for multiple testing was done using the Holm-Sidak algorithm. Bland–Altman analyses were used to compare data obtained using the two different washing protocols. A value of p <.05 was considered significant. Calculations were performed using GraphPad Prism version 7.02 and STATA.
Results
Plasma concentrations of glucagon during stimulation of pancreatic secretion as well as infusions of glucagon analyzed by the simultaneous and sequential protocol
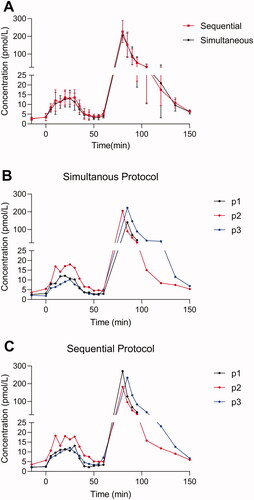
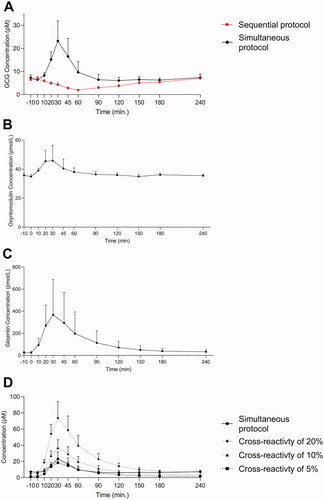
To eliminate any gut-derived factors with potential cross-reactivity to the measurements of glucagon, we first compared plasma concentrations of glucagon measured using the sequential and the simultaneous protocol in three healthy individuals subjected to an intravenous mixed amino acids infusion followed by a bolus infusion of exogenous glucagon. Plasma concentrations of both endogenous and exogenous glucagon were virtually identical when comparing kinetics, baseline and peak values () as measured using the simultaneous and the sequential protocol. We did not observe any statistically significant differences regarding total and incremental area under the curve as obtained using the two protocols (p > .8).
Figure 2. Endogenous and exogenous glucagon levels in healthy individuals. Plasma concentrations of glucagon are shown for three healthy individuals during an amino acid infusion (0–30 min) followed by a bolus infusion of glucagon (time 60 min). (A) Glucagon data (mean ± SD) obtained using two different wash protocols are shown (the simultaneous: black; the sequential: red). Individual data points (P1, P2, and P3) are shown in (B) (simultaneous) and (C) (sequential).
Postprandial plasma concentrations of glucagon in RYGB operated and BMI-matched individuals
To evaluate glucagon secretion in individuals with a ‘normal’ and with an ‘enhanced’ secretion of PG-derived peptides (GLP-1, glicentin and oxyntomodulin), we measured plasma concentrations of glucagon in individuals with obesity and in RYGB operated individuals during two separate isocaloric meals, one meal rich in protein and the other rich in glucose. Individuals with obesity were BMI matched to the RYGB group.
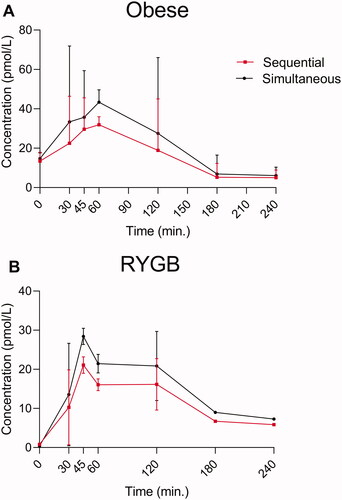
On the day with the protein meal, the baseline plasma concentrations of glucagon did not differ significantly between the two protocols but there was a trend (p = 0.1) towards a small reduction in postprandial plasma concentrations of glucagon, when using the sequential protocol compared to the simultaneous protocol in both obese and in RYGB operated individuals ().
Figure 3. Endogenous glucagon levels in eight individuals with obesity (A) and for 10 RYGB operated individuals (B) during a protein rich meal. Glucagon data obtained using two different wash protocols are shown (the simultaneous: black; the sequential: red). Data shown as mean ± SD.
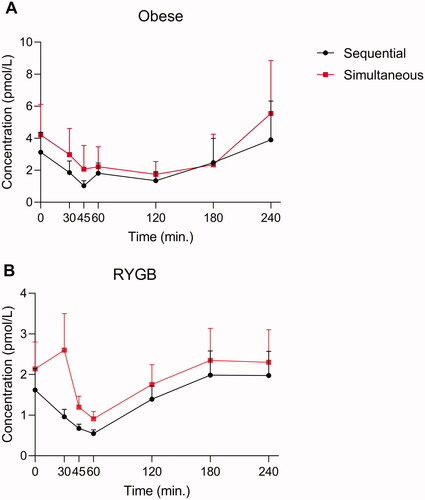
As PG-derived peptides from the gut (oxyntomodulin and glicentin) are primarily stimulated by glucose and not by protein, we also evaluated glucagon responses using the two washing protocols during a pure carbohydrate meal. Peak levels of glicentin and oxyntomodulin occur within the first 45 min in non-RYGB and 30 min in RYGB operated individuals [Citation6]. We did not observe any differences in glucagon responses using the two washing procedures in non-RYGB obese individuals [Citation6] (). In the RYGB operated individuals, there was a lack of glucose-induced suppression of glucagon at the 30-minute time point (amounting to ∼2 pmol/L) using the simultaneous but not the sequential protocol. However, the difference between the washing procedures was not observed at the 45 min time points and given that the peak levels of the plasma concentrations of both glicentin and oxyntomodulin occurred at 90 min [Citation13], one cannot conclude that the initial lack of suppression of glucagon is due to cross-reactivity with glicentin and or oxyntomodulin.
Figure 4. Endogenous glucagon levels in eight individuals with obesity (A) and for 10 RYGB operated individuals (B) during a pure glucose meal. Glucagon data obtained using two different wash protocols are shown (the simultaneous: black; the sequential: red). Data shown as mean ± SD.
To evaluate glucagon dynamics using the two wash protocols in an additional cohort, we included a group of 10 RYGB operated individuals that were subjected to a 50 g OGTT. Plasma concentrations of glucagon by the two wash protocols, glicentin and oxyntomodulin were measured. There were no baseline differences in plasma glucagon concentrations, however, glucagon dynamics differed between the two wash protocols (). The simultaneous protocol resulted in peaks levels of glucagon at time 30 min of 22 pmol/L whereas when using the sequential protocols, a reduction in plasma glucagon was observed (reached lowest level after 60 min). Plasma levels of oxyntomodulin () and glicentin () peaked at the 30-minute time point. To determine whether these increases in glucagon could be due to cross-reactivity to PG-derived peptides, we calculated and plotted data based on the assumptions of 5, 10, or 20% cross-reactivities of PG-derived peptides (glicentin data) (). Peak time and dynamics for the three computed prediction glucagon curves (in particular for the 5% cross-reactivity prediction curve) was comparable to the glucagon data obtained using the simultaneous protocol ().
Figure 5. Endogenous glucagon levels in ten obese RYGB operated individuals during a 50 OGTT. Glucagon data obtained using two different wash protocols are shown (the simultaneous: black; the sequential: red) in (A). Plasma concentrations of oxyntomodulin (B) and glicentin (C) are shown. Based on glicentin data (C) we calculated and plotted the predictive secretory response assuming cross reactivity to glicentin of 5% (black square, dashed line), 10% (black triangle, dashed line) and 20% (black, dashed line) when using the simultaneous protocol (black circle, full line). Data shown as mean ± SD.
Analytical evaluation
A recovery experiment of native glucagon, oxyntomodulin, glicentin, GLP-1 and GLP-2 was performed using assay buffer or pooled human plasma (). Minor differences between the two protocols were observed. Both versions measured oxyntomodulin and glicentin in plasma with cross-reactivities between 3-6%. The simultaneous protocol had highest cross-reactivity to oxyntomodulin and glicentin at dose tested of 500 pmol/L (6% and 5%).
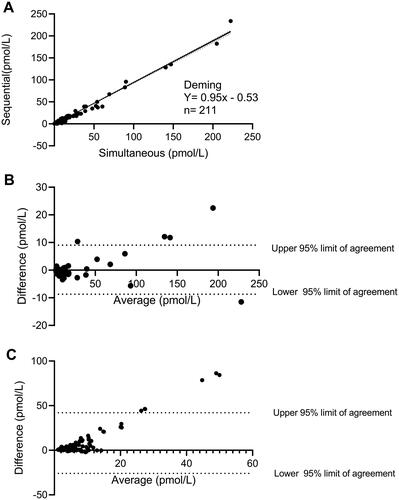
We finally generated a Deming plot () based on data from study A and two Bland–Altman plots from study A () and study C (), respectively, to evaluate a systematic bias between the simultaneous and the sequential protocols. A high correlation was observed across the two methods (R2=0.98) when comparing non-RYGB operated. A Bland–Altman analysis showed that endogenous glucagon in healthy individuals where equally measured by the two protocols whereas a small bias was observed for high (exogenous) levels of glucagon (). In contrast, when comparing glucagon data from RYGB operated individuals an increasingly positive bias was observed at higher plasma concentrations of glucagon when using the sequential protocol compared to the simultaneous protocol (). Approximately 95% of the datapoints were within the calculated 95% confidence interval.
Figure 6. (A) A deming plot and related regression is shown for data obtained using the simultaneous and the sequential washing protocol in study A. The N here represent the number of technical and not biological replicates. Bland–Altman analyses for data obtained using the two washing protocols are illustrated in (B) (healthy individuals only) and (C) (RYGB operated, during the OGTTs). The Bland–Altman analyses are calculated as the subtraction between the simultaneous to the sequential in pmol/L. A positive value shown in these plots therefore represents higher plasma glucagon levels observed in the simultaneous as compared to the sequential protocol.
Discussion
Measurement of plasma concentrations of glucagon is challenging due to preanalytical as well analytical challenges [Citation1]. In these studies, we had minimized known preanalytical errors such as keeping samples on ice and by using the exact same sample aliquot for measurement using both protocols. Roberts et al.[Citation11] who measured plasma concentrations of glucagon using the simultaneous Mercodia protocol after gastrectomy with a Roux-en-Y reconstruction, suspected that the levels could be falsely increased due to cross-reactivity with other PG-derived peptides, which share amino acid sequence with glucagon. In this study, we found no clear differences when evaluating endogenous and exogenous plasma concentrations of glucagon in healthy individuals. This part of the study was designed to avoid a major influence of secretions from the gastrointestinal tract and hence the potential cross-reactivity with intestinally derived glicentin and oxyntomodulin. However, when evaluating postprandial plasma concentrations of glucagon during a protein-rich meal in RYGB operated individuals we observed a minor but detectable reduction in peak plasma concentrations of glucagon when using the sequential compared to the simultaneous protocol. The difference between the protocols was further augmented when we measured glucagon concentrations in response to a glucose-rich stimulus that drives secretion of L-cell peptides (GLP-1, oxyntomodulin and glicentin) up to several hundred picomolar. When computing potential cross-reactivity to PG-derived peptides we found that the time of peak matched that of the actually measured glucagon using the simultaneous protocol suggesting that gut-derived factors such as glicentin may be contributing to these differences aligning with the observed small but consistent cross-reactivity to glicentin in-vitro. Differences between the two protocols were also mirrored in the postanalytical comparison using the Bland–Altman analysis, which showed an increasingly positive bias. These data suggest that the two versions of the established glucagon analyses are comparable when evaluating pancreas-derived glucagon, but when evaluating profiles from individuals with enhanced L-cell secretion (for example in the case of RYGB surgery) plasma concentrations of glucagon may be overestimated because of cross-reactions with intestinally derived PG products.
These data have relevance for academic and clinical usages of glucagon measurement. In regard to the academic interest, this study supports the comprehensive literature that accurate measurement of glucagon is troublesome [Citation15]; indeed, the lesson is that one must carefully evaluate the assay used when measuring glucagon during postprandial conditions. Although fasting concentrations did not appear to be affected so much, their measurement brings up another problem: the sensitivity, since suppression of glucagon secretion is one of the important determinants of glucose tolerance. An insensitive assay may not be able to detect the suppression, as investigated in a previous study [Citation16]. Regarding the clinical relevance, it may be noted that the guidelines for diagnosis of glucagon-producing tumors (glucagonomas) are based on fasting plasma concentrations of glucagon. In this case, the use of the sequential protocol probably does not affect the conclusion made and hence the diagnostics accuracy of this method currently used in Scandinavia.
Acknowledgments
We appreciate the expertise of medical laboratory technician Christine Rasmussen (Department of Clinical Biochemistry, Rigshospitalet, Denmark).
Disclosure statement
Jens Juul Holst and Nicolai J. Wewer Albrechtsen has both received research support and speaker fee from the company Mercodia not related to this study. Apart from the aforementioned, there are no conflict of interest to declare.
Additional information
Funding
References
- Albrechtsen NJW, Kuhre RE, Pedersen J, et al. The biology of glucagon and the consequences of hyperglucagonemia. Biomark Med. 2016;10(11):1141–1151.
- Janah L, Kjeldsen S, Galsgaard KD, et al. Glucagon receptor signaling and glucagon resistance. Int J Mol Sci. 2019;20(13):3314.
- Albrechtsen NJW. The glucose-mobilizing effect of glucagon at fasting is mediated by cyclic AMP. Am J Physiol Endocrinol Metab. 2021;321(4):E571–E574.
- Holst JJ, Wewer Albrechtsen NJ. Methods and guidelines for measurement of glucagon in plasma. Int J Mol Sci. 2019;20(21).
- Wewer Albrechtsen NJ, Kuhre RE, Hornburg D, et al. Circulating glucagon 1-61 regulates blood glucose by increasing insulin secretion and hepatic glucose production. Cell Rep. 2017;21(6):1452–1460.
- Wewer Albrechtsen NJ, Hornburg D, Albrechtsen R, et al. Oxyntomodulin identified as a marker of type 2 diabetes and gastric bypass surgery by mass-spectrometry based profiling of human plasma. EBioMedicine. 2016;7:112–120.
- Holst JJ. Evidence that enteroglucagon (II) is identical with the C-terminal sequence (residues 33-69) of glicentin. Biochem J. 1982;207(3):381–388.
- Bak M, Albrechtsen Wewer N, Pedersen J, et al. Specificity and sensitivity of commercially available methods for the measurement of human glucagon, oxyntomodulin and glicentin; 2013.
- Wewer Albrechtsen NJ, Hartmann B, Veedfald S, et al. Hyperglucagonaemia analysed by glucagon sandwich ELISA: nonspecific interference or truly elevated levels? Diabetologia. 2014;57(9):1919–1926.
- Albrechtsen NJW, Kuhre RE, Windeløv JA, et al. Dynamics of glucagon secretion in mice and rats revealed using a validated sandwich ELISA for small sample volumes. Am J Physiol Endocrinol Metab. 2016;311(2):E302–E309.
- Roberts GP, Kay RG, Howard J, et al. Gastrectomy with roux-en-Y reconstruction as a lean model of bariatric surgery. Surg Obes Relat Dis. 2018;14(5):562–568.
- Jorsal T, Wewer Albrechtsen NJ, Christensen MM, et al. Investigating intestinal glucagon after Roux-en-Y gastric bypass surgery. J Clin Endocrinol Metab. 2019;104(12):6403–6416.
- Jensen CZ, Bojsen-Møller KN, Svane MS, et al. Responses of gut and pancreatic hormones, bile acids, and fibroblast growth factor-21 differ to glucose, protein, and fat ingestion after gastric bypass surgery. Am J Physiol Gastrointest Liver Physiol. 2020;318(4):G661–g672.
- Martinussen C, Veedfald S, Dirksen C, et al. The effect of acute dual SGLT1/SGLT2 inhibition on incretin release and glucose metabolism after gastric bypass surgery. Am J Physiol Endocrinol Metab. 2020;318(6):E956–E964.
- Cegla J, Jones BJ, Howard J, et al. The preanalytical stability of glucagon as measured by liquid chromatography tandem mass spectrometry and two commercially available immunoassays. Ann Clin Biochem. 2017;54(2):293–296.
- Wewer Albrechtsen NJ, Veedfald S, Plamboeck A, et al. Inability of some commercial assays to measure suppression of glucagon secretion. J Diabetes Res. 2016;2016:8352957.