
Abstract
Aim
The diagnosis of alcoholic liver disease (ALD) is still a great challenge. Therefore, the purpose of this study is to identify and characterize new metabolomic biomarkers for the diagnosis and staging of ALD.
Methods
A total of 127 patients with early liver injury, 40 patients with alcoholic cirrhosis (ALC) and 40 healthy controls were included in this study. Patients with early liver injury included 45 patients with alcoholic liver disease (ALD), 40 patients with non-alcoholic fatty liver disease (NAFLD) and 40 patients with viral liver disease (VLD). The differential metabolites in serum samples were analyzed using ultra-high-performance liquid chromatography-quadrupole/time-of-flight mass spectrometry, and partial metabolites in the differential metabolic pathway were identified by liquid chromatography– tandem mass spectrometry.
Results
A total of 40 differential metabolites and five differential metabolic pathways in the four groups of patients with early liver disease and healthy controls were found, and the metabolic pathway of primary bile acid (BA) biosynthesis was the pathway that included the most differential metabolites. Therefore, 22 BA profiles were detected. The results revealed that the changes of BA profiles were most pronounced in patients with ALD compared with patients with NAFLD and VLD, in whom 12 differential BAs were diagnostic markers of ALD (AUC = 0.883). The 19 differential BAs in ALC and ALD were diagnostic markers of the stage of alcoholic hepatic fibrosis (AUC = 0.868).
Conclusion
BA profiles are potential indicators in the diagnosis of ALD and evaluation of different stages.
Introduction
Liver disease currently affects the health of millions of people worldwide. According to the Global Burden of Disease Project, more than 2 million people died from liver diseases in 2010, including acute hepatitis, cirrhosis and liver cancer, accounting for approximately 4% of all deaths globally [Citation1]. The prevalence of alcohol-related liver disease continues to increase as living standards improve, although the incidence of viral hepatitis is currently decreasing thanks to the advances in prevention, diagnosis and treatment, leading to more end-stage liver diseases [Citation2].
Prolonged excessive alcohol consumption leads to alcoholic liver disease (ALD), which is characterized by several histopathological changes, from simple steatosis to alcoholic steatohepatitis, progressive liver fibrosis and even cirrhosis. One of the features of alcoholic liver injury is the presence of oxidative stress, which leads to lipid peroxidation, steatosis, liver cell damage and death that in turn leads to the release of damage-related molecular patterns. Moreover, alcohol consumption promotes changes in the composition of the microbiota, increases intestinal permeability as well as the displacement of bacterial products. All these aspects activate Kupffer cells and promote the release of inflammatory cytokines, further exacerbating the inflammatory and fibrotic processes in the liver [Citation3,Citation4]. Patients with ALD may also suffer from cholestasis, mainly due to the accumulation of bile acids (BAs) due to the abnormal intestinal and hepatic circulation of BAs, which accelerates the progression of ALD [Citation5]. Current studies found that ALD is rarely detected in the early stages compared with other liver diseases, leading to a poor prognosis in advanced patients, and alcohol consumption is also one of the causes of the progression of other liver diseases [Citation6,Citation7]. Therefore, accurate and noninvasive diagnostic indicators are urgently needed for the diagnosis of ALD and the evaluation of ALD staging.
ALD is diagnosed mainly through questionnaires, laboratory tests, imaging features and pathological examination. The aspartate aminotransferase (AST)/alanine transaminase (ALT) ratio by laboratory tests is used as a help in the diagnosis of ALD; γ-glutamyl transpeptidase (GGT) is another sensitive indicator diagnosing alcoholic fatty liver in a context of alcohol misuse; finally, the imaging features can reflect the presence of cirrhosis [Citation8,Citation9]. However, these methods lack specificity and sensitivity. Although the pathological examination is the gold standard, it is not easily accepted by patients because it is expensive, time-consuming and invasive. Transient elastography (TE) is a reliable and noninvasive method for diagnosing fibrosis in liver disease, but it has some limitations, such as uneven operator experience and technique, and complications of cirrhosis decompensation affecting the interpretation of the results; thus, other complementary methods are necessary [Citation10]. Metabolome analysis based on mass spectrometry is a rapid method to discover disease-specific diagnostic biomarkers [Citation11]. It is also an evolving field of research that can directly reflect the pathophysiological processes of diseases, as well as identify single metabolites or metabolic groups as biomarkers to diagnose diseases and evaluate the prognosis [Citation12]. At present, some differential metabolites in patients with ALD have been found using metabolomics methods, including metabolites of amino acids and lipids. The levels of fatty acids, phosphatidylcholine diacyls and steroid metabolites tend to increase, while those of phosphatidylcholine acyl-alkyls and hydroxysphingomyelins decline. Common changes in amino acid levels include decreased glutamine levels, decreased 3-hydroxy-o-aminobenzoic acid, an intermediate product of tryptophan degradation and increased levels of tyrosine and alanine [Citation13,Citation14]. The compound 2-hydroxy-3-methylbutyric acid is a candidate biomarker for habitual alcohol intake and is strongly associated with the risk of liver and pancreatic cancer [Citation15]. However, none of these differential metabolites are used in clinical practice because these metabolic markers should be validated on a large scale for the diagnosis of ALD.
Therefore, TE testing was performed in patients with different liver diseases after clear diagnosis, and the differential metabolites in the serum of these patients were found and identified by metabolomics to reveal the diagnostic biomarkers of ALD and its different stages.
Materials and methods
Patients
A total of 40 healthy individuals and 167 patients with liver disease were included in this study. The 167 patients included 127 suffering from early liver injury and 40 suffering from alcoholic cirrhosis (ALC). Patients with early liver injury refer to patients who have not entered the stage of liver cirrhosis. Patients with early liver injury were represented by those with non-alcoholic fatty liver disease (NAFLD; 41 cases), viral liver disease (VLD; 42 cases) and ALD (45 cases) according to different etiologies. The patients included in the disease group were outpatients and inpatients who were treated in the First Clinical Hospital of Jilin University from December 2020 to December 2021. The diagnosis of all patients was made by physicians in the appropriate clinical departments, and all of them met the diagnostic criteria for the diseases listed above, without including other types of liver diseases. All patients with early liver damage and partial cirrhosis underwent TE testing performed by an experienced doctor. A value of liver stiffness measurement (LSM) less than 17.5 kPa indicated the presence of liver fibrosis, and more than 17.5 kPa indicated the presence of cirrhosis [Citation16]. Some patients with decompensated cirrhosis could not be subjected to TE because of complications such as ascites. The healthy control group included healthy people who underwent a physical examination at the First Clinical Hospital of Jilin University from April to May 2021, and the medical examination by ultrasound and laboratory tests (including blood and urine routine examination, liver and kidney function test) excluded the presence of liver diseases, tumors or other chronic diseases to exclude any anomalies. The control group did not have any drinking habit or the average drinking volume in men was less than 40 g/day, and less than 20 g/day in women. Basic personal information (gender and age), medical history and clinical laboratory indicators were collected for all participants. This study was approved by the Ethics Committee of the First Hospital of Jilin University and met the clinical ethics requirements (No. 2022-354).
Sample collection and laboratory analysis
Overnight fasting blood samples were collected from all subjects. The following laboratory parameters were measured using a SYSMEX (XN-9000, Japan), Beckman (AU-5821, America), Abbott (i4000, America) instrument: red blood cell count, mean red blood cell volume, platelet count, ALT, AST, GGT, alkaline phosphatase (ALP), albumin levels, total cholesterol (TC), triglycerides (TG), high-density lipoprotein cholesterol (HDL-C), low-density lipoprotein cholesterol (LDL-C) and quantification of hepatitis B and C virus. The remaining blood samples were stored at −80 °C immediately after the laboratory analysis was complete until further use.
Untargeted metabolomic analysis
The serum specimens were removed from the −80 °C refrigerator and thawed until reaching room temperature. Each serum sample (50 μL) was transferred into a 1.5 mL centrifuge tube, and 150 μL methanol acetonitrile 50% were added. The solution was mixed with the vortex for 10 min, placed at −20 °C for 30 min, centrifuged at 13,000 rpm and −4 °C for 10 min and finally 100 μL were collected for the analysis. The metabolite profiling was carried out for multiple reaction monitoring scan analysis using a Shimadzu Exion LCTM ultra-high-performance liquid chromatography (UHPLC) system (Kyoto, Japan) with a binary pump, autosampler, thermostatically controlled column compartment and an auto sample manager coupled with a triple-quadrupole/time-of-flight (TOF-MS) 5600 mass spectrometer (AB Sciex, ON, Canada). The metabolites were eluted on a BEH C18 Column (100 × 2.1 mm, 1.7 µm; Waters, Ireland). The MS analysis with an electrospray ionization (ESI) source operated over a mass range of 50–1500 Da in the TOF scan mode. The TOF scan time was maintained at 14 min. The mobile phase consisted of 0.5% formic acid in water (solvent A) and 0.1% formic acid acetonitrile (solvent B) at a flow rate of 0.4 mL/min in the positive ion mode, while it was water (solvent A) and acetonitrile (solvent B) at a flow rate of 0.4 mL/min in the negative ion mode. The separation gradient program was as follows: 0.0–1.0 min (2.0% B); 1.0–3.0 min (2.0–15.0% B); 3.0–5.0 min (45.0% B); 5.0–9.0 min (50.0–95.0% B); 9.0–12.0 min (95.0% B); 12–12.1 min (95.0–2% B); 12.1–14.0 min (2.0% B).
Targeted quantitative detection of BAs
The serum specimens were removed from the −80 °C refrigerator and thawed until reaching room temperature. The quantitative analysis of 15 BAs was performed using a Thermo YS EXACT 9050 HPLC-MS/MS system and Reagent Pack for BAs Detection (liquid chromatography– tandem mass spectrometry (LC–MS/MS)). The 15 BAs include cholic acid (CA), chenodeoxycholic acid (CDCA), taurocholic acid (TCA), glycocholic acid (GCA), taurochenodeoxycholic acid (TCDCA), glycochenodeoxycholic acid (GCDCA), lithocholic acid (LCA), deoxycholic acid (DCA), ursodeoxycholic acid (UDCA), taurolithocholic acid (TLCA), glycine lithocholic acid (GLCA), taurodeoxycholic acid (TDCA), glycodeoxycholic acid (GDCA), tauroursodeoxycholic acid (TUDCA) and glycoursodeoxycholic acid (GUCDA). Hundred μL calibrator/quality control/serum sample was placed into a 2 mL centrifuge tube, then, 100 μL isotope standard mixing and 800 μL extraction solution were added, and the solution was mixed by vortex for 5 min. The solution was centrifuged at 8000 r/min for 2 min, the supernatant was placed into a 1.5 mL centrifuge tube, dried under nitrogen stream at 45 °C. Next, 100 μL compound solution was added to re-dissolve, mixed by vortex for 3 min, centrifuged at 15,000 r/min and 80 μL of the supernatant were collected. The separation of BAs was performed on a C18 Column (100 × 2.1 mm, Medical System, China) maintained at 40 °C. The samples (10 μL) were delivered at a flow rate of 0.3 mL/min. The mobile phase consisted of methanol solution (solvent A) and aqueous solution containing ammonium formate (solvent B). MS analysis was performed on a Thermo 9050 MS equipped with an ESI source operated in the negative ion mode. MS parameters optimized by direct infusion of standard solutions through a syringe pump were as follows: ion spray voltage 3000 V; source temperature 350 °C; sheath gas 50 Arb; Aux gas 10 Arb; vaporizer temperature 200 °C.
Statistical analysis
The raw data obtained from the UHPLC–MS/MS platform were imported into XCMS for pretreatment, including peak matching, retention time correction, and variable integration. The data were imported into SIMCA 14.1 software in a matrix form, scaled by unit variance method (UV), and a principal component analysis (PCA) model was constructed to observe the discrete trend among groups. Supervised orthogonal projection to the latent structure discriminant analysis (OPLS-DA) pattern recognition analysis was used. Generally, R2 (interpretation rate of the model) and Q2 (prediction rate of the model) should be greater than 0.5 to be considered as a valid model. The differential metabolites among groups were selected according to the Variable Importance Projection (VIP) > 1, p < 0.01 and q < 0.01. Differential metabolites were identified using a combination of purchased commercial XCMS Plus online platform and METLIN database. The METLIN database and XCMS plus were developed by Scripps Center in the USA. The secondary maps obtained from SCIEX were identified by METLIN database [Citation17]. Metabolic pathway enrichment analysis was performed by MateboAnalyst online software.
Statistical analysis was performed using SPSS Statistics V.26 (IBM) and Prism V.8 (GraphPad), and the variables were expressed as mean ± SD. One-way analysis of variance was used for the comparison of multiple groups with variables normally distributed and homogeneity of variance. The Kruskal–Wallis test was employed for other variables among multiple groups. The probability values of multiple metabolite combinations were obtained using binary logistic regression analysis in SPSS, and the obtained probability values were used as test variables for receiver operating characteristic curve analysis. The Origin software was used to analyze the correlation between BA profiles and clinical indicators [Citation18]. A value of p < 0.05 was considered statistically significant.
Results
Participant clinical characteristics
The baseline characteristics of all participants are shown in . Differences among the healthy control group and the four disease groups were found; the age of VLD, ALD and ALC patients was relatively old, and the AST, ALT, GGT and ALP values in the four disease groups were higher than those in the healthy control group. BMI, TC, TG and LDL were significantly higher while HDL was significantly lower in NAFLD patients than in healthy controls, which were consistent with the disease characteristics of NAFLD. No difference in LSM values was observed among the three groups of patients with ALD, NAFLD and VLD according to different etiologies, indicating that the degree of liver damage was similar among the three groups.
Table 1. Demographic and clinical characteristics of all participants.
Biosynthesis pathway of primary BAs, which was the most significant differential metabolic pathway
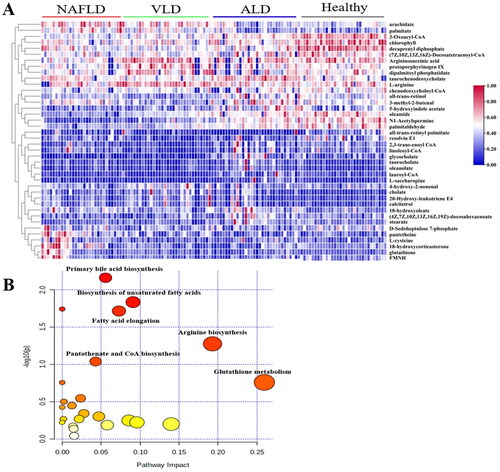
The small molecule metabolites in the serum were detected in the four groups including healthy control, ALD, NAFLD and VLD groups using a non-targeted metabolomics method. A typical total ion current diagram is shown in Supplementary Figure S1. represents the positive and negative ion PCA score plots, respectively, showing the evident clusters among the four groups. OPLS-DA positive ion model (R2Y= 0.973, Q2 = 0.748; ), negative ion model (R2Y= 0.847, Q2 = 0.708; ) and the 200 ordination tests showed no signs of overfitting ()), indicating that the model was excellent for discovering differential metabolite. A total of 40 differential metabolites were identified by METLIN database (Supplementary Table S1), including 5 BAs, 8 amino acids, 18 lipids and 9 other substances. A heatmap was showing the differences among groups (). Metabolic pathway enrichment analysis showed that the main altered pathways were primary BA biosynthesis, unsaturated fatty acid biosynthesis, fatty acid elongation, arginine biosynthesis, pantothenic acid and CoA biosynthesis and glutathione metabolism (). A targeted metabolomic approach was used to detect specific changes in BA profiles since the biosynthesis pathway of primary BAs included the most differential metabolites.
Figure 1. Untargeted metabolomics analysis among the four groups of NAFLD, VLD, ALD and Healthy group. (A, B) PCA score 3D plots of serum metabolites for four groups. (C, D) OPLS-DA score plots of serum metabolites for four groups. (E, F) validation plot of OPLS-DA, whether indicates that the original model is valid and overfitted.
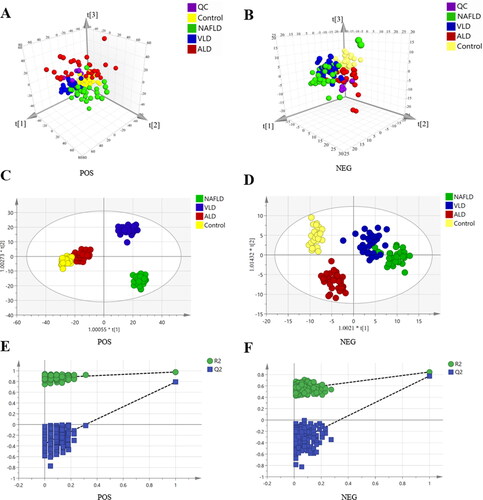
Figure 2. Differential metabolites and metabolic pathways in NAFLD, VLD, ALD and healthy groups. (A) Heatmap visualization of serum metabolites among the four groups. (B) Overview of pathway analyses based on selected metabolites.
Identification and diagnosis of ALD using BA profiles
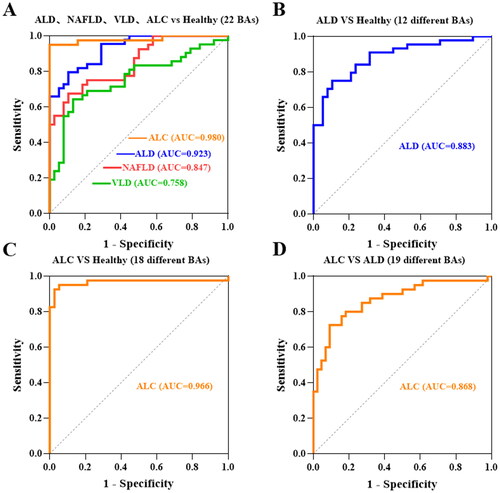
The 15 BA profiles were detected in the four groups including healthy control, ALD, NAFLD and VLD groups using a targeted metabolomics method. Typical chromatograms of different BAs and isotope internal standards are shown in Supplementary Figure S2. The serum BA profiles among the four groups were quantitatively detected, and the differences are shown in . The effect of 22 BAs on ALD, NAFLD and VLD was compared with the healthy control group by the area under the curve (AUC), and the results showed that the effect on distinguishing ALD better than that of other disease groups (AUC = 0.923) ().
Figure 3. The differential bile acids of 18 in serum among four groups of ALD, NAFLD, VLD and healthy. The absolute concentration of bile acid is expressed in lg form. Data are presented as mean and standard. *p<0.05; **p<0.01.
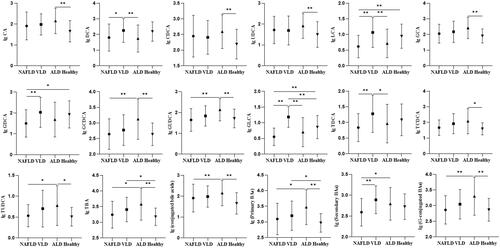
Figure 4. Receiver operating characteristic (ROC). (A) ROC curves of 22 BAs compared with Healthy group in NAFLD, VLD, ALD and ALC groups, respectively. (B) ROC curves of 12 differential BAs compared with the healthy group in ALD. (C) ROC curves of 18 differential BAs compared with the healthy group in ALC. (D) ROC curves of 19 differential bile acids compared with the ALD group in ALC.
Although the change trend of the BA profiles in ALD and NAFLD was similar, the change of the BA profiles in ALD was more significant than that in NAFLD. GCDCA (p = 0.001), GUDCA (p = 0.001), TBA (p = 0.015), primary BA (p = 0.018), secondary BA (p = 0.022) and conjugated BA (p = 0.004) in ALD were significantly higher than those in the NAFLD group (). The main difference between the ALD group and the VLD group was that the change trend of secondary BAs was opposite. DCA (p = 0.009), LCA (p = 0.002), GLCA (p < 0.001) and TDCA (p = 0.002) decreased in the ALD group compared with those in the VLD group (). Therefore, three early liver diseases could be identified by changes in BA profiles.
ALD group compared with healthy control group: the increase in the synthesis of CA (p < 0.001), CDCA (p = 0.005), and there was no significant difference in CA/CDCA indicating that there was no difference in the degree of increase between CA and CDCA; conjugated BAs with taurine and glycine increased in GCA (p = 0.001), GCDCA (p = 0.001) and TCDCA (p = 0.01); UDCA (p = 0.004), TUDCA (p = 0.028) and GUDCA (p = 0.002) also increased in secondary BAs, while secondary BAs DCA, LCA and their binding forms decreased although not significantly; total BAs (TBA) (p < 0.001), primary BAs (p < 0.001) and conjugated BAs (p = 0.003) were significantly increased in ALD after the combination. Moreover, 12 differential BAs in ALD might be used as a diagnostic indicator of ALD (AUC = 0.883) ().
BA profiles distinguish different stages of ALD development
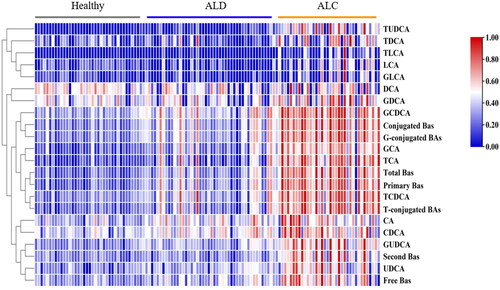
Serum BA profiles were further explored whether they could distinguish different stages of ALD development (Supplementary Table S2). shows the trend of BA profiles in the healthy control, ALD and ALC groups (Supplementary Figure S3). Compared with the healthy control group, 18 BA profiles in the ALC group were significantly increased (p < 0.05), except for DCA, LCA, GDCA and GLCA, and these 18 differential BA profiles might be used as a diagnostic indicator of ALC (AUC= 0.966) (). Compared with the ALD group, 19 BA profiles in the ALC group were significantly increased (p < 0.05), except for CA, CDCA and DCA, and these 19 differential BA profiles might be used as a diagnostic indicator to distinguish early liver injury from cirrhosis (AUC = 0.868) ().
Figure 5. Heatmap visualization of 22 bile acids among the three groups of healthy, ALD and ALC.
Correlation between BA profiles and clinical indicators in the ALD and ALC group
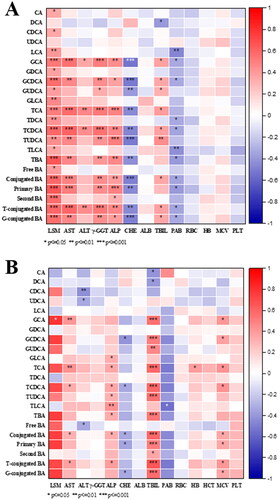
Spearman correlation analysis was performed on the clinical indicators and BA profiles of patients in the ALD and ALC groups (). Various clinical indicators in the ALD group and ALC group were correlated with BA profiles. Especially LSM had a strong correlation with various BAs in the ALD group, while the lack of LSM data in ALC could not well describe the correlation. The ALD group showed a stronger correlation between BAs and clinical indicators compared with the correlation in the ALC group; thus, BA profiles were more effective in the diagnosis and prediction of early ALD.
Figure 6. Heatmaps of partial Spearman correlation coefficients between all BA relevant variables and clinical indices. (A) ALD group; (B) ALC group.
Discussion
Untargeted metabolomics can screen out known or unknown differential metabolites in the experimental group by detecting metabolites extracted from a sample, with also the ability to reflect the metabolic pathways associated with each other [Citation19]. In this study, the small molecule metabolites in the serum of ALD, NAFLD, VLD and healthy control group with consistent degrees of liver damage were evaluated, and 40 different metabolites were found by the untargeted metabolomics method. These metabolites were mainly lipids, amino acids, and BAs, and the most significant differential metabolic pathway was the biosynthesis of primary BAs. Therefore, a LC–MS/MS method for the simultaneous quantitative detection of 15 BAs was established, which could be used for the detection of BA profiles in clinical practice. The serum BA profiles of patients in the healthy control group, ALD, NAFLD and VLD were targeted and quantitatively detected by this method, and the change in BA profiles in ALD patients was the most evident. Thus, the differential BA profiles of ALD might be used as diagnostic indicators, as well as to differentiate ALD from VLD and NAFLD. The differential BAs in ALC group compared with those in the ALD group might be used as indicators of ALD staging.
The TBA, primary BA and conjugated BA in the serum of ALD patients were significantly increased, and the induced BA increase was mainly due to the synthesis of CA and CDCA and the increase in the combination of CA, CDCA and glycine. This result was basically consistent with the serum BA changes in rats caused by chronic alcohol feeding, and long-term ethanol feeding induces a significant increase in CA and glycine-conjugated BA in rat serum [Citation20]. CYP7A1 is the most important rate-limiting enzyme in BA synthesis. The intestinal hormone fibroblast growth factor 19 (FGF19)/FGF15 (mouse homology) is the main regulatory factor of CYP7A1. BAs activate the nuclear receptor Farnitome X receptor (FXR) to upregulate the expression of FGF19, which enters the liver to form the FGF19–KLB–FGFR4 complex that inhibits CYP7A1 synthesis [Citation21,Citation22]. These studies found that FXR is downregulated in a mouse model of ALD [Citation23]. In addition, chronic ethanol consumption directly downregulates the expression of FGF15 [Citation20], and alcohol increases the expression of Cyp7A1 and Cyp27A1 by activating the hepatic cannabinoid receptor type 1 and CREBH in the mouse liver [Citation24], resulting in increased BA synthesis and BA pool siltation. CA-fed mice show an increased hepatic oxidative stress, cell proliferation and liver weight [Citation25], and unconjugated or glycine-conjugated BAs are more hydrophobic and more toxic than taurine-conjugated BAs [Citation20]; thus, the increase of CA, CDCA and glycine-conjugated BAs accelerate the progression of ALD. Although our results showed no correlation between DCA and LCA in ALD after Bonferroni correction, a downward trend was still present, which might be due to the intestinal 7α-dehydroxylation by the typical Clostridium (i.e. Clostridium cluster XVIa). The reduction of intestinal 7β-dehydroxylation bacteria reduces the conversion of UDCA to LCA, and the accumulation of UDCA and its conjugated forms [Citation26,Citation27].
Our result showed that when alcoholic liver fibrosis developed into cirrhosis, the BA profiles further significantly increased. The increase of CA, CDCA and DCA in the ALC group was not significant compared with their in the ALD group, while other 19 BA profiles were significantly increased, because patients with ALC might develop a further exacerbation of the intestinal dysbiosis and increased enterohepatic circulation of BAs [Citation28]. Alcohol intake induces changes in BA transporter expression, including the upregulation of hepatic BSEP and MRP2 and hepatic and ileal ASBT and OSTβ, resulting in an increased BA reabsorption [Citation20,Citation29]. Previous experiments proved that ALD is alleviated by altering gut microbes and their metabolic ability by pectin, thereby altering BA enterohepatic circulation [Citation30]. The changes in BAs in ALC were basically consistent with those found by Sang et al. [Citation31], although their study did not evaluate BA in patients with early alcoholic liver injury, while our study found that BA profiles in ALC was significantly changed, as well as the serum BA profiles in patients with early alcoholic liver injury. Therefore, the BA profiles could not only be used as a diagnostic indicator for ALD and ALC, but also to evaluate the different stages of the disease.
Our study has certain limitations. Serum BAs in patients with cirrhosis were not compared due to different etiologies, and the included patients lacked a pathological diagnosis and were not accepted because pathological examination was expensive, time-consuming and invasive. TE testing is a promising alternative to liver biopsy for the detection of liver fibrosis [Citation32]. Our study staged liver disease by TE testing, and then the indicators for the diagnosis and staging of ALD were evaluated using metabolomics. The results showed that there was a strong correlation between LSM value and BA profiles of differential metabolites.
Conclusion
BA profiles are potential indicators in the diagnosis of ALD and evaluation of different stages.
Author contributions
Conceptualization, Jing Huang; Data curation, Gaixia Zhang and Haizhen Chen; Formal analysis, Gaixia Zhang and Haizhen Chen; Funding acquisition, Jing Huang; Methodology, Gaixia Zhang and Wenbo Ren; Resources, Gaixia Zhang and Haizhen Chen; Writing – original draft, Gaixia Zhang and Haizhen Chen; Writing – review and editing, Wenbo Ren and Jing Huang.
Supplemental Material
Download PDF (875.8 KB)Acknowledgments
The authors are most grateful to all participants in the present study.
Disclosure statement
No potential conflict of interest was reported by the author(s).
Additional information
Funding
References
- Byass P. The global burden of liver disease: a challenge for methods and for public health. BMC Med. 2014;12:159.
- Xiao J, Wang F, Wong NK, et al. Global liver disease burdens and research trends: analysis from a Chinese perspective. J Hepatol. 2019;71(1):212–221.
- Yang YM, Cho YE, Hwang S. Crosstalk between oxidative stress and inflammatory liver injury in the pathogenesis of alcoholic liver disease. IJMS. 2022;23(2):774.
- Tripathi A, Debelius J, Brenner DA, et al. The gut-liver axis and the intersection with the microbiome. Nat Rev Gastroenterol Hepatol. 2018;15(7):397–411.
- Li T, Chiang JYL. Bile acid-based therapies for non-alcoholic steatohepatitis and alcoholic liver disease. Hepatobiliary Surg Nutr. 2020;9(2):152–169.
- Shah ND, Ventura-Cots M, Abraldes JG, et al. Alcohol-related liver disease is rarely detected at early stages compared with liver diseases of other etiologies worldwide. Clin Gastroenterol Hepatol. 2019;17(11):2320–2329.e12.
- Fuster D, Samet JH. Alcohol use in patients with chronic liver disease. N Engl J Med. 2018;379(13):1251–1261.
- Singal AK, Bataller R, Ahn J, et al. ACG clinical guideline: alcoholic liver disease. Am J Gastroenterol. 2018;113(2):175–194.
- Kong LZ, Chandimali N, Han YH, et al. Pathogenesis, early diagnosis, and therapeutic management of alcoholic liver disease. IJMS. 2019;20(11):2712.
- European Association for Study of Liver; Asociacion Latinoamericana para el Estudio del Higado. EASL-ALEH clinical practice guidelines: non-invasive tests for evaluation of liver disease severity and prognosis. J Hepatol. 2015;63:237–264.
- Rinschen MM, Ivanisevic J, Giera M, et al. Identification of bioactive metabolites using activity metabolomics. Nat Rev Mol Cell Biol. 2019;20(6):353–367.
- Bujak R, Struck-Lewicka W, Markuszewski MJ, et al. Metabolomics for laboratory diagnostics. J Pharm Biomed Anal. 2015;113:108–120.
- Voutilainen T, Karkkainen O. Changes in the human metabolome associated with alcohol use: a review. Alcohol Alcohol. 2019;54(3):225–234.
- Gao B, Zhu Y, Gao N, et al. Integrative analysis of metabolome and microbiome in patients with progressive alcohol-associated liver disease. Metabolites. 2021;11(11):766.
- Loftfield E, Stepien M, Viallon V, et al. Novel biomarkers of habitual alcohol intake and associations with risk of pancreatic and liver cancers and liver disease mortality. J Natl Cancer Inst. 2021;113(11):1542–1550.
- Chinese Foundation for Hepatitis Prevention and Control; Chinese Society of Infectious Disease and Chinese Society of Hepatology, Chinese Medical Association, et al. Consensus on clinical application of transient elastography detecting liver fibrosis: a 2018 update. Zhonghua Gan Zang Bing Za Zhi. 2019;27:182–191.
- Guijas C, Montenegro-Burke JR, Domingo-Almenara X, et al. METLIN: a technology platform for identifying knowns and unknowns. Anal. Chem. 2018;90(5):3156–3164.
- Jia R, Chen Q, Zhou Q, et al. Characteristics of serum metabolites in sporadic amyotrophic lateral sclerosis patients based on gas chromatography-mass spectrometry. Sci Rep. 2021;11(1):20786.
- Johnson CH, Ivanisevic J, Siuzdak G. Metabolomics: beyond biomarkers and towards mechanisms. Nat Rev Mol Cell Biol. 2016;17(7):451–459.
- Xie G, Zhong W, Li H, et al. Alteration of bile acid metabolism in the rat induced by chronic ethanol consumption. FASEB J. 2013;27(9):3583–3593.
- Stroeve JH, Brufau G, Stellaard F, et al. Intestinal FXR-mediated FGF15 production contributes to diurnal control of hepatic bile acid synthesis in mice. Lab Invest. 2010;90(10):1457–1467.
- Ticho AL, Malhotra P, Dudeja PK, et al. Intestinal absorption of bile acids in health and disease. Compr Physiol. 2019;10(1):21–56.
- Wu W, Zhu B, Peng X, et al. Activation of farnesoid X receptor attenuates hepatic injury in a murine model of alcoholic liver disease. Biochem Biophys Res Commun. 2014;443(1):68–73.
- Chanda D, Kim YH, Li T, et al. Hepatic cannabinoid receptor type 1 mediates alcohol-induced regulation of bile acid enzyme genes expression via CREBH. PLoS One. 2013;8(7):e68845.
- Miura T, Tachikawa M, Ohtsuka H, et al. Application of quantitative targeted absolute proteomics to profile protein expression changes of hepatic transporters and metabolizing enzymes during cholic acid-promoted liver regeneration. J Pharm Sci. 2017;106(9):2499–2508.
- Kakiyama G, Pandak WM, Gillevet PM, et al. Modulation of the fecal bile acid profile by gut microbiota in cirrhosis. J Hepatol. 2013;58(5):949–955.
- Ridlon JM, Harris SC, Bhowmik S, et al. Consequences of bile salt biotransformations by intestinal bacteria. Gut Microbes. 2016;7(1):22–39.
- Bajaj JS. Alcohol, liver disease and the gut microbiota. Nat Rev Gastroenterol Hepatol. 2019;16(4):235–246.
- Gong X, Zhang Q, Ruan Y, et al. Chronic alcohol consumption increased bile acid levels in enterohepatic circulation and reduced efficacy of irinotecan. Alcohol Alcohol. 2020;55(3):264–277.
- Ciocan D, Spatz M, Trainel N, et al. Modulation of the bile acid enterohepatic cycle by intestinal microbiota alleviates alcohol liver disease. Cells. 2022;11(6):968.
- Sang C, Wang X, Zhou K, et al. Bile acid profiles are distinct among patients with different etiologies of chronic liver disease. J Proteome Res. 2021;20(5):2340–2351.
- Talwalkar JA, Kurtz DM, Schoenleber SJ, et al. Ultrasound-based transient elastography for the detection of hepatic fibrosis: systematic review and meta-analysis. Clin Gastroenterol Hepatol. 2007;5(10):1214–1220.