
Abstract
Background and aims
Accurate biomarkers for quantifying liver fibrosis are important for clinical practice and trial end-points. We compared the diagnostic performance of magnetic resonance imaging (MRI), including gadoxetate-enhanced MRI and 31P-MR spectroscopy, with fibrosis stage and serum fibrosis algorithms in a clinical setting. Also, in a subset of patients, MR- and transient elastography (MRE and TE) was evaluated when available.
Methods
Patients were recruited prospectively if they were scheduled to undergo liver biopsy on a clinical indication due to elevated liver enzyme levels without decompensated cirrhosis. Within a month of the clinical work-up, an MR-examination and liver needle biopsy were performed on the same day. Based on late-phase gadoxetate-enhanced MRI, a mathematical model calculated hepatobiliary function (relating to OATP1 and MRP2). The hepatocyte gadoxetate uptake rate (KHep) and the normalised liver-to-spleen contrast ratio (LSC_N10) were also calculated. Nine serum fibrosis algorithms were investigated (GUCI, King’s Score, APRI, FIB-4, Lok-Index, NIKEI, NASH-CRN regression score, Forns' score, and NAFLD-fibrosis score).
Results
The diagnostic performance (AUROC) for identification of significant fibrosis (F2–4) was 0.78, 0.80, 0.69, and 0.78 for MRE, TE, LSC_N10, and GUCI, respectively. For the identification of advanced fibrosis (F3–4), the AUROCs were 0.93, 0.84, 0.81, and 0.82 respectively.
Conclusion
MRE and TE were superior for non-invasive identification of significant fibrosis. Serum fibrosis algorithms developed for specific liver diseases are applicable in this cohort of diverse liver diseases aetiologies. Gadoxetate-MRI was sufficiently sensitive to detect the low function losses associated with fibrosis. None was able to efficiently distinguish between stages within the low fibrosis stages.
Excessive accumulation of scar tissue, fibrosis, in the liver is an important aspect in chronic liver disease. To replace the invasive needle biopsy, we have explored non-invasive methods to assess liver fibrosis. In our study we found that elastographic methods, which assess the mechanical properties of the liver, are superior in assessing fibrosis in a clinical setting. Of interest from a clinical trial point-of-view, none of the tested methods was sufficiently accurate to distinguish between adjacent moderate fibrosis stages.
Lay summary
Introduction
Chronic liver disease (CLD) is one of the leading causes of public health burden in the Western world [Citation1]. During the last decade, the global burden of liver disease has increased by 10.3%, with a consequential increase in liver cancer of 11.5% [Citation2]. The most common causes of CLD in Europe and the US are alcoholic liver disease (ALD), hepatitis C virus (HCV) infection, and non-alcoholic fatty liver disease (NAFLD) [Citation3]. Data from the National Health and Nutrition Examination Surveys have shown that the overall prevalence of CLD in the US rose from 12% to 15% between 1988 and 2008, mainly attributable to NAFLD, while ALD and HCV infection remained stable [Citation4]. In a large recent US multi-ethnic study, NAFLD was found to be the main aetiology of CLD, constituting 51.7% of all cases of cirrhosis followed by ALD (20.7%) and HCV (8.6%) [Citation5].
Liver fibrosis is the result of excessive accumulation of extracellular matrix. Advanced liver fibrosis ultimately results in cirrhosis, liver failure, and portal hypertension, with the risk of decompensation and development of hepatocellular carcinoma (HCC) [Citation6]. Decompensation is associated with lower survival rates [Citation7], and a liver transplant is often seen as the only effective treatment [Citation8]. The risk of developing cirrhosis differs between different causes of CLD, although irrespective of aetiology, the histopathological fibrosis stage portends a dismal prognosis with an increased risk of HCC as well as liver-related and all-cause mortality [Citation9].
With the rise of NAFLD as one of the leading causes of CLD worldwide, there are large ongoing efforts in developing new treatments. These treatments are aimed at a range of aspects of NAFLD including the underlying metabolic disorder driving the disease, liver steatosis, and liver fibrosis. Consequently, staging liver fibrosis is important in all clinical NAFLD trials. Reduction of fibrosis stage or lower rate of fibrosis progression are pivotal outcomes in most studies [Citation10,Citation11]. For that reason, it is important to be able to stage fibrosis more accurately than what has been possible previously. The current 'gold standard' for staging liver fibrosis is a liver needle biopsy (). However, the liver biopsy is associated with several limitations, including the risk for serious complications during the procedure, inter- and intraobserver variability, sampling error and, sampling variability [Citation12–17].
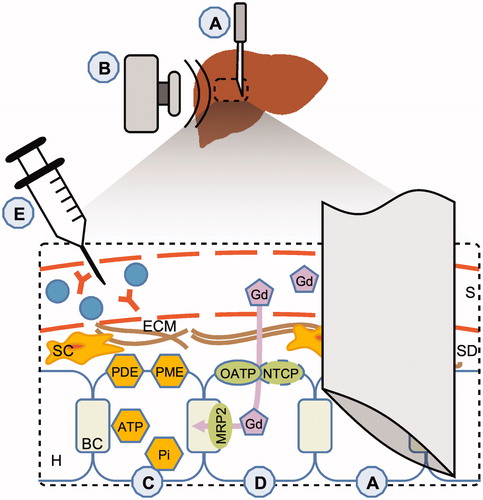
Figure 1. Description of fibrosis biomarkers. (A) The gold standard for staging liver fibrosis – liver needle biopsy – involves the use of a needle to remove a specimen of liver tissue. (B) Elastographic methods apply mechanical force to the subject which propagates into the liver tissue; a soft, healthy liver dampens the waves quickly, whereas a stiff, fibrotic liver allows the waves to propagate with less hindrance. The wave propagation is analysed, and the elasticity or stiffness can be calculated. (C) Phosphorus spectroscopy (31P-MRS) enables phosphodiesters (PDE) and phosphomonoesters (PME) to be measured in the cell membrane, as well as ATP and inorganic phosphate (Pi) in the cells; PME and PDE reflect cell turnover. (D) The MR contrast agent gadoxetate ('Gd') is accumulated in the hepatocyte via OATP1 and to some extent NTCP. Gadoxetate is subsequently excreted into the bile canaliculi via MRP2. These transporters all play crucial physiological roles. Gadoxetate increases the signal intensity in MR images, and a series of late-phase images can be used to estimate the function of OATP1 and MRP2 in some analysis methods; there are also methods of analysis which produce qualitative measures. (E) Blood samples can be used to quantify antibodies, enzymes and other metabolites which can be used in combinational scores and omics; these either directly or indirectly couple to the fibrotic processes. S: sinusoid; SD: space of Dissé; ECM: extracellular matrix; SC: Stellate cells; BC: bile canaliculi; H: hepatocyte. Colour version of the figure is available in the online version.
Liver fibrosis can be assessed with both direct and indirect methods. One such method is to combine serum markers in fibrosis algorithms () (Citation18–23). An innate limitation of serum markers is that they do not directly measure extracellular matrix turnover and/or fibrogenic cell changes, instead they reflect an impaired function of the liver. More direct assessment of the liver is possible by the use of imaging modalities. These modalities allow for assessing mechanical, metabolic, and functional aspects of the liver parenchyma as well as morphology. The mechanical properties of the liver can be measured with elastographic imaging methods, which measure the increasing stiffness of the liver due to fibrous tissue. Two commonly-used elastographic modalities are transient elastography (TE; ultrasound-based) and magnetic resonance elastography (MRE; ) [Citation24–26]. In addition, MR can be utilized for metabolic investigation of the liver by performing 31Phosphorus-MR spectroscopy (31P-MRS; ), which has shown promise in assessing the degree of hepatic fibrosis and cirrhosis [Citation27,Citation28]. Functional aspects of the liver parenchyma can be assessed using gadoxetate-enhanced MR-imaging (MRI), which has been shown to correlate with liver fibrosis [Citation29,Citation30]. Specifically, gadoxetate-enhanced MRI can, depending on the data and analysis method, be used to quantify the function of the organic anion-transporting protein 1 (OATP1) family of transporters and in some cases also multidrug resistance-associated protein 2 (MRP2) () [Citation30,Citation31]. Contrast agent enhancement ratios have also shown promising diagnostic performance [Citation32].
In a clinical setting, physicians encounter various liver disease aetiologies, as well as different stages of fibrosis, and in such a setting it is important to be able to dichotomise liver fibrosis, in particular of the lower stages. Hitherto there have only been a limited number of studies in combination with liver histopathology assessment that were performed in a prospective manner. In this prospective study, our primary aim was to compare 31P-MRS, late-phase gadoxetate-enhanced MRI, and serum fibrosis algorithms with histopathology for staging liver fibrosis in a clinical setting, involving patients with suspected liver disease. In a subset of patients, elastography (TE and MRE) was performed and evaluated as non-invasive biomarkers of liver fibrosis.
Patients and methods
Patients
Between 2007 and 2014, patients were recruited as they were referred to the Department of Gastroenterology and Hepatology at the University Hospital in Linköping for chronically (>6 months) elevated levels of alanine aminotransferase (males >71 U/L; females >45 U/L), and/or aspartate aminotransferase (males >45 U/L; females >36 U/L), and/or serum alkaline phosphate (>106 U/L). At enrolment, an extensive diagnostic work-up was performed as previously described [Citation33], and all patients, who required a liver biopsy on clinical indication, were asked to participate in this study.
Exclusion criteria were contraindications for MR-examination and liver biopsy. Contraindication for MRI included the presence of pacing devices, implants with ferromagnetic properties, pregnancy, and claustrophobia. Contraindications for liver biopsy were the presence of primary or secondary coagulative disorder, prothrombin time >1.5 INR, platelet count <50 × 109 platelets/L, hepatic malignancy, and definite signs of cirrhosis
The sample size was decided following power calculations using 31P-MRS on the separation of mild from advanced hepatic fibrosis in patients suffering from CLD [Citation27]. The study was approved by the regional ethics committee (Ref. M72-07 T5-08). All patients gave written informed consent to participate before they were included in this study.
Transient elastography
TE was performed by an experienced hepatologists (P. N., M. E., and S. K.) or specialist nurse using FibroScan® (Echosens) during the clinical work-up. Subjects were asked to fast ≥3 h prior to the examination. The procedure was performed in a supine position with the right arm abducted and placed under their heads. The probe was applied over the area of the right liver lobe, and a minimum of 10 measurements were made to obtain the median valid liver stiffness in kilopascals (kPa) and interquartile range (IQR). Based on the manufacturer’s recommendation, all patients were first scanned by applying the M-probe. If failure to obtain values or if a non-representative image was observed, the XL-probe was applied. Technical failure was defined as obtaining no stiffness measurements or unreliable measurements and was defined as a success rate <60% and/or an IQR >30% [Citation34]. However, no readings were unreliable in the patients eligible for inclusion.
Magnetic resonance
Within a month of the clinical work-up, on the same day as the liver biopsy, the MR-examination was performed using a Philips Achieva 1.5 T MR-scanner (Philips Healthcare, Ville Platte, LA).
MRE was performed as previously described [Citation35]: an electromagnetic active elastography transducer was used, operating at 56 Hz. A 3D image was acquired in four breath-holds. Nine slices were acquired, each with a thickness of 4 mm with full, in-plane liver coverage. Regions of interest (ROIs) were drawn on the reconstructed image maps by an experienced radiologist (N. D.), and the mean shear elasticity was calculated in kPa for the right liver lobe. Representative examples of the quantified elastograms are shown in .
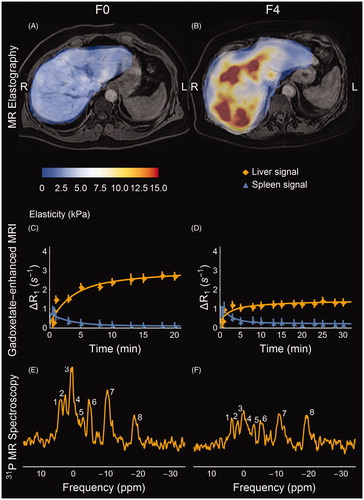
Figure 2. MR-based biomarkers for a non-fibrotic (A, C, E) and a cirrhotic (B, D, F) NAFLD patient. (A, B) MR shear-wave elastograms at 56 Hz. The elastograms are superimposed on water-only gadoxetate-enhanced Dixon images. (A) shows the homogenously soft tissue in the non-fibrotic liver compared to (B), in which the excessive fibrous tissue is apparent both in terms of absolute values and in heterogeneity. (C, D) Relative induced change in relaxivity due to the presence of the MR contrast agent gadoxetate in the liver and the spleen respectively, proportional to the concentration of gadoxetate. The solid lines represent the predictions made by the mathematical model describing the function of the OATP1 and MRP2 transporter proteins in the hepatocytes. As can be seen the cirrhotic liver accumulates much less gadoxetate within the liver parenchyma than the non-fibrotic liver. (E, F) 31P-MR spectral assignments with (1) phosphomonoesters (PME); (2) inorganic phosphate (Pi); (3) phosphodiesters (PDE); (4) membrane phosphates (MP); (5) trace of phosphocreatine originating from surrounding muscle tissue; (6–8) nucleotidetriphosphate (γ-NTP, α-NTP, β-NTP, mainly Mg-ATP); at the up-field base of resonance (7) NAD(H) is also present. As can be seen, PME increases and PDE decreases in the cirrhotic patient; these are combined into 'anabolic charge' (AC). Colour version of the figure is available in the online version.
Late-phase gadoxetate-enhanced MRI was acquired and post-processed as previously described [Citation29,Citation36]. The data were analysed using the model by Forsgren et al. [Citation31] as described in [Citation36]. An example of the induced change in relaxivity is shown in . ROIs were drawn in the liver (n = 7) and the spleen (n = 3) by experienced radiologists for the subsequent quantitative analysis (N. D. and B. N.). The model parameters describe the hepatocyte gadoxetate uptake rate by the OATP1 transporters (kph) and the biliary excretion rate by the MRP2 transporter (khb) [Citation31]. The hepatic accumulation (KHep) rate was calculated as previously described [Citation32]. The liver-to-spleen contrast ratio at 10 min (LSC10) and the normalized ratio (LSC_N10) were also calculated as previously described [Citation32].
The 31P-MRS was performed using a flat, non-flexible 12 cm circular single tuned surface coil (‘P-120’, Philips Healthcare, Ville Platte, LA). The localised hepatic spectra were acquired using ISIS volume selection (7 s repetition time; 1024 data points; 5 kHz spectral width; 192 averages; volume 60 × 60 × 40 mm3). The MRS data were post-processed and analysed for phosphomonoesters (PME), phosphodiester (PDE), and the anabolic charge (AC) was calculated (AC = PME/(PME + PDE incl. MP)) as previously described [Citation27,Citation37], using jMRUI with the AMARES algorithm [Citation38,Citation39]. The spectral analysis was performed by an experienced MR physicist (MFF). The spectral assignments are exemplified in .
Serum fibrosis algorithms
APRI, FIB-4, GUCI, NAFLD Fibrosis Score (‘NFS’), NIKKEI, King’s score, Lok Index, Forn’s score, and NASH-CRN Regression Score (‘NCRS’) were calculated as previously described [Citation20].
Liver needle biopsy and histopathology
Within one hour after the MR-examination, a liver needle biopsy was performed on an outpatient basis. It was performed percutaneously using a 1.6 mm BioPince needle (Argon Medical Devices) in the right liver lobe. An experienced histopathologist (SI) graded and classified the biopsies according to the Batts and Ludwig system [Citation40], fibrosis stage was defined accordingly: no fibrosis (F0), portal and/or perisinusoidal fibrosis (F1), periportal and perisinusoidal fibrosis (F2), bridging fibrosis (F3), or probable or obvious cirrhosis (F4). The inflammation grades determined by histopathology were stratified into two groups: (0) None to mild inflammation and (1) Moderate to pronounced inflammation, including any stage of lobular inflammation and/or periportal inflammation above grade 1.
Statistics
χ2-test, Student’s t-test, and Mann–Whitney U-test were used to investigate group differences where applicable, the latter two depending on whether the criterion for normality and equal variance were fulfilled. Area under the receiver-operator characteristics curve (AUROC) was used to investigate diagnostic performance. ANOVA was used to investigate potential confounders and the ability of the biomarkers to distinguish between fibrosis stages. In the ANOVA analysis, inflammation and the liver disease aetiology were investigated as potential confounders. The diagnosis groups (based on the clinical and histopathological evaluation) were defined as: (0) Normal (n = 8), (1) NAFLD and ALD (n = 36), (2) HCV (n = 8), (3) primary sclerosing cholangitis (PSC) and PBC (n = 17), (4) autoimmune hepatitis (AIH; n = 12), and (5) Other diseases which were not sufficiently numerous for accurate statistical testing (n = 9).
Wolfram Mathematica (v11.0.1, Wolfram Research Inc., Champaign, IL) and IBM SPSS (v24, IBM Corp., Armonk, NY) were used for the statistical calculations.
Results
Subjects
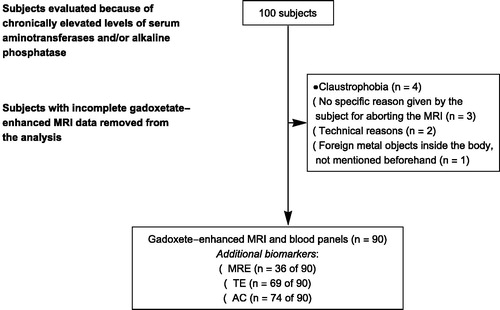
A total of 90 subjects underwent liver biopsy and had complete gadoxetate-enhanced MRI and serum fibrosis algorithms. The time between the clinical work-up (including serum fibrosis markers and TE), and MRI/liver biopsy was less than three months for most patients. shows the number of subjects removed from the analysis due to in-complete gadoxetate-enhanced MRI. In addition, for logistical reasons, TE was acquired in 73 subjects. MRE was available at the hospital in 2012, so a total of 36 subjects were investigated using MRE. Some 31P-MRS examinations were unfortunately lost due to multinuclear hardware failure in 2009, and this meant that only a total of 74 subjects had complete 31P-MRS data.
Figure 3. Data availability.
Demographic, clinical, biochemical, and histological data are presented in , and the diagnosis ‘normal’ is used where the liver biopsy showed normal histological features. There was no significant difference between subjects with advanced fibrosis in terms of BMI, gender distribution, age, and diabetes. None of the subjects had decompensated liver disease.
Table 1. Demographics, laboratory characteristics, diagnosis of the cohort.
Association with the stage of fibrosis, inflammation grade, and liver disease aetiology
ANOVA was performed on all evaluated methods to assess confounders. While fibrosis stage was included in the ANOVA model, both diagnosis and inflammation were found to be insignificantly associated with most of the biomarkers. For these biomarkers fibrosis stage was significant with the following p-values: MRE (p < .001), TE (p < .001), 31P-MRS (AC; p = .015), OATP1 function (kph; p < .001), MRP2 function (khb; p < .001), LSC_N10 (p < .001), GUCI (p < .001), King’s Score (p < .001), APRI (p < .001), FIB-4 (p < .001), Lok Index (p < .001), NIKEI (p = .001), NCRS (p < .001), and Forn’s Score (p = .005).
Three methods were found to be significantly influenced by both fibrosis stage and diagnosis groups: KHep (fibrosis stage p = .002; diagnosis group p = .046), LSC_10 (p < .001; p = .004), and NFS (p = .049; p = .002). Tukey’s post-test indicated significant differences in diagnosis groups for LSC_10 (NAFLD versus Normal, and PBC/PSC) as well as NFS (NAFLD versus PBC/PSC, and AIH). No specific disease group was uniquely identified according to Tukey’s post-test for KHep.
The MRE, 31P-MRS, and gadoxetate-enhanced methods stratified by fibrosis stage are shown in . Each panel includes the shortest identifiable group difference in Tukey’s post-test in an ANOVA analysis, as well as the number of subjects in each stage of fibrosis. The corresponding information for the serum algorithms is shown in .
Figure 4. Fibrosis biomarkers stratified by the stage of fibrosis (F0–4). The asterisks represent Tukey’s post-test at α = 0.05*, 0.01**, 0.001*. (A, B) shows the ultrasound and MR based elastography biomarkers. The 31P-MRS-based anabolic charge is shown in (C). (D, E) shows the parameter representing the function of OATP1 and MRP2, derived from model-based analysis of gadoxetate-enhanced MRI. (H) shows the hepatic accumulation rate, and (F, G) shows the ratios between the liver and spleen at 10 min all of which are also based on gadoxetate-enhanced MRI. Colour version of the figure is available in the online version.
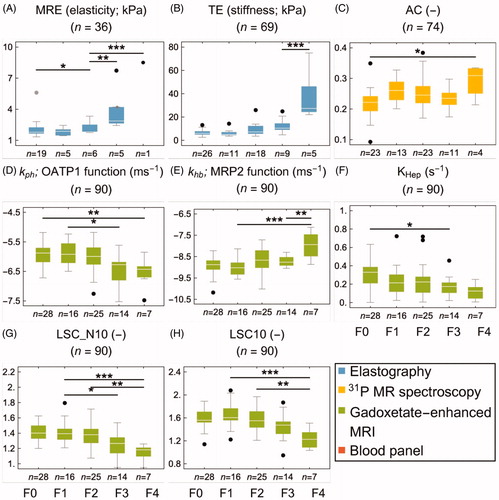
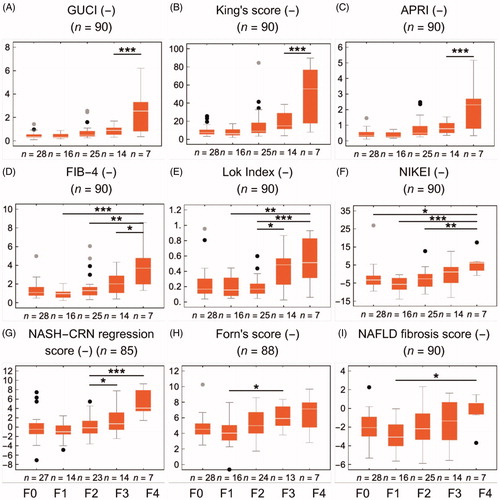
Figure 5. Fibrosis biomarkers stratified by the stage of fibrosis (F0–4). The asterisks represent Tukey’s post-test at α = 0.05*, 0.01**, 0.001*. (A–I) shows nine commonly used blood panel scores. Colour version of the figure is available in the online version.
Identification of fibrosis (F0 versus F1–4)
MRP2 function (khb), LSC_N10, and KHep all had significant AUROC values in the range of 0.63–0.74. TE and AC were significantly able to detect fibrosis with AUROC values of 0.65 and 0.70, respectively. Some serum fibrosis algorithms were found to identify fibrosis, with significant AUROC values for King’s score and the two related scores APRI and GUCI ranging from 0.64 to 0.69. None of the biomarkers were able to distinguish between F0 and F1, but MRE was able to distinguish between F0 and F2 ( and ; and ).
Table 2. Receiver-operator characteristics and cut-point values for each fibrosis biomarker.
Identification of significant fibrosis (F0–1 versus F2–4)
All the gadoxetate-based methods could identify significant fibrosis, with similar AUROC values ranging from 0.67 to 0.71. The OATP1 function (kph) and LSC_N10 were able to distinguish between F1 and F3. Both elastography methods showed high AUROC values in the range of 0.78–0.80. 31P-MRS (AC) was not able to identify significant fibrosis. All serum fibrosis algorithms, except for the NFS and Lok Index, presented significant AUROC values (0.67–0.78), with the highest values for APRI and GUCI. Although it was unable to detect significant fibrosis, Forn’s score could distinguish between F1 and F3 ( and ; and ).
Identification of advanced fibrosis (F0–2 versus F3–4)
Advanced fibrosis could be identified with all the gadoxetate-based methods, with AUROC values in the range of 0.68–0.81; LSCN_10 had the highest AUROC value. Sensitivities were 71% for all gadoxetate-based methods, and specificity varied between them: LSC_N10 had the highest specificity of 80%, closely followed by the OATP1 function (kph) with 75%. The elastographic methods showed the highest AUROC values of all biomarkers, with 0.93 for MRE and 0.84 for TE. MRE had the highest sensitivity and specificity of all methods (83% and 90%), closely followed by TE (86% and 84%). MRE could also uniquely distinguish between F2 and F3. AC (by 31P-MRS) was not able to identify advanced fibrosis. All serum fibrosis algorithms presented significant AUROC values (0.67–0.82), with APRI, GUCI, and King’s generating values >0.80. Except for Forn’s score (sensitivity of 65%), all blood panels had a sensitivity of 71%. Forn’s score, King’s score, and APRI all presented a specificity of 78%. Both Lok Index and NCRS could distinguish between F2 and F3 ( and ; and ).
Discussion
In this prospective study, we have evaluated the diagnostic performance of a wide range of MRI-based methods, TE, as well as serum fibrosis algorithms for staging liver fibrosis in liver disease with various aetiologies and fibrosis stages. Several of the methods were found to be sensitive to advanced fibrosis stages. Staging liver fibrosis is important in all clinical NAFLD trials and a reduction of fibrosis stage or lower rate of fibrosis progression is pivotal outcomes in most studies [Citation10]. In this study, we show that none of the used methods were sufficient for distinguishing between adjacent fibrosis stages based on same-day histopathology determined fibrosis stages. Overall, the elastographic methods generated the highest diagnostic accuracy. Gadoxetate-enhanced MRI ratios performed equally well as certain serum fibrosis algorithms (with respect to advanced fibrosis stage). However, the ability by Gadoxetate-enhanced MRI in dichotomising low-to-advanced stages of fibrosis outperformed the best serum fibrosis algorithms which were only able to discriminate between advanced stages. None of the included subjects had decompensated cirrhosis, and all but one had Child-Pugh class A. The gadoxetate-enhancement function methods were also able to detect the reduction in hepatocyte function (OATP1 and MRP2 transfer rates) associated with the disease processes indicated by the stages of fibrosis. Another finding was also that the best-performing serum fibrosis algorithms (APRI, King’s Score, and GUCI), which were originally developed for HCV aetiology, were able to identify fibrosis successfully in this cohort of mixed aetiologies.
The AUROCs for the elastographic methods were overall high in terms of detecting fibrosis. MRE had higher specificity than TE in terms of discriminating advanced fibrosis; it was also able to dichotomise in-between, intermediate levels of fibrosis. The optimal 'MRE-elasticity' cut-point for advanced fibrosis was 2.60 kPa, which is somewhat lower than previously reported values (3.13 kPa) with a similar implementation of the MRE method [Citation41]. The elasticity cut-point of 2.60 kPa is approximately equivalent to an 'MRE-stiffness' value of 4.39 kPa [Citation35], which is close to previously reported stiffness cut-points (4.07 and 5.05 kPa) using a passive acoustic MRE driver with a 2D MR-acquisition [Citation25,Citation42]. The AUROC values for MRE (0.93) were consistent with previous MRE findings of 0.90, 0.99, and 0.94, and meta-analysis findings of 0.92 [Citation25,Citation41–43]. The optimal TE-stiffness cut-point was higher (10.15 kPa) than reported from mixed and pure NAFLD cohorts (8.60 kPa [Citation25], and 7.30 kPa [Citation26], respectively), as well as by meta-analysis 7.65 kPa [Citation44]. However, in a recent study by Eddowes et al. [Citation45], an estimated cut-off of 9.7 kPa with TE for diagnosing fibrosis stage >2 had a negative and positive predictive value (NPV and PPV) of 92 and 38%, respectively, if an estimated prevalence of advanced fibrosis was 18%. Similarly, among the 73 patients that underwent TE, the prevalence of advanced fibrosis according to histology was 19.2%. At a cut-off of 10.15 kPa the NPV and PPV was 96 and 55%. Moreover, TE has displayed varying accuracy in diagnosing advanced fibrosis; in HCV [Citation46] and PBC/PSC [Citation47] cohorts an AUROC of 0.95 was found, slightly lower accuracy in mixed and in pure NAFLD cohorts (0.77 [Citation25] and 0.80 [Citation26], respectively), and by meta-analysis 0.89 [Citation44]. Our AUROC of 0.84 for detecting advanced fibrosis using TE agrees with previous studies.
The application of TE is considered to be a challenge in obese subjects, although improvements have been made to alleviate this. In contrast, obesity is of negligible concern for MRE [Citation48,Citation49]. In this study, it was not feasible to assess the validity of assessing fibrosis with either of the two elastography methods in subjects with obesity, as only eight of the subjects that underwent an MRE examination had a BMI > 25 kg/m2.
The AC measured with 31P-MRS showed significant differences between non-fibrotic and cirrhotic livers, which is in line with previous studies [Citation27,Citation28]. Godfrey et al. did not find the PME/PDE ratio to be better than chance for the detection of fibrosis [Citation42]. A difference between Godfrey’s study and ours is that the former did not use localised acquisition, which could have led to distortions in the concentrations due to contaminating signals from metabolites originating from muscle tissue. However, in the intermediate stages of fibrosis the AUROC values (for fibrosis) were not better than chance in this cohort, in agreement with Godfrey et al. [Citation42]. AC is probably not suitable for distinguish between stages of fibrosis in this cohort as it did not have decompensated cirrhosis, although it could be interesting for investigating other pathological aspects of liver disease-processes relating to tissue regenerative capacity in scientific explorations.
The functional aspects of the liver parenchyma, measured by quantifying the transfer of gadoxetate, were successful in identifying advanced fibrosis. It is apparent that LSC_N10 is superior to LSC_10 in detecting fibrosis. Few studies use LSC_N10 to make direct comparisons. A pilot study reported that subjects with no or mild manifestations of hepatobiliary disease processes had a value of 1.33, and subjects with hepatobiliary diseases which probably affect hepatobiliary function, but which have no major biliary obstruction (such as severe cirrhosis, thromboses, and PSC) had a value of 1.05 [Citation32]. These values are in line with the optimal LSC_N10 cut-point of 1.28 for advanced fibrosis, which was found in this study. The ratio-based methods are clearly affected by the vasculature of both liver and spleen and are consequently highly sensitive to perfusion differences and altered compartment size associated with fibrosis. In contrast, the hepatocyte uptake rate (KHep) and model-based quantification of late-phase gadoxetate transfer rates (OATP1 and MRP2 function) accounts for the vascular compartments of the organs [Citation31,Citation32]. In a pilot study, KHep was reported with a value of 0.24 s−1 in subjects with mild or no hepatobiliary disease processes and subjects with hepatic or biliary disease, had a value of 0.09 s−1 [Citation32]. In our study, 0.21 s−1 was found to be an optimal cut-point for advanced fibrosis. The more advanced quantification of hepatic transfer of gadoxetate presented a mixed view. The hepatocyte accumulation rate (via OATP1) was significantly reduced in subjects with cirrhosis. It was possible to differentiate between low and advanced stages of fibrosis using the hepatic accumulation rate. The biliary excretion rate (via MRP2) was unaffected in moderate stages of fibrosis, and drastically increased in cirrhosis. Previously, we have reported that there is no visually reduced enhancement in the common bile duct in cirrhosis [Citation50], and the increased excretion rate observed here could be related to these findings. The AUROC levels were 0.76 and 0.68, which is slightly lower than in a recently published study, where an AUROC of 0.84 was found by quantifying the accumulation rate using a perfusion-style approach [Citation30]. Fibroneogenesis is not causally connected to the function of neither OATP1 nor MRP2, and the measures of hepatic function that were used here may therefore not be best suited for identifying fibrosis per se, in particular as there is only limited loss of function in the early stages of fibrosis. However, the measures of hepatic function were nevertheless sufficiently sensitive to determine a consequential low functional loss, caused by the formation of fibrosis. We, therefore, believe that functional assessment, as reflected by gadoxetate uptake and excretion, will be very useful for investigating the functional reserve when for instance planning resective surgery, or transplantation. Such measures will also provide information on the additional functional constraints imposed by fibrosis.
We included nine serum fibrosis algorithms. Three of them were developed in NAFLD (NFS, NIKEI, and NCRS) and six in HCV infection (APRI, FIB-4, GUCI, Lok Index, Forn’s score, King’s score). Although only 9% of our cohort consisted of subjects with HCV infection, APRI, King’s score, and GUCI showed adequate accuracy in diagnosing advanced fibrosis in this cohort of varied liver disease aetiology (with AUROC values of 0.80–0.82). In contrast, even though 38% of our cohort had NAFLD, NFS, NIKEI, and NCRS did not perform well. These findings are in line with a recent study which showed that FIB-4 and King’s score were superior in diagnosing advanced fibrosis in a pure NAFLD cohort [Citation20]. The results are also slightly higher than another mixed cohort in which APRI was found to have an AUROC of 0.71, with similar optimal cut-point values of 0.84 [Citation25] compared to our cut-point of 0.71. However, in a study by Angulo et al., NAFLD fibrosis scores were shown to be superior in predicting mortality and liver-related events in NAFLD patients, compared to APRI and FIB-4 [Citation51]. The findings in this study, and in Lykiardopoulos et al. [Citation20], indicate that King’s score or similar scores (GUCI and APRI) might be suitable for the detection of advanced fibrosis in cohorts with liver disease of mixed aetiologies.
There are some limitations to our study. First, the number of subjects with advanced fibrosis was limited, although this was a natural consequence of the prospective nature of this study (as it involved a cross-section of patients referred to our hospital). Second, hepatocyte transporters such as MRP2 have altered expression levels in a range of diseases including PSC [Citation52]. This may have affected the results, although no significant differences were observed when correcting for aetiology groups. Third, a limited number of subjects were investigated using MRE, making direct comparisons with the other biomarkers less straightforward. Fourth, although not apparent, the extended data acquisition period (6 years) could potentially have affected the integrity of MR-data, although the same dedicated research scanner was used throughout the study. Fifth, due to lack of sufficient procedural experience there was no image-fusion-based co-localization of the biopsy with the MR-imaging measurements, and this could potentially have added to the spatial dispersion due to the heterogenic nature of the disease. Sixth, as with all studies using liver biopsy as gold standard sampling error, as well as inter- and intraobserver variability is a possibility.
In conclusion, in this prospective study with subsequent liver needle biopsies, we have confirmed that MRE was the most reliable procedure to determine advanced fibrosis. However, for dichotomising within moderate grades of fibrosis, which is of major interest in NAFLD clinical trials, none of the assessed methods were sufficiently accurate to detect single stage differences.
| Abbreviations | ||
| AC | = | anabolic charge |
| AIH | = | autoimmune hepatitis |
| ALD | = | alcoholic liver disease |
| ALP | = | alkaline phosphate |
| ALT | = | alanine aminotransferase |
| AST | = | aspartate aminotransferase |
| AUROC | = | area under the receiver operator characteristics |
| BMI | = | body mass index |
| CLD | = | chronic liver disease |
| HCV | = | hepatitis C virus |
| LSC | = | liver-to-spleen contrast ratio |
| MP | = | membrane protein |
| MR | = | magnetic resonance |
| MRE | = | magnetic resonance elastography |
| MRI | = | magnetic resonance imaging |
| MRP2 | = | multidrug resistance-associated protein 2 |
| MRS | = | magnetic resonance spectroscopy |
| NAFLD | = | non-alcoholic fatty liver disease |
| NCRS | = | NASH-CRN regression score |
| NFS | = | NAFLD fibrosis score |
| OATP1 | = | organic anion-transporting protein 1 |
| PDE | = | phosphodiester |
| PBC | = | primary biliary cholangitis |
| PME | = | phosphomonoester |
| PSC | = | primary sclerosing cholangitis |
| ROI | = | region of interest |
| TE | = | transient elastography |
Acknowledgements
The authors would like to thank Dr Örjan Smedby, Royal Institute of Technology, Stockholm, Sweden, for help and advice. The authors would also like to thank Dr Johan Kihlberg, Linköping University, Linköping, for assistance in setting up the MR protocols and collecting the MR data. Nicholas Kinnunen is gratefully acknowledged for his excellent and skilled support of data processing.
Disclosure statement
O. D. L. is a board member, shareholder, and employee at AMRA Medical AB. P. L. is a shareholder of AMRA Medical AB. M. F. F. was an employee at Wolfram MathCore AB during the project; he is currently an employee of AMRA Medical AB.
Additional information
Funding
References
- Williams R, Aspinall R, Bellis M, et al. Addressing liver disease in the UK: a blueprint for attaining excellence in health care and reducing premature mortality from lifestyle issues of excess consumption of alcohol, obesity, and viral hepatitis. Lancet. 2014;384(9958):1953–1997.
- Collaborators GMaCoD. Global, regional, and national age-sex specific all-cause and cause-specific mortality for 240 causes of death, 1990–2013: a systematic analysis for the Global Burden of Disease Study 2013. Lancet. 2015;385(9963):117–171.
- Asrani SK, Larson JJ, Yawn B, et al. Underestimation of liver-related mortality in the United States. Gastroenterology. 2013;145(2):375–382. e1–2.
- Younossi ZM, Stepanova M, Afendy M, et al. Changes in the prevalence of the most common causes of chronic liver diseases in the United States from 1988 to 2008. Clin Gastroenterol Hepatol. 2011;9(6):524–530.e1; quiz e60.
- Setiawan VW, Stram DO, Porcel J, et al. Prevalence of chronic liver disease and cirrhosis by underlying cause in understudied ethnic groups: the multiethnic cohort. Hepatology. 2016;64(6):1969–1977.
- Friedman SL. Liver fibrosis – from bench to bedside. J. Hepatol. 2003;38 (Suppl 1):S38–S53.
- Fleming KM, Aithal GP, Card TR, et al. All-cause mortality in people with cirrhosis compared with the general population: a population-based cohort study. Liver Int. 2012;32(1):79–84.
- Ge PS, Runyon BA. Treatment of patients with cirrhosis. N Engl J Med. 2016;375(8):767–777.
- Fattovich G, Stroffolini T, Zagni I, et al. Hepatocellular carcinoma in cirrhosis: incidence and risk factors. Gastroenterology. 2004;127(5 Suppl 1):S35–S50.
- Konerman MA, Jones JC, Harrison SA. Pharmacotherapy for NASH: current and emerging. J Hepatol. 2018;68(2):362–375.
- Sanyal AJ, Brunt EM, Kleiner DE, et al. Endpoints and clinical trial design for nonalcoholic steatohepatitis. Hepatology. 2011;54(1):344–353.
- Goldin RD, Goldin JG, Burt AD, et al. Intra-observer and inter-observer variation in the histopathological assessment of chronic viral hepatitis. J Hepatol. 1996;25(5):649–654.
- Kleiner DE, Brunt EM, Van Natta M, Nonalcoholic Steatohepatitis Clinical Research Network, et al. Design and validation of a histological scoring system for nonalcoholic fatty liver disease. Hepatology. 2005;41(6):1313–1321.
- Bedossa P, Dargère D, Paradis V. Sampling variability of liver fibrosis in chronic hepatitis C. Hepatology. 2003;38(6):1449–1457.
- Rousselet MC, Michalak S, Dupre F, et al. Sources of variability in histological scoring of chronic viral hepatitis. Hepatology. 2005;41(2):257–264.
- Piccinino F, Sagnelli E, Pasquale G, et al. Complications following percutaneous liver biopsy. A multicentre retrospective study on 68,276 biopsies. J Hepatol. 1986;2(2):165–173.
- Regev A, Berho M, Jeffers LJ, et al. Sampling error and intraobserver variation in liver biopsy in patients with chronic HCV infection. Am J Gastroenterol. 2002;97(10):2614–2618.
- Harrison SA, Oliver D, Arnold HL, et al. Development and validation of a simple NAFLD clinical scoring system for identifying patients without advanced disease. Gut. 2008;57(10):1441–1447.
- Angulo P, Hui JM, Marchesini G, et al. The NAFLD fibrosis score: a noninvasive system that identifies liver fibrosis in patients with NAFLD. Hepatology. 2007;45(4):846–854.
- Lykiardopoulos B, Hagström H, Fredrikson M, et al. Development of serum marker models to increase diagnostic accuracy of advanced fibrosis in nonalcoholic fatty liver disease: the New LINKI algorithm compared with established algorithms. PLoS One. 2016;11(12):e0167776.
- Wai CT, Greenson JK, Fontana RJ, et al. A simple noninvasive index can predict both significant fibrosis and cirrhosis in patients with chronic hepatitis C. Hepatology. 2003;38(2):518–526.
- Sterling RK, Lissen E, Clumeck N, APRICOT Clinical Investigators, et al. Development of a simple noninvasive index to predict significant fibrosis in patients with HIV/HCV coinfection. Hepatology. 2006;43(6):1317–1325.
- Islam S, Antonsson L, Westin J, et al. Cirrhosis in hepatitis C virus-infected patients can be excluded using an index of standard biochemical serum markers. Scand J Gastroenterol. 2005;40(7):867–872.
- Glaser KJ, Manduca A, Ehman RL. Review of MR elastography applications and recent developments. J Magn Reson Imaging. 2012;36(4):757–774.
- Dyvorne HA, Jajamovich GH, Bane O, et al. Prospective comparison of magnetic resonance imaging to transient elastography and serum markers for liver fibrosis detection. Liver Int. 2016;36(5):659–666.
- Park CC, Nguyen P, Hernandez C, et al. Magnetic resonance elastography vs transient elastography in detection of fibrosis and noninvasive measurement of steatosis in patients with biopsy-proven nonalcoholic fatty liver disease. Gastroenterology. 2017;152(3):598–607.e2.
- Noren B, Dahlqvist O, Lundberg P, et al. Separation of advanced from mild fibrosis in diffuse liver disease using 31P magnetic resonance spectroscopy. Eur J Radiol. 2008;66(2):313–320.
- Lim AK, Patel N, Hamilton G, et al. The relationship of in vivo 31P MR spectroscopy to histology in chronic hepatitis C. Hepatology. 2003;37(4):788–794.
- Noren B, Forsgren MF, Dahlqvist Leinhard O, et al. Separation of advanced from mild hepatic fibrosis by quantification of the hepatobiliary uptake of Gd-EOB-DTPA. Eur Radiol. 2013;23(1):174–181.
- Juluru K, Talal AH, Yantiss RK, et al. Diagnostic accuracy of intracellular uptake rates calculated using dynamic Gd-EOB-DTPA-enhanced MRI for hepatic fibrosis stage. J Magn Reson Imaging. 2016;45: 1177–1185.
- Forsgren MF, Dahlqvist Leinhard O, Dahlström N, et al. Physiologically realistic and validated mathematical liver model reveals [corrected] hepatobiliary transfer rates for Gd-EOB-DTPA using human DCE-MRI data. PLoS One. 2014;9(4):e95700.
- Dahlqvist Leinhard O, Dahlstrom N, Kihlberg J, et al. Quantifying differences in hepatic uptake of the liver specific contrast agents Gd-EOB-DTPA and Gd-BOPTA: a pilot study. Eur Radiol. 2012;22(3):642–653.
- Nasr P, Forsgren MF, Ignatova S, et al. Using a 3% proton density fat fraction as a cut-off value increases sensitivity of detection of hepatic steatosis, based on results from histopathology analysis. Gastroenterology. 2017;153(1):53–55.e7.
- Castera L, Forns X, Alberti A. Non-invasive evaluation of liver fibrosis using transient elastography. J Hepatol. 2008;48(5):835–847.
- Forsgren MF, Norén B, Kihlberg J, et al. Comparing hepatic 2D and 3D magnetic resonance elastography methods in a clinical setting – initial experiences. Eur J Radiol Open. 2015;2:66–70.
- Forsgren MF, Karlsson M, Dahlqvist Leinhard O, et al. Model-inferred mechanisms of liver function from magnetic resonance imaging data: validation and variation across a clinically relevant cohort Model-inferred mechanisms of liver function from magnetic resonance imaging data: validation and variation across a clinically relevant cohort. PLoS Comput Biol. 2019;15(6):e1007157.
- Norén B, Lundberg P, Ressner M, et al. Absolute quantification of human liver metabolite concentrations by localized in vivo 31P NMR spectroscopy in diffuse liver disease. Eur Radiol. 2005;15(1):148–157.
- Naressi A, Couturier C, Devos JM, et al. Java-based graphical user interface for the MRUI quantitation package. MAGMA. 2001;12(2–3):141–152.
- Vanhamme L,A, Vanhamme L, van den Boogaart A, et al. Improved method for accurate and efficient quantification of MRS data with use of prior knowledge. J Magn Reson. 1997;129(1):35–43.
- Batts KP, Ludwig J. Chronic hepatitis. An update on terminology and reporting. Am J Surg Pathol. 1995;19(12):1409–1417.
- Huwart L, Sempoux C, Vicaut E, et al. Magnetic resonance elastography for the noninvasive staging of liver fibrosis. Gastroenterology. 2008;135(1):32–40.
- Godfrey EM, Patterson AJ, Priest AN, et al. A comparison of MR elastography and 31P MR spectroscopy with histological staging of liver fibrosis. Eur Radiol. 2012;22(12):2790–2797.
- Wang QB, Zhu H, Liu HL, et al. Performance of magnetic resonance elastography and diffusion-weighted imaging for the staging of hepatic fibrosis: a meta-analysis. Hepatology. 2012;56(1):239–247.
- Friedrich-Rust M, Ong MF, Martens S, et al. Performance of transient elastography for the staging of liver fibrosis: a meta-analysis. Gastroenterology. 2008;134(4):960–974.
- Eddowes PJ, Sasso M, Allison M, et al. Accuracy of FibroScan controlled attenuation parameter and liver stiffness measurement in assessing steatosis and fibrosis in patients with nonalcoholic fatty liver disease. Gastroenterology. 2019;156(6):1717–1730.
- Castéra L, Vergniol J, Foucher J, et al. Prospective comparison of transient elastography, Fibrotest, APRI, and liver biopsy for the assessment of fibrosis in chronic hepatitis C. Gastroenterology. 2005;128(2):343–350.
- Corpechot C, El Naggar A, Poujol-Robert A, et al. Assessment of biliary fibrosis by transient elastography in patients with PBC and PSC. Hepatology. 2006;43(5):1118–1124.
- Godfrey EM, Mannelli L, Griffin N, et al. Magnetic resonance elastography in the diagnosis of hepatic fibrosis. Semin Ultrasound CT Mr. 2013;34(1):81–88.
- Baranova A, Lal P, Birerdinc A, et al. Non-invasive markers for hepatic fibrosis. BMC Gastroenterol. 2011;11:91.
- Norén B, Dahlström N, Forsgren MF, et al. Visual assessment of biliary excretion of Gd-EOB-DTPA in patients with suspected diffuse liver disease – a biopsy-verified prospective study. Eur J Radiol Open. 2015;2:19–25.
- Angulo P, Bugianesi E, Bjornsson ES, et al. Simple noninvasive systems predict long-term outcomes of patients with nonalcoholic fatty liver disease. Gastroenterology. 2013;145(4):782–789.e4.
- Kullak-Ublick GA, Baretton GB, Oswald M, et al. Expression of the hepatocyte canalicular multidrug resistance protein (MRP2) in primary biliary cirrhosis. Hepatol Res. 2002;23(1):78–82.