
Abstract
Background
Helicobacter pylori infection, chronic gastritis (CG) and atrophic gastritis (AG) are a continuum of consecutive events in the stomach mucosa. We studied the birth cohort and age group-specific prevalence rates of ‘healthy’ (N) and ‘diseased’ stomachs with CG or AG in endoscopic biopsies in adult people born in Finland in 1890–1977.
Materials and methods
Study series consisted of 690 and 1608 adults with a diagnostic gastroscopy in 1972–1997. All subjects were divided to 10-year age groups and birth cohorts. Based on biopsy histology, relative frequencies (prevalences) of N, CG and AG were estimated by the observed number of cases with N, CG and AG in each study category.
Results
Prevalence rate of a histologically ‘diseased’ stomach (CG or AG) decreased and that of ‘healthy’ stomach (N) increased, cohort-by-cohort, from 1900 onward by rate 9–12% per every 10-year period in the two study subpopulations, respectively. Prevalences of CG remained unchanged over study groups when N, CG and AG were noted concurrently. By noting ‘diseased’ stomachs only, the prevalence rate of AG increased, and that of CG decreased with age, at rate 9–13% per every 10 years of calendar age.
Conclusions
Over 70-year period from 1900 onward, the prevalence rate of ‘diseased’ stomach (CG or AG) decreased and that of ‘healthy’ (N) stomach increased in birth cohorts over 50%, by rate about 10% over every 10-year period of time. In birth cohorts, CG progressed to AG with aging of the subjects at a rate of about 10% over every 10 years of calendar age.
Introduction
Helicobacter pylori (H. pylori) infection results in non-atrophic chronic gastritis (CG), primarily in gastric antrum but often both in antrum and corpus, and further progresses gradually to atrophic gastritis (AG) if the infection is not actively eradicated [Citation1–9]. This life-long process will also lead to failures in stomach physiology, acid secretion and stomach acidity along which the initial H. pylori colonization may gradually vanish in the stomach mucosa [Citation10–20]. By generalizing, H. pylori converts a histologically ‘healthy’ normal stomach (N) to a permanently ‘diseased’ organ with either CG or AG.
The rate of H. pylori infection has decreased over decades in developed countries worldwide [Citation21–23]. Rates of the infection in adult populations are considered to derive from how broadly the birth cohorts are infected with H. pylori during the childhood or teenage. Therefore, H. pylori infection, and subsequent CG and AG, are also regarded as birth cohort diseases [Citation20,Citation24].
Goal of the present study is to investigate objectively how the ‘healthy’ normal stomach (N) and the ‘diseased’ stomach with CG or AG appeared in endoscopic biopsies in adult people who were born in 1890–1977 in Finland. We wanted to see how the prevalence rates of N, CG and AG were linked with the birth cohorts and age groups. We also wanted to find objective data on how the prevalence rates of N, CG and AG changed in the birth cohorts and age groups in Finland over the first seven decades of the twentieth century. For this purpose, we analysed endoscopic biopsy findings from altogether 2298 adult subjects who underwent diagnostic upper-gi endoscopy (gastroscopy) in Finland in 1972–1997.
Materials and methods
Study populations
The study population consists of two subpopulations (A and B). Demographic data and characteristics of the subjects in both of these subpopulations are presented in .
Table 1. Table on demographic data and contents of the study populations (A) and (B).
Study population (A) is a series of 690 asymptomatic subjects which were collected with a goal to examine the natural course of chronic gastritis in gastric cancer (GCA) and non-GCA families in Southern Finland in the 1970s. The population consisted initially of 737 subjects. For the present analysis, 47 were excluded due to obvious gastritis of the autoimmune type (presence of autoimmune parietal cell antibodies in serum) origin.
Of the 690 subjects in the population (A), 285 were asymptomatic first-degree relatives of 66 patients with GCA diagnosed in Meilahti Hospital of the Helsinki University Hospital, Helsinki Finland in 1972–1976, and 405 were asymptomatic first-degree relatives of 76 non-GCA probands age and sex matched to the GCA probands. Gastroscopy with multiple biopsies from antrum and corpus was done to all in 1972–1976.
Study population (B) is a series of 1608 subjects that were selectively collected from outpatients that underwent diagnostic upper-gi endoscopy (gastroscopy) in Jorvi Hospital, Helsinki University Hospital, Espoo, Finland, in 1976–1997. They were collected for a registry of examples of cases to comprise stomach histology from various stomach lesions in adult patients, including cases from simple dyspepsia to malignant tumours. The registry was composed initially of 3188 cases from which 1580 were excluded (see the exclusion criteria below).
For the present investigation, the final study population (A) consists of 690 adult persons born between 1892–1962 and the study population (B) composed of 1608 adult subjects born in 1890–1977 ().
Inclusion and exclusion criteria
All subjects in study populations (A) and (B) were adults (age range of from 15 to 93 years) from which reliable data of endoscopy and stomach histology were available (). In population (A) subjects with CG or AG of autoimmune type were excluded and were identified by the presence of parietal cell antibodies in serum. This antibody test was done on all subjects of the study population (A).
In study population (B) the cases with autoimmune chronic gastritis were excluded and were identified by the presence of biopsy histology with a typical phenotype of the autoimmune chronic gastritis in which the antral biopsies show mild chronic inflammation at most but the biopsies from gastric corpus and body reveal chronic mononuclear inflammation accompanied with moderate or severe atrophy, i.e. total or nearly total absence of normal oxyntic corpus glands. In study population (B), the subject was also excluded if there occurred tumours, any neoplastic lesions, peptic ulcers (duodenal or gastric ulcer) or Barrett`s esophagus in the study endoscopy. Altogether 47 cases were excluded from sample (A) and 1580 cases from sample (B).
Birth cohorts and age groups
The year of birth was determined for each individual at the time of the endoscopy by simply subtracting the person’s age from the year the endoscopy. All subjects were categorized to one of seven birth cohorts, i.e. to cohorts born −1910, 1911–1920, 1921–1930, 1931–1040, 1941–1950, 1951–1960 or 1961–. Noteworthy, the birth cohorts were noted in the present study from the first cohort onward. If it is said that any parameter associates with the birth cohort, it means an association of the parameter with the cohorts in 10-year time periods from the beginning of the decade of the twentieth century onward, up to 1972–1997 when endoscopy and stomach biopsy were carried out.
Number of subjects, median and mean age ± SD in males and females at the time of endoscopy in populations (A) and (B) are presented in . The study populations were also divided into 10-year age groups by age of the subject at the time of endoscopy, i.e. to age groups (in years) −20, 21–30, 31–40, 41–50, 51–60, 61–70, 71–80 and 81-. In calculations of medians and means of age also the interquartile ranges (IQR) were estimated, in addition to standard deviations (SD).
Endoscopy and biopsy histology
Biopsy protocol in study population (A) required 3–4 random biopsies from the gastric antrum and 6 biopsies from gastric corpus at least. In study population (B) the endoscopists were instructed to take at least two random biopsies both from gastric antrum and corpus, additionally to the targeted ones.
Examinations of the gastric biopsies were performed with principles for the histological classification of chronic gastritis that corresponds with those recommended by the Sydney Systems [Citation25–27]. For the present analysis, the categories of chronic inflammation and atrophy were simplified to the following parameters and concepts:
‘Healthy’ stomach mucosa (cases with N): findings in stomach biopsies are normal; there is no inflammation or atrophy. The glandular structure of both antrum and corpus is normal.
‘Diseased’ stomach mucosa (cases with CG or AG): there is a chronic non-atrophic gastritis or atrophic gastritis of any degree in any biopsies from antrum and/or corpus.
Chronic non-atrophic gastritis (CG): there is mild, moderate or severe chronic mononuclear inflammation, with or without sc. active inflammation, in antrum, corpus, or in both. There is no sign of atrophy, no loss of mucosal glands, nor the presence of intestinal metaplasia (IM) in random biopsies from antrum and corpus.
Atrophic gastritis (AG): there exists mild, moderate or severe loss of normal glands in antrum and/or corpus biopsies, irrespective of the grade of co-existing mononuclear chronic inflammation. The presence of intestinal metaplasia (IM) is considered to indicate atrophy, ie, a loss of normal mucosal glands that became replaced with IM. To simplify the study, all grades of atrophy were annexed to the one AG category only.
The presence or absence of Helicobacter pylori (H. pylori) was determined in 272 cases in population (B) in which the modified Giemsa stain was adopted as a routine histological method to detect H. pylori in biopsy specimens from the year 1990 onward. One pathologist (PS) examined all histological biopsy specimens.
Frequency analyses
To obtain comparable frequency rates (estimated frequencies/prevalences) for test parameters N, CG and AG, or for ‘healthy’ and ‘diseased’ stomachs in each study category, the observed frequencies of cases with N, CG or AG in each study category were applied for calculation of the relative frequencies (estimated prevalences) with 95% confidence intervals (95%CI). Total sum of the relative frequencies of N, CG or AG in each cohort or age group category was set to 100. All single study parameters in each study category will get, thereby, a value from 0 to 100, and can also be comprehended as a percent of the category total.
Changes in relative frequencies of test parameters N, CG or AG with respect to birth cohort or with respect to calendar age were determined with linear regression analysis. Regression coefficients were considered to indicate the change (in percent) of relative proportions (prevalences) of N, CG or AG with respect to birth cohorts (time from birth to time of endoscopy) or with respect to individuals` calendar ages.
Ethical considerations
The study population (A) was initially formed on purpose to examine chronic gastritis in gastric cancer (GCA) and non-GCA families. All subjects in both subsamples were ‘asymptomatic’ volunteers who participated in the initial study in 1972–1976 after an oral consent, and after an oral information of study purposes, goals and endoscopy. The study protocol and diagnostic endoscopy were accepted by authorities of Helsinki University Hospital in 1972. At that time, no ethical committees or requirements for written consents existed. Based on results obtained in the initial investigations, several scientific reports have been previously published in the medical literature.
Data in study population (B) are registry-based notes collected from diagnostic endoscopy and pathology reports of routine endoscopies for dyspeptic outpatients in Jorvi Hospital, Espoo, Finland. These data included only information of patient’s age, sex, endoscopy date, and notes from endoscopy and biopsy findings.
Results
Both observed and estimated relative frequencies (relative proportions/estimated relative prevalences) of cases with study parameters N (normal stomach mucosa), CG (chronic non-atrophic gastritis) or AG (atrophic gastritis) in all study categories in both study populations (A and B) are presented in and . illustrates the corresponding proportions of the study parameters in the birth cohorts as stacked bars.
Figure 1. Figure presents the relative proportions of the study parameters in the birth cohorts in study populations (A,B) as stacked bars. Figure also shows the median ages of the subjects in each cohort category. Noteworthy, due to a difference of about 10 years in the time of endoscopy of populations (A,B), the mean and median ages of the subjects in equivalent birth cohorts varied by about 10 years between study populations (A,B).
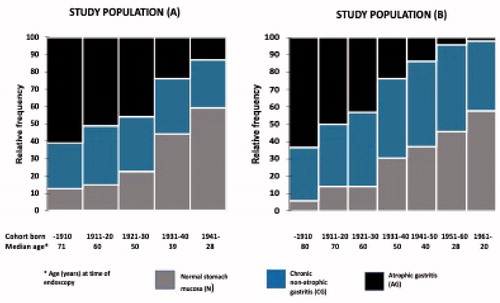
Table 2. Table presents the observed number of cases with N (normal ‘healthy’ stomach), CG (chronic non-atrophic gastritis) or AG (atrophic gastritis of any grade) in each birth cohort category in study population (A).
Table 3. Table presents the observed number of cases with N (normal ‘healthy’ stomach), CG (chronic non-atrophic gastritis) or AG (atrophic gastritis of any grade) in each birth cohort category in study population (B).
‘Healthy’ normal (N) stomach versus ‘diseased’ stomach (with CG or AG)
The relative frequencies (prevalences) of cases with N, CG and AG were roughly similar in equivalent birth cohorts between the study populations (A) and (B) ( and ). However, these frequencies were markedly and significantly different between the different birth cohort or age group categories, very similarly in study populations (A) and (B).
Relative frequencies of the cases with a ‘diseased’ stomach, i.e. cases with CG or AG, were significantly higher in the first birth cohorts than in the later ones. In the beginning of the twentieth century, roughly 90% of people in the first cohort (born in 1910 or earlier) had a ‘diseased’ stomach whereas the corresponding frequency was 40–50% in cohorts born in the 1950s or later.
Based on linear regression of prevalences of N, CG and AG over birth cohorts, the relative frequency (estimated prevalence) of cases with a ‘healthy’ stomach (N) increased and those with a ‘diseased’ stomach (CG or AG) decreased by the rate of 9 and 12% over every 10-year period of time in study populations (A) and (B), respectively. In other words, a ‘healthy’ stomach increased, and a ‘diseased’ stomach decreased in prevalence with time, cohort-by-cohort, at the rate by approximately 10% over every 10-year period of time.
No significant differences were noted in prevalences of ‘healthy’ and ‘diseased’ stomach between the male and female gender. There neither were differences between the two subsamples in population (A), i.e. between first-degree relatives of the GCA patients and first-degree relatives of the non-GCA index persons.
‘Diseased’ stomach with CG and AG
When all three study parameters (N, CG and AG) were noted, the relative proportions (estimated relative prevalences) of the AG cases decreased and those with N increased stepwise by birth cohorts from the beginning of the twentieth century onward ( and , ). In this setting, the prevalences of CG remained stable or varied inconsistently from 27% to 50% between the birth cohorts in populations (A) and (B). Similarly, by noting N, CG and AG concurrently, the prevalences of CG cases remained unchanged over the age groups whereas the prevalences of AG increased and those of N decreased with the calendar age ( and ).
On the other hand, when the observations were focused on subjects with ‘diseased’ stomach (CG or AG) only, the prevalence rate of AG increased significantly, steadily and linearly, and that of CG correspondingly decreased with calendar age (aging) of the subjects ( and ). By linear regression, the relative frequency of cases with CG increased and that of AG decreased by the rate of 9 and 13% over every 10 years in age in study populations (A) and (B), respectively.
Figure 2. Figure presents the frequency proportions of cases with CG and AG in age groups as stacked bars in a setting in which only the cases with a ‘diseased’ stomach are included in the calculations. Figure illustrates how the cases with AG increased and those with CG decreased in prevalence with respect to the aging of subjects initially infected with H. pylori.
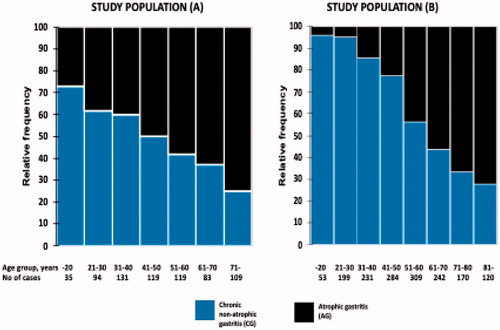
Table 4. Table presents the observed number of cases and the relative frequency proportions of CG (chronic non-atrophic gastritis) and AG (atrophic gastritis of any grade) in each age group among subjects with a ‘diseased’ stomach (cases with CG or AG).
Helicobacter pylori
Helicobacter pylori was determined from biopsy specimens with the modified Giemsa stain in study population (B) in altogether 202 cases, i.e. in biopsy specimens which were taken after the year 1990 when the method was a part of routine histological stains. In 82 cases with normal and ‘healthy’ stomach (N), H. pylori stain was negative in all. In 109 cases with CG, positive stain occurred in 99 (90%; 95%CI: 85–96%). In 81 AG cases, a positive finding of H. pylori occurred in 61 subjects (75%; 95%CI: 66–85%).
Discussion
The relative frequencies (estimated relative prevalence rates) of N, CG or AG appeared in present endoscopic biopsies in an understandable and predictable way, with respect to the birth cohorts but also with respect to the subjects’ calendar age. The observations are consistent with a view that the N (normal stomach), CG (chronic non-atrophic gastritis) and AG (atrophic gastritis) are consecutive events to the extents (prevalences) of which in a population are bound to initial rate of H. pylori infection and to subsequent CG within the birth cohorts, but that the extent of AG is also related to age (aging) of the CG subjects in each birth cohort.
When the prevalence rates were estimated in cases with a ‘diseased’ stomach only, it appeared that the prevalence rate of AG increased but that of CG decreased with an increase of the calendar age, roughly by the rate of 10% over every 10 years of age. Instead, when all study parameters, N, CG and AG, were considered concurrently, the prevalence rate of CG remained practically unchanged over the birth cohorts, and over the age groups as well. This suggests that the appearance of AG is a transition during which the CG cases slowly progress to the AG cases in the course of time.
A great majority of the CG cases seem to develop to AG in the long run (during the lifetime) according to the present data. In the birth cohort, which was born in 1910 or earlier, over 60% of all subjects showed AG at end of the cohort’s lifespan in 1972–1997 when the endoscopy was carried out at age of 70–90 years. The observations are in line with data from earlier endoscopic follow-ups that suggest a rate of around 1% in appearance of AG annually [Citation12,Citation13].
Present observations indicate objectively that the birth cohort-specific prevalence rates of CG and AG (‘diseased’ stomachs) decreased markedly, stepwise and gradually, cohort-by-cohort, from the beginning of the twentieth century up to 1972–1997. This drop was in total some 50% in 50 years and occurred by an average rate of 10% over every 10-year periods of time. As a result, CG and AG became more and more infrequent findings with time in the consecutive birth cohorts. Correspondingly, the ‘healthy’ (N) stomachs became more and more frequent.
The observations indicate indirectly but objectively that also the rate and risk of H. pylori infection, and risk of getting CG, begun to decrease in Finland already in the early decades of the twentieth century, much before the time of modern antibiotics. The previous studies on H. pylori epidemiology have favoured the view that the risk of H. pylori infection is inversely associated with the socioeconomics in target populations [Citation28]. High living standards were presumably not the case in Finland in the beginning of the twentieth century when CG, AG and H. pylori infection were apparently very common diseases.
Autoimmune aetiopathogenesis is a known pathogenetic mechanism of chronic gastritis that may, or may not, occur without a preceding H. pylori infection [Citation29–31]. To avoid bias, the cases with obvious autoimmune gastritis were excluded from the present study populations. However, the inclusion of the cases with the autoimmune gastritis to present study populations did not change the present results and conclusions.
The observations of H. pylori positivity in subjects with N, CG or AG by Giemsa stain are also notable. This stain was routinely used for the detection of H. pylori from 1990 onward. Therefore, most of the Giemsa-tested subjects represent only a part of people in subpopulation (B), mainly younger people from later birth cohorts. Among them, however, a great majority of the cases with CG, and also with AG, were H. pylori positive, indicating that not only the CG but also the AG was strongly associated with a contemporaneous H. pylori infection at the time of endoscopy and biopsy.
A handicap in the present investigation is the long duration (from 1972 to 1997) in the collection of cases to study populations (A) and (B). As a consequence, the subjects in all birth cohorts in the study population (B) were some 10 years older than in population (A) at the time of endoscopy. This may explain some of the inconsistencies in frequency proportions of the study parameters between populations (A) and (B). Another potential bias is a difference in the background of the subpopulations (A) and (B). The former was composed of asymptomatic volunteers whereas the latter were symptomatic (mainly dyspeptic) outpatients. Therefore, particularly the population (B) may emphasize cases in which CG and AG are overrepresented.
Biopsy sampling is always a source of potential biases in all endoscopic studies. In the present study, the biopsy protocols for random biopsy of antrum and corpus were similar to guidelines suggested by the Sydney Systems [Citation26,Citation27]. The biopsy sampling was even more extensive in population (A) than is preferred by the recommendations. All biopsies were examined by one experienced pathologist that undoubtedly lowers diagnostic deviations. In comparisons of study parameters in equivalent age and birth cohort categories between study populations (A) and (B), divergences were quite infrequent regarding the prevalence rates of N, CG or AG.
Acknowledgements
The present study was carried out in the honour of Professor Maximilian Siurala (1913–2003) and Professor Kaljo Villako (1919–2001) whose research groups begun the gastritis research in Finland and Estonia already in the 1960s. Professor Seppo Sarna has advised in statistics and epidemiology.
Disclosure statement
Dr Pentti Sipponen is a shareholder of Biohit Healthcare Plc, Helsinki, and Repolar Pharmaceuticals Oy, Espoo, Finland. No other conflicts of interest.
References
- Marshall BJ, Warren JR. Unidentified curved bacilli in the stomach of patients with gastritis and peptic ulceration. Lancet. 1984;1(8390):1311–1315.
- Schistosomes lf, Helicobacter p. IARC working group on the evaluation of carcinogenic risks to humans. Lyon, 7-14 June 1994. IARC Monogr Eval Carcinog Risks Hum. 1994;61:1–241
- Kusters JG, van Vliet AHM, Kuipers EJ. Pathogenesis of Helicobacter pylori infection. CMR. 2006;19(3):449–490.
- Gisbert JP, Luna M, Gómez B, et al. Recurrence of Helicobacter pylori infection after several eradication therapies: long-term follow-up of 1000 patients. Aliment Pharmacol Ther. 2006;23(6):713–719.
- Siurala M. The story of gastritis. Scand J Gastoenterol. 1991;26(sup186):1–3.
- Siurala M. Gastritis, its fate and sequelae. Ann Clin Res. 1981; 13:111–113.
- Sipponen P, Maaroos H-I. Chronic gastritis. Scand J Gastroenterol. 2015;50(6):657–667.
- Villako K, Maards H, Tammur R, et al. Helicobacter (Campylobacter) pylori infestation and the development and progression of chronic gastritis: results of long-term follow-up examinations of a random sample. Endoscopy. 1990;22(03):114–117.
- Sipponen P, Kekki M, Siurala M. The Sydney System: epidemiology and natural history of chronic gastritis. J Gastroenterol Hepatol. 1991;6(3):244–251.
- Correa P. The epidemiology and pathogenesis of chronic gastritis: three etiologic entities. Front Gastrointest Res. 1980;6:98–108.
- Kekki M, Ihamäki T, Saukkonen M, et al. Progression of gastritis at a population level. Comparison of a long-term follow-up with stochastic analysis of cross-sectional data. Scand J Gastroenterol. 1980; 15:652–655.
- Ihamauki T, Kekki M, Sipponen P, et al. The sequelae and course of chronic gastritis during a 30- to 34-year bioptic follow-up study. Scand J Gastroenterol. 1985;20(4):485–491.
- Kuipers EJ, Uyterlinde AM, Peña AS, et al. Long-term sequelae of Helicobacter pylori gastritis. Lancet. 1995;345(8964):1525–1528.
- Kuipers EJ, Klinkenberg-Knol EC, Vandenbroucke-Grauls CM, et al. pylori in the pathogenesis of atrophic gastritis. Scand J Gastroenterol. 1997;223:28–34.
- Rugge M, de Boni M, Pennelli G, et al. Gastritis OLGA-staging and gastric cancer risk: a twelve-year clinico-pathological follow-up study. Aliment Pharmacol Ther. 2010; 31:1104–1111.
- Dixon MF. Histological responses to Helicobacter pylori infection: gastritis, atrophy and preneoplasia. Bailliers Clin Gastroenterol. 1995;9(3):467–486.
- Takahashi S. Long-term Helicobacter pylori infection and the development of atrophic gastritis and gastric cancer in Japan. J Gastroenterol. 2002; 37(S13):24–27.
- Samloff IM, Varis K, Ihamäki T, et al. Serum pepsinogens I and II and gastric acid output: effect of gastritis. Prog Clin Biol Res. 1985; 173:129–138.
- Sipponen P, Valle J, Varis K, et al. Fasting levels of serum gastrin in different functional and morphologic states of the antrofundal mucosa. An analysis of 860 subjects. Scand J Gastroenterol. 1990;25(5):513–519.
- Sipponen P, Helske T, Järvinen P, et al. Fall in the prevalence of chronic gastritis over 15 years: analysis of outpatient series in Finland from 1977, 1985, and 1992. Gut. 1994;35(9):1167–1171.
- Sipponen P, Kosunen TU, Samloff IM, et al. Rate of Helicobacter pylori acquisition among Finnish adults: a fifteen-year follow-up. Scand J Gastroenterol. 1996;31(3):229–232.
- Lahner E, Bordi C, Cattaruzza MS, et al. Long-term follow-up in atrophic body gastritis patients: atrophy and intestinal metaplasia are persistent lesions irrespective of Helicobacter pylori infection. Aliment Pharmacol Ther. 2005;22(5):471–481.
- Hooi JKY, Lai W, Ng WK, et al. Global Prevalence of Helicobacter pylori Infection: Systematic Review and Meta-Analysis. Gastrtoenterology. 2017;153(2):420–429.
- Sipponen P. Helicobacter pylori: a cohort phenomenon. Am J Surg Pathol. 1995;19 (Suppl 1):S30–S6.
- Correa P. Chronic gastritis: a clinico-pathological classification. Am J Gastroenterol. 1988;83:504–509.
- Price AB. The sydney system: histological division. J Gastroenterol Hepatol. 1991;6(3):209–222.
- Dixon MF, Genta RM, Yardley JH, et al. Classification and grading of gastritis. The updated Sydney System. International Workshop on the Histopathology of Gastritis, Houston 1994. Am J Surg Pathol. 1996;20(10):1161–1181.
- Moayyedi P, Axon ATR, Feltbower R, et al. Relation of adult lifestyle and socioeconomic factors to the prevalence of Helicobacter pylori infection. Int J Epidemiol. 2002;31(3):624–631.
- Zhang Y, Weck MN, Schöttker B, et al. Gastric parietal cell antibodies, Helicobacter pylori infection, and chronic atrophic gastritis: evidence from a large population-based study in Germany. Cancer Epidemiol Biomarkers Prev. 2013;22(5):821–826.
- Eidt S, Oberhuber G, Stolte M. Autoimmune gastritis in its various stages. Verh Dtsch Pathol. 1996; 80:196–198.
- Varis O, Valle J, Siurala M. Is Helicobacter pylori involved in the pathogenesis of the gastritis characteristic of pernicious anaemia? Comparison between pernicious anaemia relatives and duodenal ulcer relatives. Scand J Gastroenterol. 1993;28(8):705–708.