
Abstract
Objectives
We set out to determine the reasons for serum vedolizumab (VDZ) trough concentration (TC) measurements in inflammatory bowel disease (IBD) patients and to evaluate treatment modifications after therapeutic drug measurement (TDM). We also evaluated the effect of increased dosing on patients’ response to VDZ therapy.
Methods
We performed a retrospective cohort study of IBD patients who received VDZ therapy at Helsinki University Hospital and whose VDZ levels were measured between June 2014 and December 2018.
Results
Altogether, 90 patients (32 Crohn's disease and 58 ulcerative colitis) and 141 VDZ TC measurements were included. 24.1% of measurements took place during induction and 75.9% during the maintenance phase. During induction, 64.7% reached the target TC >20µg/ml. During maintenance therapy, 82.2% of VDZ TCs were within or exceeded the suggested target range of 5–15µg/ml. Reasons for TDM were: secondary nonresponse (44.0%), assessment of adequate VDZ TC (25.5%), primary nonresponse (12.8%), adverse events (6.4%), and other (11.3%). No treatment changes occurred after 60.3% of VDZ measurements. Increased dose frequency was used after 25.5% of VDZ measurements and 33.3% of these patients experienced improvement. Altogether, 31 (34.4%) patients discontinued the therapy due to inadequate treatment response. No anti-vedolizumab antibodies were detected.
Conclusions
During the maintenance of VDZ therapy, the majority of VDZ TCs were within the suggested range. Measurement of VDZ TC did not lead to any treatment changes in two-thirds of patients. Dose optimization occurred in a quarter of patients and a third of them benefited from it.
Introduction
Inflammatory bowel diseases (IBDs) are chronic relapsing and remitting diseases that impact negatively on patient quality of life and cause a large financial burden to society. Medical therapies target restoration of the patient’s quality of life and prevention of IBD-associated cancer by decreasing mucosal inflammation [Citation1].
Vedolizumab (VDZ) is a humanized monoclonal antibody targeting α4β7 integrin and subsequently modulates lymphocyte trafficking, resulting in an intestine-specific anti-inflammatory effect. The terminal elimination half-life of VDZ has been estimated to be 25.5 d, and elimination is primarily linear at therapeutic concentrations [Citation2]. VDZ seems to have a favourable safety profile [Citation3]. GEMINI 1 and 2 studies proved VDZ to be effective for induction and maintenance therapy in moderate to severe Crohn’s disease (CD) and ulcerative colitis (UC) [Citation4,Citation5], and real-life cohorts have confirmed the results [Citation6]. On the other hand, loss of response may occur in VDZ-treated IBD patients. In these situations, drug effects may be regained with dose intensification [Citation7].
Therapeutic drug monitoring (TDM) is an important tool in the personalization of care and in optimizing the treatment of patients with inadequate response or a loss of response. Titration of VDZ to target trough concentration (TC) is associated with improved clinical outcomes [Citation8,Citation9]. Some clinical factors are found to affect drug concentrations [Citation10,Citation11]. Anti-TNF-naivety seems to be a positive predictor of response and mucosal healing [Citation12]. The formation of anti-drug antibodies (ADA) result in lower serum drug concentrations and decreased drug effectiveness but immunogenicity is not as significant a problem in VDZ therapy as it is with anti-TNF therapy. Currently, TDM is an important part of the routine treatment of IBD patients on anti-TNF therapy since it has been shown to improve response and remission rates [Citation13,Citation14].
Some current guidelines suggest proactive TDM after anti-TNF induction in order to ensure adequate TCs and to avoid immunization [Citation15,Citation16]. However, due to a lack of existing data, proactive TDM is not suggested during VDZ therapy. Only one guideline suggests reactive TDM at the end of VDZ induction in non-responders and patients with a confirmed secondary loss-of response [Citation16]. Thus, the role of reactive TDM during VDZ therapy requires further investigation. The primary aim of the present study was to determine the reasons for serum VDZ TC measurements and to evaluate treatment modifications after TDM. The secondary aim was to investigate the effect of increased dosing on patients’ response to VDZ therapy.
Patients and methods
This was a retrospective, non-interventional chart-review study designed to assess the reasons for VDZ concentration measurements and the association of VDZ TCs with patient’s response to VDZ therapy in IBD. All adult IBD patients, who received VDZ therapy in clinical practice at Helsinki University Hospital, and whose VDZ concentrations were measured at least once between 1 June 2014 and 31 December 2018, were included in this study. IBD patients with available VDZ TCs were identified from the United Medix Laboratories research register. Data were collected retrospectively from the electronic health records in a pre-established anonymous standardized case report form (CRF). Laboratory measurements and information on concomitant medications were collected from the hospital IBD registry. Outcome variables were collected at baseline, induction phase (defined as ≤14 weeks of therapy), at month 12, and the treatment discontinuation or at the end of the follow-up period, whichever occurred first. In addition, outcome variables were collected at the time of each VDZ TC measurement and within 3 months after VDZ treatment modification during the maintenance phase.
Definitions of disease activity and treatment response
Clinical disease severity for UC was evaluated using the partial Mayo score (PMS). Baseline PMS 7–9 was considered severe, 5–6 moderate and 2–4 mild clinical activity, and 0–1 clinical remission. Clinical treatment response was defined as PMS reduction ≥3 and a decrease of at least 30% from the baseline score, and PMS ≤2 (with no individual subscore >1) as clinical remission. PMS reduction ≤2 was considered as no clinical response [Citation17,Citation18]. In case of inadequate data, clinical activity was assessed with the physician’s global assessment (PGA): remission, mild, moderate, or severe disease activity [Citation19]. Clinical activity for CD was classified dichotomously as an active or inactive disease based on PGA. The primary response, nonresponse, and secondary loss of response were based on the clinician’s evaluation.
The following laboratory parameters were recorded: haemoglobin, leucocytes, thrombocytes, albumin, C-reactive protein (CRP), and faecal calprotectin (F-calprotectin). F-calprotectin <100 µg/g was considered normal. Laboratory tests had been carried out as part of the routine clinical practice.
VDZ infusions, VDZ TCs and anti-VDZ antibody measurements
Dates of VDZ infusions and measurement of VDZ concentration and anti-vedolizumab antibody (AVA) levels were collected, and infusion schedule during induction and maintenance therapy was determined based on these data. Reasons for measurement of VDZ concentrations and AVAs were recorded and classified as primary nonresponse, secondary nonresponse (including loss of response and inadequate total response), assessment of adequate VDZ concentrations during induction/maintenance therapy, adverse effects, or other reason (e.g., physician’s interest to receive the clinical experience of use of VDZ TDM).
Treatment changes following VDZ measurements were recorded. Possible treatment changes were increased or decreased dose frequency, treatment discontinuation, switch to another biological, or other change. Other treatment changes included surgical treatment and the addition of another biological to the patient’s therapy. Effects of treatment changes were classified as no observed change, moderate improvement (noticeable decrease in clinical activity), and significant improvement (meaning clinical remission).
VDZ concentrations were analysed with an enzyme-immunological assay and serum AVAs with a radioimmunoassay (Sanquin, Amsterdam, the Netherlands). VDZ TC target was defined as >20 µg/ml during induction therapy [Citation20] and 5–15 µg/ml during maintenance therapy according to the laboratory reference.
Statistical analysis
Baseline demographic and treatment data were analysed using descriptive statistics and are reported as mean and standard deviation (SD). The comparison between groups was analysed using generalized linear models and point estimates and 95% confidence intervals are presented. Changes from baseline to follow-up (i.e., laboratory outcomes and efficacy variables) were analysed using a paired sample t-test. Additionally, the differences between variables at baseline and follow-up were analysed using the Fisher Exact Test, Wilcoxon signed-rank test, the Mann–Whitney U-test, and the Marginal Homogeneity test. A receiver operating characteristic (ROC) analysis was performed for VDZ concentrations to trace the threshold associated with response to induction therapy. These statistical analyses were conducted using R (version 3.4.0 or higher, http://www.r-project.org), Stata (version 13.0 or higher, StataCorp. 2013. Stata Statistical Software: Release 13. College Station, TX: StataCorp LP), and IBM SPSS Statistics (Version 25.0 or higher). All p-values were two-tailed and p < .05 was considered statistically significant.
Ethical consideration
No ethics approval or informed consent from the cohort was required by Finnish legislation, as the persons were not contacted, the study did not affect the treatment of the patients, and only pseudonymized data were used. Research permission for data collection was applied from the study centre (HUS research permission number HUS/333/2019).
Results
Baseline characteristics
Altogether 90 patients (32 CD and 58 UC) were included. The baseline characteristics, disease activity, and treatment history of the patients are shown in and . The majority of patients, 71.9% of CD and 89.7% of UC patients, were previously treated with at least one other biological drug. Approximately, a third of the CD patients (28.1%) were treated with corticosteroids, 3.1% with 5-ASA or sulfasalazine, and 12.5% with immunosuppressants as a concomitant therapy at the baseline. The corresponding figures for the UC patients were 32.8%, 34.5%, and 46.6%. The median number of VDZ infusions per patient during follow-up was 12 (minimum 2, maximum 31 infusions). Altogether, 13 (14.4%, 6 CD and 7 UC) patients received an additional VDZ infusion on week 10. The median length of VDZ therapy was 17.0 months (min <1 month, max 52 months). No significant difference in the length of VDZ therapy between CD and UC patients was detected (p > .05).
Table 1. Patient characteristics and disease phenotype at baseline.
Table 2. Disease activity and treatment history at baseline.
VDZ concentration measurements
Altogether, 141 VDZ TCs were measured during the study period: 34 (24.1%; CD n = 10, UC n = 24) of these measurements occurred during the induction phase and 107 (75.9%; CD n = 44, UC n = 63) during the maintenance phase. An analysis of VDZ TC, 56 (62.2%) patients were measured once, 24 (26.7%) patients twice, 6 (6.7%) patients three times, and 4 (4.4%) patients four or more times. Altogether, 24 AVA measurements were performed during the induction or maintenance phase but no AVAs were detected.
The effect of patient characteristics on VDZ concentration
Age, gender, and disease duration had no statistically significant correlation with VDZ TCs during the induction or maintenance phase (p > .05 for age, gender, and diagnosis). During the induction phase, VDZ TC was observed to be significantly lower in patients with body mass index (BMI) ≥25 (p = .004) or BMI >30 (p = .031) compared with patients with normal BMI. During the maintenance phase, no significant difference in VDZ TC was observed with BMI ≥25 or ≥30 compared with patients with normal BMI.
VDZ concentration during the induction phase
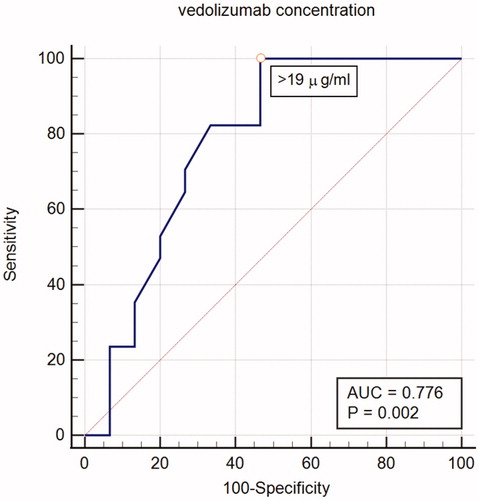
During the induction phase, the mean VDZ TC was 25.1 µg/ml (SD 11.5) and ranged between 1.7 µg/ml and 49 µg/ml. Of 34 VDZ TC measurements performed during the induction, 21 (61.8%) were made before week 8, 5 (14.7%) between 8 and 12 weeks, and 8 (23.5%) between 12 and 14 weeks after initiation of VDZ therapy. Of these, 22 (64.7%) VDZ TCs reached the defined target level >20 µg/ml and 12 (35.3%) remained below the target (). A ROC curve analysis identified a statistically significant VDZ concentration threshold of 19 µg/ml associated with response to induction (). We also assessed whether differences in VDZ concentrations during the induction phase impacted either the clinical activity (PMS/PGA in UC, inactive/active disease in CD) or biomarker-based disease activity (F-calprotectin or CRP) but no relationship between the two was observed. Considering all measurements during induction, 11 measurements that resulted from primary nonresponse had a mean concentration of 17.1 µg/ml, and the other 21 measurements had a mean concentration of 28.5 µg/ml (p = .004).
Figure 1. Vedolizumab trough concentrations during the induction therapy.
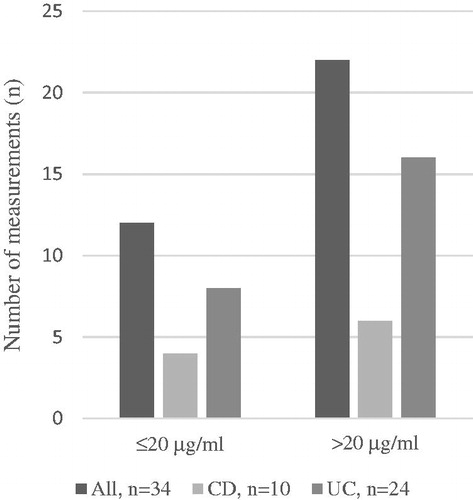
Figure 2. ROC analysis for vedolizumab serum concentration after induction therapy stratifying patients with and without response.
VDZ concentration during the maintenance therapy
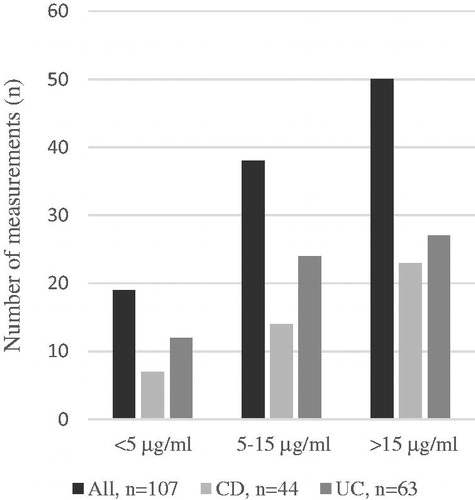
The mean duration between the first VDZ infusion and VDZ TC measurement was 14.2 months (min 3.2, max 49.8 months). Of the 107 VDZ TCs measured during the maintenance phase, 38 (35.5%) reached the defined target level of 5–15 µg/ml and 50 (46.7%) exceed it (). Therefore, 19 (17.8%) measurements remained below the target level of 5–15 µg/ml. Mean VDZ TC was 16.9 µg/ml (SD 11.4) and ranged between 0.2 µg/ml and 60.0 µg/ml. Measurements because of non-responsiveness had a mean concentration of 17.3 µg/ml and other measurements a mean concentration of 16.3 µg/ml (p > .05).
Figure 3. Vedolizumab trough concentrations during the maintenance therapy.
Reasons for VDZ concentration measurement
VDZ concentrations were measured based on the physician’s clinical consideration. The reasons for the measurements are presented in . Of all measurements, 18 (12.8%) were performed due to primary nonresponse. Secondary nonresponse, including secondary loss of response and inadequate total response, was the most common indication for VDZ measurement (44.0%). A quarter (25.5%) of VDZ TC measurements were performed to confirm adequate VDZ levels. A minority (6.4%) of all VDZ measurements were performed because of adverse events. The rest of the measurements (11.3%) were performed due to other or unknown indications, mainly because of the physician’s interest.
Table 3. Reasons for vedolizumab concentration measurements during the induction and maintenance phases.
Treatment changes after VDZ measurement
Any changes in therapy were recorded; after 60.3% of measured VDZ concentrations no treatment changes were performed (). Optimization of the VDZ therapy by increasing dose frequency occurred after 25.5% of the measurements, whereas a decrease in dose frequency was made in two cases (1.4%). The shortest observed dosing interval was 2.4 weeks. Switch to another biological or discontinuation of VDZ therapy resulted after 9.2% of VDZ measurements. Other treatment changes (colectomy, combination VDZ with golimumab therapy) were made after 4 (2.8%) measurements.
Table 4. Treatment changes after vedolizumab trough concentration measurements.
The effects of increased dosing frequency
Mean VDZ TC preceding increased dosing frequency was 10.4 µg/ml (SD 8.4). Of patients with increased dose frequency, 15 (41.7%) had no observed change in clinical response. Moderate improvement was observed in 9 (25.0%) patients and significant improvement (remission) in 3 (8.3%) of the patients (). Twenty-one (58.3%) patients had VDZ TC measured also after dose intensification with a mean VDZ TC of 20.6 µg/ml (SD 11.1). VDZ concentration increased by an average of 11.6 µg/ml. After dose intensifications, there was no significant difference in VDZ TC among patients with no observed change in treatment response nor in patients with moderate or significant improvement (p > .05).
Table 5. Effect on treatment response in patients with increased dosing frequency.
Treatment persistence and discontinuation
VDZ treatment was discontinued in 37 (41.1%) patients and occurred mainly (n = 31, 83.8%) due to inadequate response to therapy (). No significant difference in VDZ TC between patients who continued the therapy and the ones who discontinued was observed (p > .05). Adverse events (arthralgia, infusion reaction, infection) were the cause of VDZ discontinuation in 8.1% of patients. Other causes for discontinuation were the patient’s will, remission, and recurrent pyogenic cholangitis. At six months after treatment initiation, 88.0% of UC and 91.0% of CD patients remained on treatment. Increased dose frequency had no effect on treatment persistence compared to patients with no dose intensification (p > .05). Also, no significant differences between CD and UC on drug persistence were detected (p > .05).
Table 6. Reasons for vedolizumab therapy discontinuation.
Discussion
TDM has the potential to improve treatment outcomes in VDZ therapy but thresholds for optimal drug exposure and the effect of dose optimization are yet to be defined [Citation21]. In the present study, we set out to investigate the reasons and benefits of reactive TDM in the optimization of VDZ therapy. The most usual reason for the measurement of VDZ TC was an inadequate response to therapy and the majority of measurements (75.9%) took place in the maintenance phase. During the maintenance phase, reactive TDM resulted in the optimization of VDZ dose interval in approximately a quarter of patients. Improvement in treatment response was observed in 9.1% of CD and 44.0% of UC patients with increased dosing frequency. A third of patients discontinued the therapy due to a lack of adequate response despite the VDZ TC.
TDM is an important tool in the personalization of care and in optimizing treatment efficacy in patients with primary nonresponse or secondary loss of response during the anti-TNF therapy. By contrast, no robust target induction VDZ level is available for routine use. The largest VDZ concentration data during induction therapy comes from the pivotal GEMINI studies. The GEMINI I and II studies have shown that during induction (week 6) the patients with VDZ concentrations in the highest quartiles achieved clinical response and remission more often than patients in the lowest quartiles [Citation4,Citation5]. In an analysis of GEMINI I patients, week 6 VDZ concentration was identified as the earliest time at which the concentration (>37.1 μg/ml) was associated with clinical remission after induction or at one year [Citation22]. However, uncontrolled retrospective and prospective cohort studies have detected lower VDZ concentration thresholds at week 6 for clinical or endoscopically favourable outcomes [Citation9,Citation10,Citation23]. A recent review suggested a target level of 20 μg/ml at week 6 during induction to be associated with improved clinical outcomes [Citation20].
In our study, only a quarter of all VDZ measurements were performed during the induction phase, the most common reason being an inadequate response to therapy. Of these, 64.7% reached the suggested target level of >20 μg/ml. In a quarter of patients, almost all being UC patients, measurement of VDZ concentration resulted in optimization of dosing. However, no association with clinical or biomarker-based outcomes was detected after induction. This contradicts other recently published cohort studies that have been suggesting an association between VDZ concentration and clinical activity scores and biochemical markers [Citation24–Citation25].
Real-world studies have confirmed that VDZ is able to maintain long-term clinical remission in the treatment of IBD patients [Citation6]. In a French national multi-centre cohort study three-year VDZ treatment persistence rates were 26.3% in patients with CD and 42.9% in patients with UC [Citation26]. A Higher VDZ level at week 14 may predict higher VDZ treatment persistence over the first year [Citation27]. Increasing dosing frequency from every 8 to every 4 weeks may benefit some patients. In the above-mentioned French study just over half of the VDZ-treated IBD patients experienced infusion schedule intensification [Citation26]. In our selected patient population, the optimization of VDZ therapy by increasing dose frequency occurred after a quarter of the measurements.
Target maintenance VDZ concentration remains unclear. Complete saturation of the α4β7 receptors of peripheral lymphocytes already occurs at a VDZ concentration of 1 µg/ml, during VDZ maintenance therapy every eight weeks [Citation2]. Despite this receptor saturation, an exposure-response relationship is detected during VDZ maintenance therapy [Citation4–Citation5]. In a large real-world cohort of 258 IBD patients, higher VDZ concentrations (≥11.5 µg/ml) during the maintenance phase were observed to significantly associate with corticosteroid-free clinical and biochemical remission [Citation28]. However, a recent review suggested serum VDZ TC level of 5.1–11.0 µg/ml during the maintenance phase is associated with improved clinical and endoscopic treatment results [Citation29]. During the maintenance phase, the target VDZ concentration in our study was 5–15 μg/ml as suggested by the laboratory. Even though a majority of VDZ concentration measurements were performed because of inadequate response to the therapy, two-thirds of VDZ concentrations were within the suggested target range. Only a fifth of maintenance VDZ concentrations was below the target level.
Treatment modification after TDM and the effects of these treatment changes are relevant interests when evaluating the true beneficial effect of VDZ level measuring. In our study, the majority of VDZ concentration measurements did not lead to any treatment changes. It is possible that the suggested target VDZ maintenance concentration 5–15 μg/ml guided the clinician to be satisfied with the dosing and not to try dose intensification. There may be patients in our study that could have benefited from dose intensification regardless of VDZ concentration being within the suggested range. Only a quarter of patients experienced dose optimization and a third of them experienced clinical improvement. In a recent review and meta-analysis, 53.8% of secondary non-responders restored response after dose intensification [Citation7]. This is in line with our results as 41.7% of patients with VDZ treatment intensification experienced no change in treatment response. The above-mentioned blocking of integrin α4β7 receptors seems to occur regardless of serum VDZ concentration or response to treatment and has been suspected to contribute to the inefficacy of dose escalation in VDZ therapy [Citation8,Citation11].
Several factors have been observed to affect the pharmacokinetics of VDZ in IBD patients; high BMI and low serum albumin levels are clinically significant predictors of increased VDZ clearance [Citation11]. In this study, we detected significantly higher VDZ concentration in patients with a normal BMI compared to patients with abnormal BMIs. In contrast to weight-based dosing with infliximab, vedolizumab has equal dosing for all patients according to the label [Citation30]. Furthermore, contrary to anti-TNF therapy where immunization risk is high and the outcome of therapy is improved in combination with immunomodulators, immunogenicity with VDZ therapy is rare as only 3–4% of patients on VDZ therapy are positive for AVAs [Citation3]. Additionally, the presence of AVAs does not seem to influence clinical outcomes and is often transient [Citation8]. Outcomes of vedolizumab monotherapy versus combination therapy with immunomodulators seem to be similar [Citation31]. However, a quarter of all patients in our study were still using combination therapy and, interestingly, the majority were UC patients. AVAs were not detected in this patient cohort.
The real-world retrospective study design has well-known strengths and limitations. By including only patients who had VDZ concentrations measured, we have selected the patients with a more unfavourable response to therapy compared with patients in no need of VDZ concentration measurements. Due to the retrospective study design, the availability of data for collected variables was limited at specific time points because clinical check-ups and laboratory tests had been carried out as a part of clinical practice. Endoscopic data were not available. However, real-world data from a single referral centre provides valuable evidence and the cohort is representative of the real-world patient population.
In conclusion, there is a major need to optimise biological therapy in order to improve treatment results. Based on the results in this study, VDZ TDM does not seem to have a major beneficial impact on treatment outcomes.
Acknowledgements
We thank Aaro Mustonen and Dr. Pauliina Molander for help in data acquisition. Harlan Barker from MedEngine Oy is acknowledged for language review.
Disclosure statement
TS has received consultation or lecturer fees from Janssen-Cilag, Pfizer, Roche, and Takeda and study grants from Janssen-Cilag and Takeda. TY is the owner of MedEngine Oy and JJ and MK are employees of MedEngine Oy.
References
- Peyrin-Biroulet L, Sandborn W, Sands BE, et al. Selecting therapeutic targets in inflammatory bowel disease (STRIDE): determining therapeutic goals for treat-to-target. Am J Gastroenterol. 2015;110(9):1324–1338.
- Rosario M, Dirks NL, Milch C, et al. A review of the clinical pharmacokinetics, pharmacodynamics, and immunogenicity of vedolizumab. Clin Pharmacokinet. 2017;56(11):1287–1301.
- Colombel J, Sands BE, Rutgeerts P, et al. The safety of vedolizumab for ulcerative colitis and Crohn’s disease. Gut. 2017;66(5):839–851.
- Feagan BG, Rutgeerts P, Sands BE, et al. GEMINI 1 study group. Vedolizumab as induction and maintenance therapy for ulcerative colitis. N Engl J Med. 2013;369(8):699–710.
- Sandborn WJ, Feagan BG, Rutgeerts P, et al. GEMINI 2 study group. Vedolizumab as induction and maintenance therapy for Crohn’s disease. N Engl J Med. 2013;369(8):711–721.
- Schreiber S, Dignass A, Peyrin-Biroulet L, et al. Systematic review with meta-analysis: real-world effectiveness and safety of vedolizumab in patients with inflammatory bowel disease. J Gastroenterol. 2018;53(9):1048–1064.
- Peyrin-Biroulet L, Danese S, Argollo M, et al. Loss of response to vedolizumab and ability of dose intensification to restore response in patients with Crohn’s disease or ulcerative colitis: a systematic review and meta-analysis. Clin Gastroenterol Hepatol. 2019;17(5):838–846.
- Ungar B, Kopylov U, Yavzori M, et al. Association of vedolizumab level, anti-drug antibodies, and α4β7 occupancy with response in patients with inflammatory bowel diseases. Clin Gastroenterol Hepatol. 2018;16(5):697–705.
- Williet N, Boschetti G, Fovet M, et al. Association between low trough levels of vedolizumab during induction therapy for inflammatory bowel diseases and need for additional doses within 6 months. Clin Gastroenterol Hepatol. 2017;15(11):1750–1757.
- Dreesen E, Verstockt B, Bian S, et al. Evidence to support monitoring of vedolizumab trough concentrations in patients with inflammatory bowel diseases. Clin Gastroenterol Hepatol. 2018;16(12):1937–1946.
- Rosario M, Dirks NL, Gastonguay MR, et al. Population pharmacokinetics‐pharmacodynamics of vedolizumab in patients with ulcerative colitis and Crohn’s disease. Aliment Pharmacol Ther. 2015;42(2):188–202.
- Kopylov U, Verstockt B, Biedermann L, et al. Effectiveness and safety of vedolizumab in anti-TNF-naïve patients with inflammatory bowel disease—a multicenter retrospective European study. Inflammatory Bowel Dis. 2018;24(11):2442–2451.
- Vande Casteele N, Ferrante M, Van Assche G, et al. Trough concentrations of infliximab guide dosing for patients with inflammatory bowel disease. Gastroenterology. 2015;148(7):1320–1329.
- Steenholdt C, Brynskov J, Thomsen OØ, et al. Individualised therapy is more cost-effective than dose intensification in patients with Crohn’s disease who lose response to anti-TNF treatment: a randomised, controlled trial. Gut. 2014;63(6):919–927.
- Mitrev N, Vande Casteele N, Seow CH, et al. Review article: consensus statements on therapeutic drug monitoring of anti-tumour necrosis factor therapy in inflammatory bowel diseases. Aliment Pharmacol Ther. 2017;46:1037–1053.
- Papamichael K, Cheifetz AS, Melmed GY, et al. Appropriate therapeutic drug monitoring of biologic agents for patients with inflammatory bowel diseases. Clin Gastroenterol Hepatol. 2019;17:1655–1668.
- D’Haens G, Sandborn WJ, Feagan BG, et al. A review of activity indices and efficacy end points for clinical trials of medical therapy in adults with ulcerative colitis. Gastroenterology. 2007;132(2):763–786.
- Lewis JD, Chuai S, Nessel L, et al. Use of the noninvasive components of the Mayo score to assess clinical response in ulcerative colitis. Inflamm Bowel Dis. 2008;14(12):1660–1666.
- Hellers G, Cortot A, Jewell D, et al. Oral budesonide for prevention of postsurgical recurrence in Crohn’s disease. The IOIBD Budesonide study group. Gastroenterology. 1999;116(2):294–300.
- Sparrow MP, Papamichael K, Ward MG, et al. Therapeutic drug monitoring of biologics during induction to prevent primary non-response. J Crohns Colitis. 2020;14(4):542–‐556.
- Pouillon L, Vermeire S, Bossuyt P. Vedolizumab trough level monitoring in inflammatory bowel disease: a state-of-the-art overview. BMC Med. 2019;17(1):89.
- Osterman MT, Rosario M, Lasch K, et al. Vedolizumab exposure levels and clinical outcomes in ulcerative colitis: determining the potential for dose optimisation. Aliment Pharmacol Ther. 2019;49(4):408–418.
- Yacoub W, Williet N, Pouillon L, et al. Early vedolizumab trough levels predict mucosal healing in inflammatory bowel disease: a multicentre prospective observational study. Aliment Pharmacol Ther. 2018;47(7):906–912.
- Schulze H, Esters P, Hartmann F, et al. A prospective cohort study to assess the relevance of vedolizumab drug level monitoring in IBD patients. Scand J Gastroenterol. 2018;53(6):670–676.
- Buer LCT, Moum BA, Cvancarova M, et al. Real world data on effectiveness, safety and therapeutic drug monitoring of vedolizumab in patients with inflammatory bowel disease. A single center cohort. Scand J Gastroenterol. 2019;54(1):41–48.
- Amiot A, Serrero M, Peyrin-Biroulet L, et al. Three-year effectiveness and safety of vedolizumab therapy for inflammatory bowel disease: a prospective multi-centre cohort study. Aliment Pharmacol Ther. 2019;50(1):40–53.
- Guidi L, Pugliese D, Panici Tonucci T, et al. Early vedolizumab trough levels predict treatment persistence over the first year in inflammatory bowel disease. United European Gastroenterol J. 2019;7(9):1189–1197.
- Ungaro RC, Yarur A, Jossen J, et al. Higher trough vedolizumab concentrations during maintenance therapy are associated with corticosteroid-free remission in inflammatory bowel disease. J Crohns Colitis. 2019;13(8):963–969.
- Restellini S, Khanna R, Afif W. Therapeutic drug monitoring with ustekinumab and vedolizumab in inflammatory bowel disease. Inflamm Bowel Dis. 2018;24(10):2165–2172.
- Entyvio: EPAR – Product Information. Available from: https://www.ema.europa.eu/en/documents/product-information/entyvio-epar-product-information_en.pdf
- Yzet C, Diouf M, Singh S, et al. No benefit of concomitant immunomodulator therapy on efficacy of biologics that are not tumor necrosis factor antagonists in patients with inflammatory bowel diseases: a meta-analysis. Clin Gastroenterol Hepatol. 2020;S1542–3565(20):30935–30936.