
Abstract
Background
Gastrointestinal stromal tumors (GISTs) and leiomyomas (GILs) are difficult to be distinguished by endoscopic ultrasound (EUS). Photoshop software combined with EUS has limitations in distinguishing GIST and GIL by detecting gray values. Therefore, the research aims to explore the new method by Photoshop in distinguishing the features of GISTs from GILs.
Methods
Patients who underwent EUS and were confirmed as GIST and GIL pathologically were included. The images of EUS were analyzed by Photoshop software. The mean gray value of tumor (Tmean), muscularis propria (Mmean), submucosa (Smean), water (Wmean) and TSD that originated from the same image, were calculated one by one. Then the ratio of the mean gray value of tumor to muscularis propria (TMratio), submucosa (TSratio), and water (TWratio) were calculated, respectively.
Results
Four hundred seventy-two patients (239 GILs and 233 GISTs) were enrolled in this study retrospectively. All the tumors were located in the stomach. Tmean and TSD were significantly higher in GISTs than in the GILs group (63.10 ± 23.29 vs. 57.70 ± 22.67, p = .011; 26.24 ± 8.99 vs. 24.30 ± 8.26, p = .015). TMratio, TSratio, and TWratio were also significantly higher in GISTs group (0.97 ± 0.37 vs. 0.81 ± 0.28, p < .001; 0.42 ± 0.14 vs. 0.38 ± 0.12, p < .001; 2.65 ± 1.36 vs. 2.16 ± 1.02, p < .001). The AUC of Tmean was 0.952 (95% CI 0.897–1.000), which can better distinguish GIST from GIL; the sensitivity was 0.900, the specificity was 0.975, and the Youden Index was 0.875, and the cutoff was 79.64. The AUCs of TMratio, TSratio, and TWratio were 0.917 (95% CI 0.844–0.991), 0.897 (95% CI 0.812–0.981), and 0.929 (95% CI 0.8870–0.987), respectively. The aforementioned data was verified in the clinical cases of known results, including 40 GISTs and 40 GILs. The sensitivity of Tmean, TMratio, TSratio, and TWratio for diagnosis of GIL was 97.5%, 82.5%, 95%, and 97.5%, respectively. And they were 62.5%, 95%, 80%, and 92.5% for GIST.
Conclusion
The application of Photoshop combined with EUS to detect the gray value and standard deviation has a specific value in distinguishing GIST from GIL, but with some deviation. Applying the gray value ratio also has great discrimination significance and can avoid the differences in operation from different instrument and equipment personnel. Therefore, it is worthy of clinical promotion in the future.
Background
Gastrointestinal stromal tumors (GISTs) and leiomyomas (GILs) are the most common gastrointestinal submucosal tumors (GMTs) [Citation1]. With the development of endoscopic and radiologic technology, the diagnostic rate and accuracy of GMTs have significantly elevated [Citation2]. GISTs and GILs are often incidentally detected by endoscopy with no notable clinical symptoms [Citation3]. However, the prognosis of the two tumors is significantly different, and GISTs with malignant potential often predict a worse outcome [Citation4].
Endoscopic ultrasound (EUS) is generally used to differentiate GISTs from GILs [Citation5]. However, the image characteristics of GISTs and GILs under EUS are easily confused, and the application of EUS alone cannot accurately distinguish between GISTs and GILs. In addition, EUS is subjective in diagnosing lesions, and the accuracy rate is closely related to the experience of operators [Citation6]. Recently, some researchers demonstrated that the mean gray values and the standard deviation of GISTs and GILs measured by Photoshop ranged from 59.97 to 88.1 and 39.39 to 58.08, respectively [Citation6,Citation7]. These results prompt that Photoshop software may be an approach to assist EUS in distinguishing the features of GISTs from GILs. However, these studies have small sample sizes and are subject to the influence of equipment. Based on these circumstances, we want to explore a method for clinicians easily and accurately distinguish the two tumors regardless of the impact of the equipment and experience.
Materials and methods
Patients
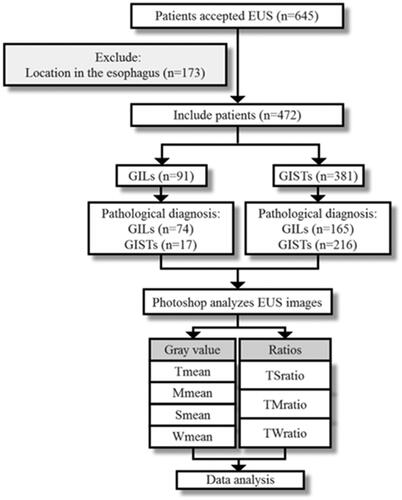
A retrospective analysis of the medical records of patients with GISTs or GILs confirmed by resection specimens histopathology were collected, all patients have received EUS examination in the Second Hospital of Tianjin Medical University from June 2014 to June 2020. The inclusion criteria were as follows: (1) pathologically diagnosed as GISTs or GILs; (2) clear EUS images; (3) complete clinical data records; (4) lesions located in the stomach. Patients who were combined with vital organ diseases were excluded. This study was approved by the Ethics Committee of the hospital and by the ethical guidelines of the Declaration of Helsinki. Each participant provided written informed consent before the study. Each patient was examined by an endoscopist who did not know the patient’s clinical history or the purpose of the study. We included 472 patients in the study, 239 with GILs and 233 with GISTs, who were screened to meet the criteria ( contains a study flow chart).
Figure 1. Flow diagram describing the selection of the study population.
Follow up validation tests were conducted in 40 patients with GISTs and 40 patients with GILs with known result subsequently.
EUS images
EUS was performed by a 20-MHz radial-scanning ultrasonic endoscope (Olympus, Tokyo, Japan) with the CLV-260SL image processing system, EUS-ME1 ultrasound endoscope host, and the driver of MAJ-935. EUS images for each patient were performed by two experienced endoscopists. Each lesion was saved with at least ten still EUS images. Only one highest quality still EUS image was selected for further digital image analysis.
Photoshop analysis image
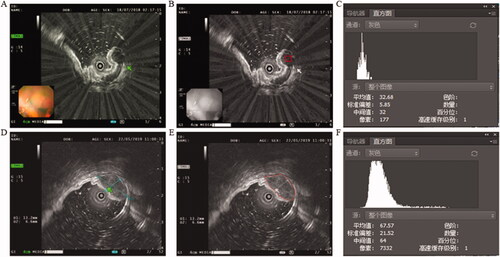
Photoshop is a widely used image processing software. As an image processing and analysis software, it has the characteristics of simple operation and powerful functions which is widely used in medicine and scientific research. In this study, we directly measured the gray information contained in EUS images of GISTs and GILs processed by Photoshop. Processed EUS image with Photoshop software, select ‘image’ → ‘mode’ → ‘grayscale’→ ‘Throw away’ color information, and select the region of interest area (If the lesion area is homogeneous echogenic, select the central area for measurement; otherwise, select the contour of the lesion for measurement) of tumor/muscularis propria/submucosa and water to be measured the gray value by the lasso tool.
To eliminate the differences between different hospitals and equipments, we also compared the ratio of the gray value of tumor to the gray value of the muscularis propria (TMratio), submucosa (TSratio), and water (TWratio) respectively ().
Figure 2. (A) EUS images of GIL, green arrow pointing to the tumor. (B) Selected region of interest labeled red bounding boxes after Photoshop processing. (C) The gray value of GIL. (D) EUS images of GIST, green arrow pointing to the tumor. (E) Selected region of interest labeled red bounding boxes after Photoshop processing. (F) The gray value of GIST.
Statistical analysis
The data were analyzed by SPSS 22.0. All data were presented as mean ± standard error (SEM). ROC curves were analyzed by R software v3.6.1. AUCs, specific and sensitivity values were calculated by the ‘pROC‘ package. The optimal diagnostic cut-off value was analyzed by maximizing the Youden Index. Comparisons between the two groups were carried out with a two-tailed Student’s t test. To identify the variables that were significantly associated with GISTs and GILs, the χ2 test or Fisher’s exact test was used. Two-sided p values less than .05 were considered significant.
Results
Patient characteristics
Four hundred seventy-two patients were enrolled in this study, 239 GILs and 233 GIST were located in the stomach. There were 65 males in the GILs group, and 80 males in the GISTs group (p = .114). The diameter of the lesions ranged from 0.3 to 5.0 cm. The average diameter of GILs was (1.01 ± 0.55) cm and that of GISTs was (1.08 ± 0.64) cm (p = .189). The average age of the patients in the GILs group was significantly lower than that of the GISTs group (50 ± 10.72 vs. 60.24 ± 8.30, p < .001). The characteristics of the 432 patients are shown in .
Table 1. Baseline characteristics of the patients with histologically confirmed GISTs or GILs.
Assessment gray value of GISTs and GILs by Photoshop
EUS images were processed and calculated by the mean gray value of tumor (Tmean), muscularis propria (Mmean), submucosa (Smean), and water (Wmean) by Photoshop. Tmean and TSD were significantly higher in GISTs than in GILs group (63.10 ± 23.29 vs. 57.70 ± 22.67, p = .011; 26.24 ± 8.99 vs. 24.30 ± 8.26, p = .015). The mean ratio values (TMratio, TSratio, TWratio) were significantly higher in the GISTs group than in the GILs group (0.97 ± 0.37 vs. 0.81 ± 0.28, p < 0.001; 0.42 ± 0.14 vs. 0.38 ± 0.12, p < .001; 2.65 ± 1.36 vs. 2.16 ± 1.02, p < .001) ().
Table 2. Detailed of gray value and the mean ratio values of GISTs and GILs by Photoshop.
Diagnostic significance of gray value for GISTs and GILs
The efficacy of distinguishing between GISTs and GILs was analyzed based on the AUC value. For all of the patients, the AUC value of Tmean in distinguishing between GISTs and GILs was 0.952 (95% CI 0.897–1.000), the sensitivity is 0.900, the specificity is 0.975, the Youden Index is 0.875 and the cutoff is 79.64, whereas the AUC value of Mmean was 0.479 (95% CI 0.393–0.649), the Smean was 0.625 (95% CI 0.499–0.746), and the Wmean was 0.538 (95% CI 0.334–0.589). The diagnostic values of Tmean showed good performance. The sensitivity, specificity, and the Youden Index are shown in and .
Figure 3. The area under the ROC curve of GISTs and GILs. (A) Tmean and Tsd; (B) Mmean, Smean, and Wmean; (C) TMratio, TSratio, and TWratio.
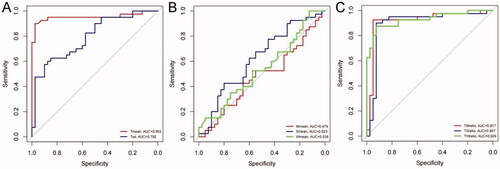
Table 3. Area under the curve, 95% CI, sensitivity, specificity, Youden Index and Cutoff point of datas for GISTs and GILs.
Diagnostic significance of ratios for GISTs and GILs
The AUC values of ratios (TMratio, TMratio, and TWratio) in differentiating GILs and GISTs were 0.917 (95% CI 0.844–0.991), 0.897 (95% CI 0.812–0.981), and 0.929 (95% CI 0.8870–0.987) respectively. The sensitivity and specificity of TMratio are 0.925 and 0.950 respectively, the Youden Index is 0.875 and the cutoff is 1.0907. The sensitivity and specificity of TSratio are 0.900 and 0.925 respectively, the Youden Index is 0.825, and the cutoff is 0.477. The sensitivity and specificity of TWratio are 0.875 and 0.925 respectively, the Youden Index is 0.8, and the cutoff is 3.236.
The results of prediction experiment
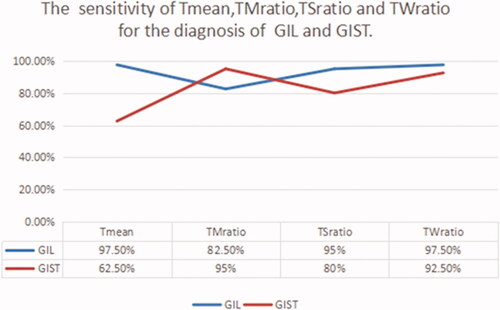
Eighty patients with pathological diagnoses of GIL and GIST were selected to participate in the prediction experiments. The sensitivity of Tmean, TMratio, TSratio, and TWratio for diagnosis GIL was 97.5%, 82.5%, 95%, and 97.5%, respectively. And they were 62.5%, 95%, 80%, and 92.5% for GIST. The sensitivity of Tmean, TMratio, TSratio, and TWratio is shown in .
Figure 4. The sensitivity of Tmean, TMratio, TSratio, and TWratio for the diagnosis of GIL and GIST.
Discussion
GISTs and GILs are the most common subepithelial tumors of the gastrointestinal tract [Citation8]. They are usually detected by gastroscopy with no notable clinical symptoms. Most GISTs and GILs rely on pathology to be distinguished after surgery [Citation9]. GISTs are usually malignant and have characteristics of recurrence and metastasis, whereas GILs are thought to be benign tumors [Citation10]. Therefore, it is important to distinguish these two lesions before surgery.
EUS can usually display the characteristics (such as diameter, shape, boundary, echo characteristics, infiltration signs, and adjacent organs) of tumors [Citation11]. Kim et al. [Citation12] reported that uneven echoes, hyperechoic points, marginal halos, and higher echoes compared with the surrounding muscle layer were observed more frequently in GISTs than in GILs. Lesions with at least two of these features have a sensitivity of 89.1% and specificity of 85.7% for predicting GISTs. The rounded and irregular edges of lesions also suggest the endoscopic features of GISTs [Citation13]. This study showed that the misdiagnosis rate of GIST by EUS was as high as 69.62%. Endoscopic ultrasound-guided fine-needle aspiration biopsy (EUS-FNA) is valuable for the preoperative diagnosis of gastrointestinal submucosal tumors. Still, its diagnostic accuracy and inadequate sampling rate are susceptible to the size of the lesion, so it has not been widely used in clinical practice for SMT. In the diagnosis of solid pancreatic lesion, real-time endoscopic ultrasound elastography and strain ratio play an important role, they can increase the accuracy of the differentiation of benign from malignant solid pancreatic lesion [Citation14]. But Guo et al. found that there was insufficient evidence to support the use of EUS elastography in differential diagnosis of GISTs and GILs. More powerful data are needed to determine the utility of EUS elastography in differentiating these two diseases [Citation15].
Currently, there are many reports about Photoshop-assisted EUS to identify GISTs from GILs [Citation7,Citation16]. Lee et al. have reported two studies [Citation7,Citation13]. The first is the analysis of EUS images of 65 cases of gastric GISTs and non-GISTs (GILs or schwannoma) in 2014 [Citation16]. The results showed that the grayscale Tmean and TSD of gastric GISTs were significantly higher than non-GISTs (p < .05). The other research was based on the first research, which included age, gender, and origin, conducted a scoring system (GIST-predictive scoring system) to distinguish gastric GISTs from non-GIST [Citation7]. This research has verified the results of previous research and concluded that the gray value could indeed distinguish GISTs from GILs more accurately. It is known to us that leiomyomas are generally more hypoechoic, less vascular with no infrequent areas of breakdown compared to GISTs. The gray value of GILs is significantly lower than GISTs (p = .011), consistent with the lower density of GILs, which is difficult to be distinguished by naked eyes.
Although Photoshop can achieve good diagnostic performance, it has been discovered that the gray values of EUS images measured in different reports were quite diverse. This difference may be originated from different devices and the methods of processing pictures. The mean gray values of GISTs and GILs ranged from 59.97 to 88.1 and 39.39 to 58.08, respectively [Citation7,Citation16,Citation17]. The gray values of EUS images discover many details that cannot be found by the naked eyes, which reducing the subjective judgments by the operators improving the accuracy of diagnosis. The value of TMratio, TSratio, and TWratio were applied in the research first time to overcome the diversity of gray values in different hospitals and equipment. The AUC values of ratios (TMratio, TMratio, and TWratio) were 0.917 (95% CI 0.844–0.991), 0.897 (95% CI 0.812–0.981), and 0.929 (95% CI 0.8870–0.987), respectively. It is identified that TMratio, TSratio, and TWratio had high diagnostic values for GISTs and GILs. The same conclusion was also obtained in the subsequent validation tests. Therefore, it is proposed that applying the gray value ratio should identify GIST and GIL more effectively.
There are still some limitations in this research. First, as mentioned earlier, this study is a retrospective study of single-center, thus requiring further verification by a multi-center prospective study. Second, selecting interesting regions is also subjective, which needs to be verified further by prospective studies with large samples. Although artifact interference is excluded as far as possible during image acquisition, it is still difficult to avoid the existence of interference completely, which will also affect the results. In the future, multi-centers researches with considerable sample verification are required.
Conclusion
In this research, the excellent performance of Photoshop-assisted EUS in identifying GISTs, and GILs were verified. To overcome the difference between different hospitals and equipment, we applied the gray value ratios in this study for the first time. The results show that this ratio is of great clinical significance in distinguishing GIST from GIL. This method is worthy of large-scale clinical research to be promoted in the future.
| Abbreviations | ||
| EUS | = | endoscopic ultrasound |
| GIST | = | gastrointestinal stromal tumor |
| GIL | = | gastrointestinal leiomyoma |
| AUROC | = | the areas under receiver operating characteristics curve |
| GMT | = | gastrointestinal submucosal tumors |
Disclosure statement
No potential conflict of interest was reported by the author(s).
Additional information
Funding
References
- Yoo IK, Cho JY. Endoscopic treatment for gastrointestinal stromal tumors in the upper gastrointestinal tract. Clin Endosc. 2020;53(4):383–384.
- Song S, Wang X, Zhang S, et al. Efficacy and complications of submucosal tunneling endoscopic resection for upper gastrointestinal submucosal tumors and exploration for influencing factors. Zeitschrift fur Gastroenterologie. 2018;56(4):365–373.
- Sakamoto H, Kitano M, Kudo M. Diagnosis of subepithelial tumors in the upper gastrointestinal tract by endoscopic ultrasonography. World J Radiol. 2010;2(8):289–297.
- Eckardt AJ, Lang H, Gockel I. [Diagnosis and therapy of benign tumors of the esophagogastric junction]. Chirurg. 2014;85(12):1073–1080.
- Onishi M, Tominaga K, Sugimori S, et al. Internal hypoechoic feature by EUS as a possible predictive marker for the enlargement potential of gastric GI stromal tumors. GastrointestEndosc. 2012;75(4):731–738.
- Gress F, Schmitt C, Savides T, et al. Interobserver agreement for EUS in the evaluation and diagnosis of submucosal masses. Gastrointest Endosc. 2001;53(1):71–76.
- Lee MW, Kim GH, Kim KB, et al. Digital image analysis-based scoring system for endoscopic ultrasonography is useful in predicting gastrointestinal stromal tumors. Gastric Cancer. 2019;22(5):980–987.
- Zhang X, Modayil R, Criscitelli T, et al. Endoscopic resection for subepithelial lesions-pure endoscopic full-thickness resection and submucosal tunneling endoscopic resection. Transl Gastroenterol Hepatol. 2019;4:39.
- Su Q, Peng J, Chen X, et al. Role of endoscopic ultrasonography for differential diagnosis of upper gastrointestinal submucosal lesions. BMC Gastroenterol. 2021;21(1):365.
- Dumonceau JM, Deprez PH, Jenssen C, et al. Indications, results, and clinical impact of endoscopic ultrasound (EUS)-guided sampling in gastroenterology: European society of gastrointestinal endoscopy (ESGE) clinical Guideline – updated January 2017. Endoscopy. 2017;49(7):695–714.
- Fei BY, Yang JM, Zhao ZS. Differential clinical and pathological characteristics of esophageal stromal tumors and leiomyomata. Dis Esophagus. 2014;27(1):30–35.
- Kim GH, Park DY, Kim S, et al. Is it possible to differentiate gastric GISTs from gastric leiomyomas by EUS? World J Gastroenterol. 2009;15(27):3376–3381.
- Vaicekauskas R, Urbonienė J, Stanaitis J, et al. Evaluation of upper endoscopic and endoscopic ultrasound features in the differential diagnosis of gastrointestinal stromal tumors and leiomyomas in the upper gastrointestinal tract. Visc Med. 2020;36(4):318–325.
- Okasha H, Elkholy S, El-Sayed R, et al. Real time endoscopic ultrasound elastography and strain ratio in the diagnosis of solid pancreatic lesions. World J Gastroenterol. 2017;23(32):5962–5968.
- Guo J, Bai T, Ding Z, et al. Efficacy of endoscopic ultrasound elastography in differential diagnosis of gastrointestinal stromal tumor versus gastrointestinal leiomyoma. Med Sci Monit. 2021;27:e927619.
- Kim GH, Kim KB, Lee SH, et al. Digital image analysis of endoscopic ultrasonography is helpful in diagnosing gastric mesenchymal tumors. BMC Gastroenterol. 2014;14(1):7.
- Cheng B, Zhong L, Ding F, et al. [A comparative study of the diagnostic value of endoscopic ultrasonography with pathological features of upper gastrointestinal mesenchymal tumors]. Zhonghua nei ke za Zhi. 2009;48(9):724–728.