
Abstract
Background
Patients with liver cirrhosis are recommended ultrasonography screening for early detection of hepatocellular carcinoma to increase the chances of curative treatment. However, ultrasonography alone lacks in sensitivity. Adding plasma biomarkers may increase the detection rate. We performed a broad exploratory analysis to find new plasma proteins with potential applicability for HCC screening in patients with cirrhosis.
Methods
In a protein discovery cohort of 172 patients with cirrhosis or HCC, we screened for 481 proteins with suspension bead array or proximity extension assay. From these, 24 proteins were selected for further analysis in a protein verification cohort (n = 160), using ELISA, Luminex or an electrochemiluminescence platform. A cut-off model and a stepwise logistic regression model were used to find combinations of proteins with the best discriminatory performance between HCC and cirrhosis.
Results
Stepwise logistic regression revealed alpha-fetoprotein (AFP), decarboxy-prothrombin (DCP), thioredoxin reductase 1 (TXNRD1), and fibroblast growth factor 21 (FGF21) as the proteins with the best discriminatory performance between HCC and cirrhosis. Adding TXNRD1 to DCP and AFP increased the AUC from 0.844 to 0.878, and combining AFP, DCP and TXNRD1 with age and sex resulted in an AUC of 0.920. FGF21, however, did not further increase the performance when including age and sex.
Conclusion
In the present study, TXNRD1 improves the sensitivity and specificity of AFP and DCP as HCC screening tools in patients with cirrhosis. We suggest that TXNRD1 should be validated in prospective settings as a new complementary HCC biomarker together with AFP and DCP.
Introduction
Hepatocellular carcinoma (HCC) constitutes a significant health burden worldwide [Citation1], being the sixth most common form of cancer and the fourth leading cause of cancer-related death [Citation2]. The major risk factor for the development of HCC is liver cirrhosis [Citation3]. When diagnosed at an advanced stage, HCC carries a poor prognosis with a median survival of 1–2 years. In contrast, early detection of small tumors enables curative treatment with hepatic resection, ablation, or liver transplantation, yielding a 5-year survival of 50–80% [Citation4]. International guidelines therefore advocate ultrasound surveillance of risk groups for HCC development, such as patients with liver cirrhosis or chronic hepatitis B, to improve early detection [Citation5,Citation6]. Although non-randomized studies have found that HCC screening of risk groups reduces mortality [Citation7,Citation8], prospective trials showing this in cirrhotic patients are lacking. Ultrasound is investigator-dependent, and the visibility of the liver can be impaired by obesity or colon gas. Detection of small tumors (within Milan Criteria) with ultrasound alone has a sensitivity of only 45–60% [Citation9,Citation10]. Hence, there is a need of improved surveillance methods for early HCC detection.
Circulating plasma biomarkers have been explored as an alternative for HCC screening. Alpha-fetoprotein (AFP), which has been used as a screening tool since the 1990s [Citation11], is still the most widely used biomarker for HCC diagnosis and prognosis [Citation12]. However, as a diagnostic biomarker, AFP only achieves a sensitivity of 41-65% with a specificity of 80–94% [Citation13]. Descarboxy-prothrombin (DCP) and lens culinaris-reactive-fraction of AFP (AFPL3%) represent two other biomarkers that have been evaluated for HCC screening, showing comparable or lower performance to AFP [Citation14–16]. Other studies have explored osteopontin (OPN) [Citation17–19], golgi protein 73 (GP73) [Citation20–23], and glypican-3 (GP3) [Citation18,Citation22,Citation24,Citation25] as screening biomarkers for HCC, but results are diverging in different studies, and they are as a whole inferior to AFP.
Since no single biomarker has demonstrated sufficient performance as a screening tool, one strategy has been to use panels of biomarkers, for example AFP and DCP [Citation26,Citation27], and adding either ultrasound [Citation10] or clinical variables such as age and sex [Citation28–30]. Another approach has been to monitor AFP levels longitudinally and incorporate rising levels in a diagnostic algorithm [Citation31]. None of these strategies have however reached clinical routine. New biomarkers are thus greatly needed.
The screening of new biomarkers is a thoroughgoing process, especially if several candidates are being explored. However, affinity proteomics technologies developed in recent years offer powerful approaches for the large-scale profiling of blood-derived plasma [Citation32–34]. The aim of this study is to perform a broad screening of possible biomarkers for HCC using multiplex screening methods and in the next step verify those with the best performance with more specific singleplex methods. Finally, we aimed to evaluate the selected proteins in multivariable models.
Methods
Inclusion of patients and data collection
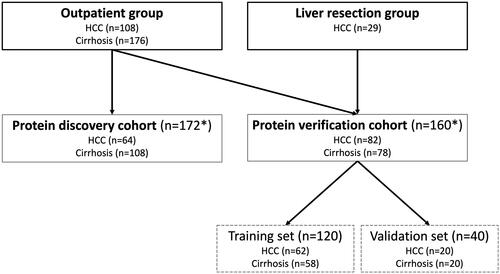
Subjects were recruited prospectively from the Department of Upper Gastrointestinal Diseases at Karolinska University Hospital, Stockholm, Sweden. Included subjects originated from two different patient groups. The first group consisted of outpatients with either liver cirrhosis or HCC (outpatient group). Patients with liver cirrhosis were recruited among those subjected to ultrasound surveillance, while HCC patients were recruited from those visiting the outpatient clinic after HCC diagnosis was established at a multidisciplinary conference. The second patient group consisted of patients with HCC that underwent curative liver resection (liver resection group). These two patient groups together were then divided into a protein discovery and a protein verification cohort ().
Figure 1. Flowchart of included patients. The outpatient group included 284 patients, from which the protein discovery cohort (n = 172) was derived from. The remaining patients in the outpatient group were combined with patients from the liver resection group to form the protein verification cohort (n = 160)*. Lastly, the protein verification cohort was divided into a training set and a validation set. *19 patients (9 HCC and 10 cirrhosis) from the protein discovery cohort were also included in the protein verification cohort.
The HCC diagnosis was based on either a) radiological criteria according to the European Association for the Study of the Liver (EASL) in a cirrhotic liver [Citation5], b) liver biopsy demonstrating HCC or c) histological examination of specimens from liver resections. The patients with liver cirrhosis without HCC constituted the comparison group. Liver cirrhosis was diagnosed by either a) having a transient elastography (Fibroscan) value above 15 kPa in combination with an underlying liver disease, b) liver biopsy demonstrating liver fibrosis stage 4 or c) having clinical and radiological signs of portal hypertension in combination with underlying liver disease. All patients with cirrhosis underwent biannual radiological screening for HCC, mainly with ultrasonography, without any signs of HCC before (<5 months) and at first examination after inclusion. Patients were included from 17th April 2013, to 17th September 2020.
Clinical data retrieved from medical charts included age, sex, Child-Pugh score, model of end-stage liver disease (MELD) score, liver disease etiology, platelets, bilirubin, albumin, prothrombin-time international normalized ratio (PT-INR), ascites, tumor size, tumor number, the extrahepatic spread of tumor and macrovascular invasion. The stage of HCC was determined according to BCLC criteria.
All included patients were above 18 years of age and had no other concurrent malignancies other than HCC. All subjects provided written informed consent. The study was approved by The Swedish Ethical Review Authority (EPM 2012/2141-31/1) and was conducted in accordance with the Declaration of Helsinki.
Sampling of blood and preparation of plasma
Venous blood samples were drawn from peripheral veins into vacuum tubes containing ethylenediaminetetraacetic acid (EDTA) as an anticoagulant. The samples were centrifuged within two hours at 2000 g for 10 min. Plasma was immediately separated, aliquoted and frozen at −80 °C until further analysis.
Screening of plasma proteins using Suspension Bead Array
The Suspension Bead Array (SBA) was used as the initial method for biomarker discovery [Citation35]. Candidate proteins for SBA were selected using two different methods. First, a literature review was performed on PubMed searching for ‘HCC’ together with ‘protein’, and ‘HCC’ together with ‘biomarker’. Published articles were evaluated and proteins with statistically significant different expression either in HCC tissue (compared to surrounding non-tumorous liver tissue) or in circulation of HCC patients (compared to patients without HCC), and proteins potentially involved in the pathogenesis of HCC were selected. Secondly, proteins most enriched in HCC tissue in the Human Protein Atlas were selected. Altogether, 382 different antibodies (targeting 232 proteins) were chosen for further analysis (Supplementary Table 1). SBA was performed according to the previous published protocol [Citation36] with the major steps summarized in Supplementary Materials and Methods. The analyses were performed at the Affinity Proteomics Unit at Science for Life Laboratory in Stockholm, Sweden.
Table 1. List of the 20 proteins with the highest fold-change in plasma levels in patients with HCC compared to those with cirrhosis. The proteins are sorted by decreasing values of fold-change in the SBA and PEA platforms, respectively.
Screening of plasma proteins with proximity extension assay
The Olink platform (Olink Proteomics, Uppsala, Sweden), based on proximity extension assay (PEA), was used to further identify additional protein biomarkers beyond the SBA method. The analysis was performed according to the manufacturer’s instructions at the Affinity Proteomics Unit, Science for Life Laboratory in Stockholm, Sweden. Three different Olink panels (Cardiometabolic, Immuno-oncology, Cardiovascular II) were used totally targeting 259 proteins (Supplementary Table 2). Ten proteins analyzed with PEA had already been analyzed with the SBA method, none of which had a fold-change above 1.3 in either method and thus not included in the top 20 proteins.
Table 2. Clinical and laboratory data of patients in the protein verification cohort (n = 160).
In total, 481 proteins (222 with SBA, 249 with PEA, 10 with both SBA and PEA) were screened.
Selecting plasma proteins for candidate validation
Since both SBA and PEA only generated relative quantification results, and SBA only utilized a single antibody for protein identification/quantification, more specific two-antibody methods with absolute quantification ability were needed.
Proteins from both the SBA and PEA methods were ranked by fold-change between the HCC and the cirrhosis group (). The proteins from each of the SBA and PEA platforms with the highest fold-change were prioritized for further analysis in the verification part of the study. Two proteins with a high fold-change in the SBA screening, BAIAP2L2 (BAR/IMD Domain Containing Adaptor Protein 2 Like 2) and ITPKA (Inositol-Trisphosphate 3-Kinase A), were disregarded due to lack of available and reliable analysis methods for protein quantification. S100A9 (S100 calcium-binding protein A9) was added to the selection list since it had the lowest p-value in the SBA screening, and HSP60 was also selected as it easily could be analyzed with a commercially available Luminex-kit. As a result of the PEA plasma protein profiling, both HGF (hepatocyte growth factor) and IL6 (interleukin 6) were selected as they also were easily available as Luminex-kits. In total, 18 proteins were selected for the verification analyses based on the screening from SBA and PEA assays (). Among current HCC biomarkers, we also selected DCP, AFPL3%, GP73, OPN, fibroblast growth factor 19 (FGF19) and fuc-AGP (hyperfucosylated AGP) [Citation37] for verification analyses (AFP was already included from the SBA screening). In total, 24 proteins were chosen for the protein verification analyses
Candidate biomarker verification
Verification of the 24 proteins was performed using commercially available ELISA-kits, Luminex-kits or an electrochemiluminescence platform, see Supplementary Material and Methods for more details.
Statistics
Description of the cohort
For the description of the cohort, median and interquartile range (IQR) were used for continuous variables and the number of cases together with proportion were used for categorical variables. Wilcoxon test was used for comparison between continuous variables and Chi-squared test between categorical variables. Statistical significance was set to p < 0.05. All statistical calculations were performed using R-studio (v 1.4).
Building of a predictive model for discriminating HCC from cirrhosis
The protein verification cohort of 160 patients was randomly split into a training set (n = 120) and a validation set (n = 40). Two different methods were used on the training set to build the predictive model.
In the first approach, a single cut-off for each protein biomarker was chosen, in which the sensitivity equaled the specificity as determined from the ROC curve for each protein. Combined models of two or more proteins were then created. The combined model assigned one point for every protein included in the model with a value above the designated cut-off for that specific protein. For instance, a four-protein model in a patient with three proteins above and one protein below the cut-off would give a total score of three points. A computer algorithm tested all possible combinations of two or more proteins in order both to find the optimal number of proteins and the optimal proteins included in that model.
In the second approach, logistic regression was employed. First, all proteins with significant differences (p < 0.05) between the HCC and cirrhosis groups were selected. Among selected proteins, stepwise regression (forward, backward, and bi-directional) was used to find combinations of these proteins in a multivariable model. The final multivariable model with the included proteins and their respective coefficients was used to calculate the log-odds for HCC in each patient. The calculated log-odds were then directly used as the score.
Each model was evaluated using ROC-curves, and the AUC was calculated. The cut-off with 90% sensitivity was chosen to create a model suitable as a first-line screening test for HCC, and the corresponding specificity was calculated.
The models developed from the training set (n = 120) were then tested on the validation set (n = 40), using the same included proteins and the same cutoffs/coefficients.
Results
Description of cohorts
A total of 313 patients were included into this study, with 284 patients from the outpatient group (108 HCC and 176 cirrhosis) and 29 HCC patients from the liver resection group.
The protein discovery cohort included 172 (64 HCC and 108 cirrhosis) of the 284 outpatients. The protein verification cohort included 160 patients (82 HCC and 78 cirrhosis) consisting of 131 outpatients (with 19 already included in the protein discovery cohort) and 29 liver resection patients (). The HCC patients were older in the protein verification cohort as compared to the protein discovery cohort (71 vs 66 years, p = 0.04), but no significant differences were seen regarding sex and Child-Pugh score.
The clinical data of the protein verification cohort is summarized in . The HCC group (n = 82) was older (71 vs 62 years) and included more males (82% vs 63%) as compared to the cirrhosis group. Of the HCCs, 56% were BCLC stage 0 or A. Fifteen patients (18%) had advanced HCC (six with macrovascular invasion, five with extrahepatic spread, and four having both macrovascular invasion and extrahepatic spread). The median number of tumors was 1 and the median tumor size 5.5 cm. Fifty-one of the 82 HCC patients had cirrhosis (62%), with 18 patients having Child-Pugh B and five Child-Pugh C.
The patients in the cirrhosis group displayed a higher frequency of ascites, higher bilirubin levels and lower platelet counts (all p < 0.05).
Screening of plasma proteins for target identification
The 20 proteins with the highest fold-change in the SBA and PEA analysis respectively are shown in . Of these 40 proteins, 18 were selected for verification analysis. Six previously described HCC biomarkers (AFPL3%, DCP, OPN, GP73, FGF19 and fuc-AGP), were also selected for protein verification.
Plasma protein verification
The proteins analyzed in the protein verification cohort are shown in . Nine proteins were elevated in the HCC group and four proteins were elevated in the cirrhosis group. Seven proteins were not significantly different at the p < 0.05 level between the groups. Of these, the plasma levels of NCOA1, GNA12, ISX, TPX2 was similar in HCC and cirrhosis samples already in a subset of patients, and therefore not analyzed on the whole cohort.
Table 3. Plasma levels of the analyzed protein biomarkers in patients with HCC and cirrhosis respectively, in the protein verification cohort (n = 160).
The ROC-curves of single proteins included in the subsequent multiprotein models (AFP, DCP, TXNRD1, FGF21, S100A9, AFPL3%) are shown in Supplementary Figure 1.
Lastly, the protein verification cohort of 160 patients was randomly sub-divided into a training (n = 120) and validation set (n = 40) for further analysis.
Predictive model using single cut-off values (training and validation sets)
Possible combinations of two or more proteins in the cut-off model were evaluated in the training set and tested in the validation set. Combinations with proteins elevated in the cirrhosis group or proteins with a too small fold-change to be reliably measured were excluded.
The combination with the highest AUC when including two proteins (AFP, DCP), three proteins (AFP, DCP and AFPL3%) and four proteins (AFP, DCP, TXNRD1 and S100A9) are shown in . Adding sex and age improved the AUC in all combinations. Additional proteins beyond four did not improve the AUC further (data not shown).
Table 4. The AUC values of the two-, three- and four-protein combination with the highest AUC in the cut-off model employed on the training set (n = 120), with values of the validation set (n = 40) shown in parenthesis. The panel to the right shows the AUCs when sex and age are included in the model.
Predictive model using logistic regression (training and validation sets)
When performing forward, backward and bi-directional stepwise logistic regression, the proteins AFP, DCP, FGF21 and TXNRD1 turned out as predictors. However, when including sex and age, FGF21 was no longer a significant predictor.
TXNRD1, FGF21 and AFPL3% were added to AFP and DCP in the regression model in all combinations, with and without sex and age (). The addition of TXNRD1 gave the largest AUC-increase and increase in specificity at 90% sensitivity. ROC-curves for different combinations of AFP, DCP, TXNRD1, sex and age are depicted in .
Figure 2. ROC curves for the combined score using the logistic regression method. The combination of DCP and AFP yielded an AUC of 0.844 (a). Addition of TXNRD1 increased the AUC to 0.878 (b), while addition of sex and age increased the AUC to 0.914 (c). The highest AUC (0.920) was achieved when all parameters were combined (d).
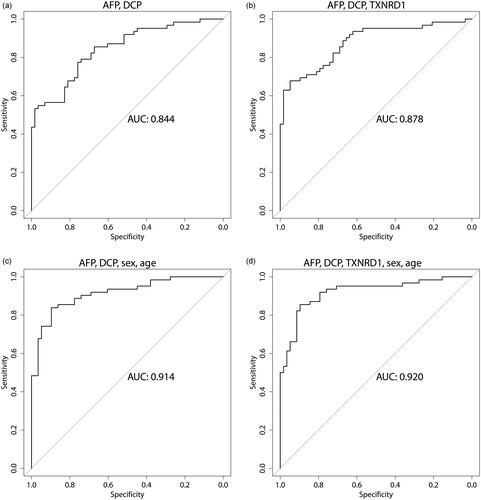
Table 5. The AUC values of different protein combinations in the logistic regression model employed on the training set (n = 120), with values of the validation set (n = 40) shown in parenthesis. The panel to the right shows the AUCs when sex and age are included in the model. AFP and DCP are included in every multiprotein combination being the proteins with the highest AUC, and with AFPL3%, FGF21 and TXNRD1 added in various combinations.
Difference in protein levels between early or advanced HCC compared to cirrhosis
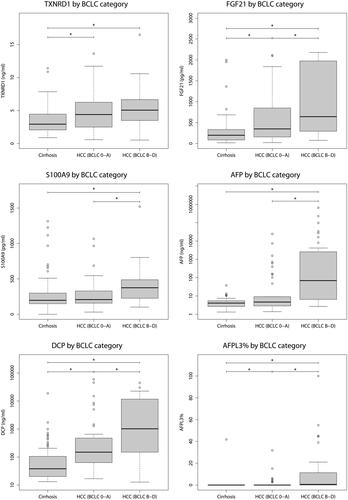
DCP, FGF21, TXNRD1 and AFPL3% all displayed a significant elevation in plasma from patients with early HCC (BCLC stage 0 or A) compared to those with cirrhosis. In contrast, AFP and S100A9 showed similar levels in early HCC and cirrhosis ().
Figure 3. Plasma concentrations of proteins included in either the cut-off or log-reg models (AFP, DCP, TXNRD1, FGF21, S100A9 and AFPL3%) between patients with cirrhosis, early HCC (BCLC stage 0 or A) and advanced HCC (BCLC stage B to D). All proteins were significantly increased when comparing patients with cirrhosis to those with HCC BCLC stage B to D, but only AFPL3%, TXNRD1, FGF21 and DCP demonstrated a significant difference between patients with cirrhosis and early HCCs with BCLC stage 0 or A.
Testing the log-reg model on HCC patients with BCLC 0 or A (n = 46) versus cirrhosis (n = 78), showed that the addition of TXNRD1 still increased the specificity at 90% sensitivity (Supplementary Table 3).
Plasma protein levels in cirrhotic and non-cirrhotic HCC patients
TXNRD1 levels in plasma were similar in HCC patients with and without cirrhosis (4.9 vs 4.8 ng/ml, p = 0.53). Patients with only cirrhosis had a TXNRD1 level of 2.9 ng/ml, significantly different from both HCC with and HCC without cirrhosis (both p < 0.01).
Similar results in HCC patients with and without cirrhosis were also seen for AFP (8.2 vs 7.0 ng/ml, p = 0.75) and DCP (173 vs 586 ng/ml, p = 0.11). Patients with only cirrhosis had significantly lower AFP (4.1 ng/ml, both p < 0.01) and DCP (38 ng/ml, both p < 0.01), compared to either HCC with or without cirrhosis.
Discussion
In this study, we performed a broad plasma protein profiling to identify circulating proteins for early detection of HCC. Several single proteins with significant differences between HCC and cirrhosis were found. Several multiprotein models were then tested. As demonstrated in , our results indicate that the log-reg model outperformed the cut-off model based on the same proteins. The log-reg model allows a more fine-tuned weighting of the included biomarkers, as well as allowing a continuous, instead of a dichotomous score, for each biomarker.
Stepwise logistic regression suggested DCP, AFP, FGF21 and TXNRD1 to be included, although FGF21 was not significant in the regression model when age and sex were added. Of these, AFP and DCP were included in all subsequent combinations, being the proteins with the highest AUC. FGF21, TXNRD1, and AFPL3% were added in different combinations. The addition of TXNRD1 yielded the highest AUC increase. Further addition of FGF21 improved the performance somewhat, indicating that FGF21 may enhance the precision further in an HCC biomarker panel. The results from our exploratory analysis suggest that TXNRD1, and maybe also FGF21, should be further tested in prospective settings.
TXNRD1 is an antioxidant enzyme that is involved in the reduction of thioredoxin, an important protein in the regulation of cellular redox homeostasis [Citation38]. TXNRD1 is increased in several tumor forms including lung cancer [Citation39], breast cancer [Citation40] and astrocytomas [Citation41]. TXNRD1 has also been shown to be increased in HCC tissue and associated with an unfavorable prognosis [Citation42], but measurement of circulating TXNRD1 has not previously been described. In our study, TXNRD1 was significantly elevated in early HCC (BCLC stage 0 or A) compared to cirrhosis, making TXNRD1 an interesting candidate in a multiprotein biomarker model for HCC screening in liver cirrhosis.
We found that FGF21 was significantly elevated in patients with early HCC and it had the highest AUC besides AFP and DCP. In the liver, FGF21 is involved in the regulation of the oxidation of fatty acids [Citation43]. FGF21 was suggested to have a protective role against HCC development in mouse models [Citation44,Citation45]. In contrast, elevated circulating FGF21 levels were associated with poorer HCC prognosis [Citation46]. These findings suggest further exploration of FGF21 as an HCC biomarker in patients with cirrhosis.
In our study, AFPL3% did not influence the sensitivity or specificity when combined with AFP and DCP. AFPL3% has previously been shown to be a biomarker candidate for HCC [Citation47]. However, its use may be limited by analytical difficulties. In the present study, AFPL3 was determined with ELISA while AFP was analyzed on a commercial electrochemiluminescence method, why the results should be interpreted with some caution.
In the present study, we also included an analysis of other proteins previously suggested as HCC biomarkers in the literature, namely OPN, GP73, GP3 and fuc-AGP. However, none of these could improve the discrimination between patients with cirrhosis from those with HCC in the present study.
In line with our results, a meta-analysis by Zhang et al. [Citation17] demonstrated similar levels of OPN in patients with HCC and in those with chronic liver disease, whereas differences only were observed when comparing HCC with healthy controls.
We found a significant difference in GP73 levels between HCC and cirrhosis patients, but surprisingly the HCC group had lower values. Although GP73 was previously suggested to increase HCC [Citation22], it also increases cirrhosis [Citation23]. Similar with our results, Gatselis et al. [Citation48] showed that GP73 has a stronger correlation to cirrhosis than to HCC.
HCC may alter the glycosylation of certain proteins. Fuc-AGP was previously reported to be significantly elevated in HCC patients in a study of plasma glycoproteins [Citation49], and when comparing HCC to non-HCC patients [Citation37]. Although we found a significant difference in the levels between HCC and cirrhosis patients in the present study, fuc-AGP did not improve the precision in our multiprotein models.
In this study, cirrhosis patients without HCC were selected as the comparison group. Cirrhosis represents the main target group for HCC surveillance. Since the liver is the prime organ to secrete the most abundant plasma proteins, we expected different levels between patients with cirrhosis and healthy controls. We consciously chose to not include healthy controls as non-diseased subjects would present with low levels of inflammatory or injury markers. Extrapolation of our results to other non-cirrhotic patients with an increased HCC risk, such as those with non-cirrhotic chronic hepatitis B or acute intermittent porphyria, should thus be done with care.
Several previous scoring models have been proposed which incorporate plasma proteins with clinical variables such as age and sex. One of the most validated is the GALAD-score including age, sex, AFP, AFPL3% and DCP [Citation28]. Although encouraging results as an HCC-screening tool in various cohorts with chronic liver diseases, it has yet not been implemented in clinical practice. Instead, a simpler but proprietary score with the same variables except for AFPL3%, has recently been introduced on a commercial platform (Elecsys® GAAD, Roche Diagnostics). We tested models including the components of both the GALAD and GAAD score, with neither having an AUC higher than the best model including TXNRD1, as demonstrated in .
The major strength of our study is the use of exploratory and complementary screening approaches that allowed us to study larger numbers of possible new biomarkers for HCC diagnostics. The use of quantitative antibody assays allowed us to confirm our observations in a largely independent set of patients. Also, the comparison group was selected to encompass only patients with a diagnosed liver cirrhosis, which is the main target group for surveillance.
We acknowledge several limitations. First, the relatively small cohort size decreases external validity, why this exploratory study needs to be validated in external cohorts. Second, the proportions of cirrhotic patients and the distribution between Child-Pugh classes differed between groups. However, subgroup analyses showed significant differences in TXNRD1, AFP and DCP levels between cirrhosis and HCC patients, irrespective if the HCC patients had cirrhosis or not. When comparing HCC patients with cirrhosis to those without, no significant difference in TXNRD1, AFP or DCP levels could be found. Thus, we conclude that the difference in cirrhosis frequency between groups does not affect the results. Another limitation is the inclusion of 15 patients with advanced HCC, in whom we cannot exclude more elevated protein levels. However, analyzing only patients with BCLC stage 0 or A yielded similar results. Also, the results have not been verified in an independent cohort. We divided our cohort into a training and validation set, but due to the small sample size, external validation of the results is crucial, preferably from different centers. We also acknowledge that other, currently not available molecular data, such as genetics, or lifestyle parameters could have an influence on our findings [Citation32].
In conclusion, our study indicates that circulating TXNRD1 may improve the performance of HCC screening with AFP and DCP in patients with liver cirrhosis. FGF21, although not significant in the regression model including sex and age, might still be of interest for further evaluation. Other previously suggested HCC biomarkers (OPN, GP73, GP3 and AFPL3%) had an inferior performance in discriminating HCC from cirrhosis. We also confirmed previous findings that including age and sex increased the performance of plasma protein screening models. Our results suggest further prospective evaluation of TXNRD1 as a complementary protein biomarker in addition to AFP and DCP for HCC surveillance in patients with cirrhosis.
| Abbreviations | ||
| ALD | = | alcohol-related liver disease |
| AFP | = | alpha-fetoprotein |
| AFPL3% | = | lens culinaris-agglutinin-reactive fraction of AFP |
| AUC | = | area under the curve |
| BCLC | = | Barcelona clinic liver cancer |
| CCL20 | = | C-C Motif Chemokine Ligand 20 |
| CES1 | = | carboxylesterase 1 |
| DCP | = | decarboxy-prothrombin |
| HCC | = | hepatocellular carcinoma |
| EDTA | = | ethylenediaminetetraacetic acid |
| ECL | = | electrochemiluminescence |
| FGF19 | = | fibroblast growth factor 19 |
| FGF21 | = | fibroblast growth factor 21 |
| fuc-AGP | = | hyperfucosylated alpha-1-acid glycoprotein |
| GNA12 | = | G protein subunit alpha 12 |
| GP73 | = | golgi protein 73 |
| HAOX1 | = | hydroxyacid oxidase 1 |
| HES4 | = | hes family BHLH transcription factor 4 |
| HGF | = | hepatocyte growth factor |
| HSP60 | = | heat shock protein 60 |
| IL6 | = | interleukin 6 |
| IL8 | = | interleukin 8 |
| ISX | = | intestine specific homeobox |
| IQR | = | interquartile range |
| KIM1 | = | kidney injury molecule 1 |
| MELD | = | model of end stage liver disease |
| MMP12 | = | matrix metallopeptidase 12 |
| NCOA1 | = | nuclear receptor coactivator 1 |
| OPN | = | osteopontin |
| PEA | = | proximity extension assay |
| PT-INR | = | prothrombin time – international normalized ratio |
| S100A9 | = | S100 calcium-binding protein A9 |
| SBA | = | suspension bead array |
| TPX2 | = | targeting protein for Xklp2 |
| TXNRD1 | = | thioredoxin reductase 1 |
Supplemental Material
Download PDF (1.8 MB)Acknowledgments
We would like to offer our special thanks to Maria Olin at Karolinska University Hospital for excellent work with the laboratory analyses.
Disclosure statement
The study has not been financed from commercial sources and none of the authors have received salaries or other funding from commercial sources. Ingvar Rydén and Peter Påhlsson are unpaid board members of Glycobond AB that own patents connected to the HepaCheC-assay (for analysis of hyperfucosylated alpha-1-acid glycoprotein). This does not alter our adherence to the Scandinavian Journal of Gastroenterology’s policies on sharing data and materials.
Data availability statement
The data that support the findings of this study are available from the corresponding author upon reasonable request.
Additional information
Funding
References
- El-Serag HB. Hepatocellular carcinoma. N Engl J Med. 2011;365(12):1118–1127.
- Sung H, Ferlay J, Siegel RL, et al. Global cancer statistics 2020: GLOBOCAN estimates of incidence and mortality worldwide for 36 cancers in 185 countries. CA: Cancer J Clin. 2021;71(3):209–249.
- Moon AM, Singal AG, Tapper EB. Contemporary epidemiology of chronic liver disease and cirrhosis. Clin Gastroenterol Hepatol. 2020;18(12):2650–2666.
- Villanueva A. Hepatocellular carcinoma. N Engl J Med. 2019;380(15):1450–1462.
- European association for the study of the liver. EASL clinical practice guidelines: management of hepatocellular carcinoma. J Hepatol. 2018;69(1):182–236.
- Heimbach JK, Kulik LM, Finn RS, et al. AASLD guidelines for the treatment of hepatocellular carcinoma. Hepatology. 2018;67(1):358–380.
- Choi DT, Kum HC, Park S, et al. Hepatocellular carcinoma screening Is associated with increased survival of patients with cirrhosis. Clin Gastroenterol Hepatol: 2019;17(5):976–987 e4.
- Singal AG, Zhang E, Narasimman M, et al. HCC surveillance improves early detection, curative treatment receipt, and survival in patients with cirrhosis: a meta-analysis. J Hepatol. 2022;77(1):128–139.
- Singal A, Volk ML, Waljee A, et al. Meta-analysis: surveillance with ultrasound for early-stage hepatocellular carcinoma in patients with cirrhosis. Aliment Pharmacol Ther. 2009;30(1):37–47.
- Tzartzeva K, Obi J, Rich NE, et al. Surveillance imaging and alpha fetoprotein for early detection of hepatocellular carcinoma in patients with cirrhosis: a meta-analysis. Gastroenterology. 2018;154(6):1706–1718 e1.
- Chalasani N, Said A, Ness R, et al. Screening for hepatocellular carcinoma in patients with cirrhosis in the United States: results of a national survey. Am J Gastroenterol. 1999;94(8):2224–2229.
- Galle PR, Foerster F, Kudo M, et al. Biology and significance of alpha-fetoprotein in hepatocellular carcinoma. Liver Int. 2019;39(12):2214–2229.
- Gupta S, Bent S, Kohlwes J. Test characteristics of alpha-fetoprotein for detecting hepatocellular carcinoma in patients with hepatitis C. A systematic review and critical analysis. Ann Intern Med. 2003;139(1):46–50.
- Zhou JM, Wang T, Zhang KH. AFP-L3 for the diagnosis of early hepatocellular carcinoma: a meta-analysis. Medicine. 2021;100(43):e27673.
- Park SJ, Jang JY, Jeong SW, et al. Usefulness of AFP, AFP-L3, and PIVKA-II, and their combinations in diagnosing hepatocellular carcinoma. Medicine. 2017;96(11):e5811.
- Fang YS, Wu Q, Zhao HC, et al. Do combined assays of serum AFP, AFP-L3, DCP, GP73, and DKK-1 efficiently improve the clinical values of biomarkers in decision-making for hepatocellular carcinoma? A meta-analysis. Expert Rev Gastroenterol Hepatol. 2021;15(9):1065–1076.
- Zhang Y, Gao J, Bao Y, et al. Diagnostic accuracy and prognostic significance of osteopontin in liver cirrhosis and hepatocellular carcinoma: a meta-analysis. Biomarkers. 2022;27(1):13–21.
- Lee HJ, Yeon JE, Suh SJ, et al. Clinical utility of plasma glypican-3 and osteopontin as biomarkers of hepatocellular carcinoma. Gut Liver. 2014;8(2):177–185.
- Sun T, Tang Y, Sun D, et al. Osteopontin versus alpha-fetoprotein as a diagnostic marker for hepatocellular carcinoma: a meta-analysis. OTT. 2018 11:8925–8935.
- Mao Y, Yang H, Xu H, et al. Golgi protein 73 (GOLPH2) is a valuable serum marker for hepatocellular carcinoma. Gut. 2010;59(12):1687–1693.
- Ozkan H, Erdal H, Tutkak H, et al. Diagnostic and prognostic validity of golgi protein 73 in hepatocellular carcinoma. Digestion. 2011;83(1–2):83–88.
- Wang Y, Yang H, Xu H, et al. Golgi protein 73, not glypican-3, may be a tumor marker complementary to alpha-Fetoprotein for hepatocellular carcinoma diagnosis. J Gastroenterol Hepatol. 2014;29(3):597–602.
- Xia Y, Zhang Y, Shen M, et al. Golgi protein 73 and its diagnostic value in liver diseases. Cell Prolif. 2019;52(2):e12538.
- Capurro M, Wanless IR, Sherman M, et al. Glypican-3: a novel serum and histochemical marker for hepatocellular carcinoma. Gastroenterology. 2003;125(1):89–97.
- Jiang D, Zhang Y, Wang Y, et al. Diagnostic accuracy and prognostic significance of glypican-3 in hepatocellular carcinoma: a systematic review and meta-analysis. Front Oncol. 2022;12:1012418.
- Marrero JA, Feng Z, Wang Y, et al. Alpha-fetoprotein, des-gamma carboxyprothrombin, and lectin-bound alpha-fetoprotein in early hepatocellular carcinoma. Gastroenterology. 2009;137(1):110–118.
- Lok AS, Sterling RK, Everhart JE, et al. Des-gamma-carboxy prothrombin and alpha-fetoprotein as biomarkers for the early detection of hepatocellular carcinoma. Gastroenterology. 2010;138(2):493–502.
- Best J, Bilgi H, Heider D, et al. The GALAD scoring algorithm based on AFP, AFP-L3, and DCP significantly improves detection of BCLC early stage hepatocellular carcinoma. Zeitschrift Fur Gastroenterologie. 2016;54(12):1296–1305.
- Johnson PJ, Pirrie SJ, Cox TF, et al. The detection of hepatocellular carcinoma using a prospectively developed and validated model based on serological biomarkers. Cancer epidemiology, biomarkers & prevention: a publication of the American association for cancer research, cosponsored by the.ASPO. 2014;23(1):144–153.
- Yang JD, Addissie BD, Mara KC, et al. GALAD score for hepatocellular carcinoma detection in comparison with liver ultrasound and proposal of GALADUS score. Cancer epidemiology, biomarkers & prevention: a publication of the American association for cancer research, cosponsored by the.ASPO. 2019;28(3):531–538.
- Biselli M, Conti F, Gramenzi A, et al. A new approach to the use of alpha-fetoprotein as surveillance test for hepatocellular carcinoma in patients with cirrhosis. Br J Cancer. 2015;112(1):69–76.
- Suhre K, McCarthy MI, Schwenk JM. Genetics meets proteomics: perspectives for large population-based studies. Nat Rev Genet. 2021;22(1):19–37.
- Deutsch EW, Omenn GS, Sun Z, et al. Advances and utility of the human plasma proteome. J Proteome Res. 2021;20(12):5241–5263.
- Correa Rojo A, Heylen D, Aerts J, et al. Towards building a quantitative proteomics toolbox in precision medicine: a mini-review. Front Physiol. 2021;12:723510.
- Schwenk JM, Igel U, Neiman M, et al. Toward next generation plasma profiling via heat-induced epitope retrieval and array-based assays. Mol Cell Proteomics. 2010;9(11):2497–2507.
- Dodig-Crnković T, Hong MG, Thomas CE, et al. Facets of individual-specific health signatures determined from longitudinal plasma proteome profiling. EBioMedicine. 2020;57:102854.
- Astrom E, Stal P, Zenlander R, et al. Reverse lectin ELISA for detecting fucosylated forms of alpha1-acid glycoprotein associated with hepatocellular carcinoma. PLOS One. 2017;12(3):e0173897.
- Nguyen P, Awwad RT, Smart DD, et al. Thioredoxin reductase as a novel molecular target for cancer therapy. Cancer Letters. 2006;236(2):164–174.
- Fernandes AP, Capitanio A, Selenius M, et al. Expression profiles of thioredoxin family proteins in human lung cancer tissue: correlation with proliferation and differentiation. Histopathology. 2009;55(3):313–320.
- Cañas A, López-Sánchez LM, Valverde-Estepa A, et al. Maintenance of S-nitrosothiol homeostasis plays an important role in growth suppression of estrogen receptor-positive breast tumors. Breast Cancer Res. 2012;14(6):R153.
- Esen H, Erdi F, Kaya B, et al. Tissue thioredoxin reductase-1 expression in astrocytomas of different grades. J Neurooncol. 2015;121(3):451–458.
- Fu B, Meng W, Zeng X, et al. TXNRD1 Is an unfavorable prognostic factor for patients with hepatocellular carcinoma. Biomed Res Int. 2017;2017:1–8.
- Tucker B, Li H, Long X, et al. Fibroblast growth factor 21 in non-alcoholic fatty liver disease. Metab clin Exp. 2019;101:153994.
- Singhal G, Kumar G, Chan S, et al. Deficiency of fibroblast growth factor 21 (FGF21) promotes hepatocellular carcinoma (HCC) in mice on a long term obesogenic diet. Mol Metab. 2018;13:56–66.
- Zhang Q, Li Y, Liang T, et al. Loss of FGF21 in diabetic mouse during hepatocellular carcinogenetic transformation. Am J Cancer Res. 2015;5(5):1762–1774.
- Liu ZY, Luo Y, Fang AP, et al. High serum fibroblast growth factor 21 is associated with inferior hepatocellular carcinoma survival: a prospective cohort study. Liver Int. 2022;42(3):663–673.
- Yi X, Yu S, Bao Y. Alpha-fetoprotein-L3 in hepatocellular carcinoma: a meta-analysis. Clin Chim Acta. 2013;425:212–220.
- Gatselis NK, Tornai T, Shums Z, et al. Golgi protein-73: a biomarker for assessing cirrhosis and prognosis of liver disease patients. WJG. 2020;26(34):5130–5145.
- Tanabe K, Kitagawa K, Kojima N, et al. Multifucosylated alpha-1-acid glycoprotein as a novel marker for hepatocellular carcinoma. J Proteome Res. 2016;15(9):2935–2944.