
Abstract
Background
Specific variations of short chain fatty acids in fecal samples have been shown for patients with inflammatory bowel disease. The aim of this study was to assess if Crohn’s disease and ulcerative colitis are associated with altered concentrations of short chain fatty acids also in blood plasma.
Method
Between 2016-2019, Swedish adults referred to a tertiary center for colonoscopy were asked to participate in a cross-sectional study. Individuals with Crohn’s disease or ulcerative colitis as well as individuals with no findings on the colonoscopy (defined as clean colon) were included in the study. Data on colonoscopy findings, blood samples (including haemoglobin, C-reactive protein and short chain fatty acid analysis) as well as a validated lifestyle questionnaire including 277 questions were collected from all participants. Linear regression was used to compare mean concentrations of short chain fatty acids between Crohn’s disease, ulcerative colitis and clean colon.
Results
The cohort consisted of 132 individuals with Crohn’s disease, 119 with ulcerative colitis and 205 with clean colon. In the crude model, succinic acid was significantly lower (p < 0.05) among patients with Crohn’s disease (mean 3.00 µM SE 0.10) and ulcerative colitis (mean 3.13 µM SE 0.10) in comparison to clean colon (mean 3.41 µM SE 0.08), however when adjusting for sex, age and diet the results did not remain statistically significant. No differences in plasma concentration of the other measured short chain fatty acids were detected.
Conclusion
Crohn’s disease and ulcerative colitis are not associated with altered short chain fatty acid concentrations in plasma. Further research is needed to confirm or refute our findings.
Summary
In this cross-sectional study including individuals with inflammatory bowel disease and healthy subjects we found no association between Crohn’s disease and ulcerative colitis and short chain fatty acid concentrations in plasma.
Introduction
Inflammatory bowel disease (IBD) is a severe chronic condition that requires lifelong monitoring and symptomatic treatment [Citation1]. The prevalence of inflammatory bowel diseases, Crohn’s disease (CD) and ulcerative colitis (UC) is increasing in high income countries, affecting 2.5 million patients in Europe [Citation2]. Although the pathogenesis of IBD remains unknown, a combination of genetic and lifestyle factors have been suggested in relation to both CD and UC [Citation1]. Intestinal microbiota may also play a role in the causal chain of IBD development [Citation3] and it has been hypothesized that both CD and UC may be caused, or at least exacerbated, by a T-cell mediated auto-immune response to a subset of commensal gut bacteria in genetically susceptible hosts [Citation4]. Reduced biodiversity and altered composition of the intestinal microbiome as compared to healthy subjects are frequently reported in IBD patients, where for example E. coli strains with specific features have been suggested to trigger disease in a subset of IBD patients [Citation5].
Short chain fatty acids (SCFA) are produced in the colon through fermentation of indigestible dietary fibres, proteins, and peptides by the gut microbiota [Citation6]. SCFA are defined as fatty acids with fewer than six carbons, including formic acid, acetic acid, propionic acid, butyric acid and valeric acid where acetic acid, propionic acid and butyric acid account for more than 95% of all SCFA in the human intestine [Citation7]. SCFA are absorbed by the colonocytes and enter the circulation via the portal vein with effect on general metabolism, liver function, skeletal muscle and adipose tissue [Citation8]. Some SCFA are key promoters of colonic mucosal barrier integrity and are involved in both pro and anti-inflammatory intestinal processes including regulation of cytokines and prostaglandins. Butyrate for example, is the major and preferred metabolic substrate for colonocytes providing a significant part of their energy requirements for proliferation and differentiation [Citation9]. Other important functions of SCFA include effects on colonic motility, colonic blood flow, and gastrointestinal pH, which in turn can influence uptake and absorption of electrolytes and nutrients [Citation10].
Because of the close interaction between SCFA and intestinal bacteria, gut dysbiosis in IBD patients may influence patterns of SCFA. Several smaller studies have investigated levels of colonic intraluminal SCFA in individuals with IBD, showing alterations of SCFA in IBD compared to healthy controls. Studies on SCFA levels in blood plasma are lacking [Citation11]. A specific pattern of SCFA in blood plasma possibly caused by gut dysbiosis and associated with IBD could be used as a marker for active disease. The aim of this study was to compare plasma concentrations of SCFA, among patients with IBD (with and without active inflammation) and healthy controls and to investigate these metabolites as possible markers of bowel inflammation.
Materials and methods
Study design and setting
This is a cross-sectional study including individuals (aged ≥18 years) referred for colonoscopy at Danderyd Hospital (a tertiary centre in Stockholm) between 1 November 2016 to 1 July 2019. All participants went through bowel preparation with Movprep®. Before colonoscopy, blood samples were taken for analysis of haemoglobin and C-reactive protein (CRP) and for analysis of SCFA in plasma. All study participants completed a comprehensive lifestyle questionnaire.
Participants
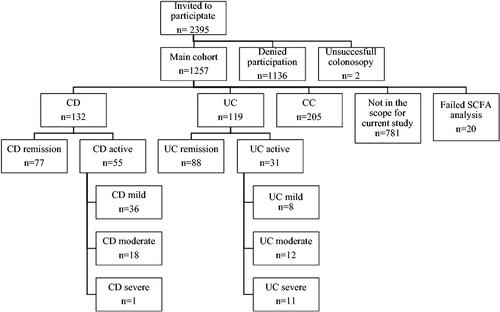
The study flowchart and the number of participants in is shown in . Of the 2,395 individuals asked to participate in the study, 1257 (52.5%) agreed on participating. Thereafter two individuals were excluded due to interrupted colonoscopy. All included individuals (n = 1257) gave written informed consent before participating in the study.
Additionally, 20 individuals were excluded due to failed SCFA analysis, and 781 individuals with other disease (diverticulosis, colorectal cancer, precancerous lesions) were not in the scope of the current study. Thus, in the current study, individuals with IBD, (‘CD’ n = 132 and ‘UC’ n = 119), and individuals with no findings on colonoscopy and no history of colorectal cancer or polyps, (‘Clean Colon’ (CC) n = 205) were included.
Figure 1. Consort diagram of the study population, excluded individuals and analytic sample. CD: Crohn’s disease; UC: ulcerative colitis; CC: clean colon.
Exposures
Information on IBD diagnosis, ‘CD’ or ‘UC’, and severity of disease was assessed by the examining endoscopist, graded in accordance with Simplified endoscopic activity score point system for CD (SES-CD) [Citation12] and Mayo endoscopic sub score for UC [Citation13]. For subgroup analysis, the participants with IBD were further categorized into ‘CD remission’ (SES-CD 0-2) and ‘CD active disease’ (mild (SES-CD 3-6), moderate (SES-CD 5-15), or severe disease (SES-CD > 15) and ‘UC remission’ (Mayo 0) or ‘UC active disease’ (mild (Mayo 1), moderate (Mayo 2) and severe disease (Mayo 3).
Outcomes
SCFA (formic-, acetic-, propionic-, butyric-, isobutyric-, isovaleric-, and valeric acid) as well as caprionic- and succinic- acids, were analyzed in EDTA plasma by liquid chromatography-mass spectrometry (LC-MS) according to a modified method described previously [Citation14]. All reference compounds, except for 13C6-3NPH (custom synthesized by IsoSciences Inc. King of Prussia, PA, USA), the internal standard for all SCFA, solvents, and reagents were purchased from Sigma-Aldrich. Hyper grade LC-MS water and MeOH (Lichrosol) were used, and all reagents and solvents were used for a maximum of 5 days and then replaced to avoid contamination issues. In brief, plasma (10 μl) was incubated with 75% methanol (60 μl) and mixed with 200 mM 3-NPH (60 μl) and 120 mM EDC-6% pyridine (10 μl) at ambient temperature for 45 min under gentle shaking. The reaction was quenched by the addition of 200 mM quinic acid (10 μl) at gentle shaking at ambient temperature for 15 min. The samples were centrifuged at 15,000 g for 5 min and the supernatant was moved to a new tube. The sample was made up to 1 mL by 10% methanol in water and again centrifuged at 15,000 g for 5 min. In total 100 μl of the derivatized (12 C) sample was mixed with 100 μl of labeled (13 C) internal standard. Samples were analyzed by a 6500+ QTRAP triple-quadrupole mass spectrometer (AB Sciex, 11432 Stockholm, Sweden) which was equipped with an APCI source and operated in the negative-ion mode. Analytes were separated on a Phenomenex Kinetix Core-Shell C18 (2.1, 100 mm, 1.7 um 100 Å) UPLC column with SecurityGuard ULTRA Cartridges (C18 2.1 mm ID). The column was backflushed for 60 min between each batch to ensure good chromatographic separation. LC-MS grade water (100% solvent A) and acetonitrile (100% solvent B) were the mobile phases for gradient elution. The column flow rate was 0.4 mL/min and the column temperature was 40 °C, the autosampler was kept at 5 °C. The gradient started at 0.5% B (held for 3 min), 2.5% B ramping linearly to 17% B at 6 min, then to 45% B at 10 min, and 55% B at 13 min. Followed by a flush (100% B) and recondition (0.5% B), a total runtime of 15 min. The Q1/Q3 pairs of each analyte were used in the MRM scan mode to optimize the collision energies for each analyte, and the two most sensitive pairs per analyte were used for the subsequent analyses. The retention time window for the scheduled MRM was 1 min for each analyte. For the two MRM transitions per analyte, the Q1/Q3 pair that showed the highest sensitivity was selected as the MRM transition for quantitation. The other transition acted as a qualifier for verification of the identity of the compound. Linear, 8-point calibration curves were prepared for each reference compound and used for quantification.
Covariates
The lifestyle questionnaire
Study participants completed a validated 13-page questionnaire [Citation15] with 277 questions to collect information on dietary-, lifestyle- and bowel habits during the past two weeks (including Bristol Stool Scale (BSS)). Data on sex, age, body mass index (BMI), smoking (smoker/nonsmoker), snuff use (user/nonuser) and education level were also retrieved from the questionnaire. Out of 456 individuals included in the study, 451 (98.9%), completed the lifestyle questionnaire. Educational level was categorized into ≤9 years, 10-12 years and ≥13 years of schooling. Bristol Stool Scale was categorized into the following groups: slow (BSS 1-4), normal (BSS 3-4 only), rapid (BSS 3-7) and varied (BSS both 1-2 and 5-7). Data on use of antibiotics during the past 3 months were registered.
Dietary components
From the lifestyle questionnaire, data on nutritional and dietary habits were collected. Average daily intakes (servings/day) of total fruits, vegetables, whole grains (crisp bread, whole grain bread, oatmeal, other porridge, müsli, quinoa, bulgur, and wheat bran), were calculated. All nutrients were energy-adjusted to the mean energy intake in the study population using the residual method [Citation16,Citation17]. A dietary score, the Alternate Healthy Eating Index (AHEI) [Citation18] was calculated from the questionnaire. The AHEI includes 10 components, where each of the following items were given a score between 0 and 10 proportionally to dietary intake: (1) vegetables, (2) fruit, (3) whole grains, (4) nuts and legumes, (5) saturated fatty acids, (6) polyunsaturated fatty acids, (7) alcohol consumption, (8) sugar sweetened drinks and fruit juices, (9) red and processed meat, and (10) sodium. A higher score represents a healthier diet.
Blood haemoglobin and C-reactive protein
Before colonoscopy blood samples were taken for analysis on haemoglobin and C-reactive protein. Haemoglobin was measured with Sysmex XN-9000 (Sysmex Europe GmbH, Bornbarch) and C-reactive protein was Cobas 8000 (Roche Diagnostics, Basel) in Karolinska University laboratory which is accredited according to ISO 15189.
Statistical methods
Results are presented as mean ± standard deviation (SD) for continuous variables and proportion for categorical variables. ANOVA-test was used for crude group comparisons of continuous variables and the chi-square test was used for comparisons of categorical variables. For associations, a univariate linear regression analysis was performed presenting mean ± standard error (SE) for each exposure (CD, UC, CC) and outcome (SCFA). The multivariate linear regression model included the following covariates: sex(nominal), age (continuous), AHEI(continuous). A p-value <0.05 was considered statistically significant. Analyses were performed using STATA 16.1 (Stata Corp.)
Results
Study population characteristics
Study population characteristics are shown in . The final cohort consisted of 132 individuals with CD, 119 with UC and 205 CC. The sex distribution differed between CD and UC in comparison to CC with more males with CD and UC, (p = 0.056, p < 0.001). Individuals with CD and UC were younger, 44.8 years and 51.5 years vs. 56.7 years (p < 0.001, p = 0.002) compared to CC. BMI was similar across the groups. Grading of stools according to the Bristol stool scale indicated a significantly higher proportion of individuals with rapid bowel emptying in CD (57.8%) and UC (49.6%) compared to CC (33.8%). Among the 132 individuals with CD, 77 (58.3%) were in remission while 36 (27.3%), 18 (13.6%) and 1 (0.8%) had mild, moderate, and severe disease respectively. Among individuals with UC, 88 (73.9%) were in remission while 8 (6.7%), 12 (10.1%) and 11 (9.2%) had mild, moderate, and severe disease at the time for colonoscopy. In analysis of dietary components, AHEI score was significantly lower in UC compared to CC (36.01 vs.39.64) (p = 0.010), but not in CD compared to CC (37.64 vs 39.64) (p = 0.14).
Table 1. Baseline characteristics of men and women with Crohn’s disease (CD) and Ulcerative Colitis (UC) as compared to clean colon (CC).
Levels of SCFA
The mean levels of SCFA for each exposure (CD, UC, CC) are shown in . Succinic acid was lower in CD 3.00 µM (SE 0.10) and UC 3.13 µM (SE 0.10) in comparison to CC 3.41 µM (SE 0.08), p < 0.05, however not significant when adjusting for sex, age and AHEI. No other significant differences were observed among the groups.
Table 2. Plasma concentration of SCFA according to CD and UC diagnosis.
Subgroup analysis for active versus disease remission is shown in . Mean concentrations of succinic acid were lower in all subgroups in comparison to CC but the difference between UC remission and CC was not statistically significant. In addition, a lower concentration of valeric acid was shown in CD active 0.07 µM (SE 0.01) in comparison to CC 0.10SDµM (SE 0,01), p < 0.05. In subgroup analysis, no differences in mean SCFA and succinic acid levels were shown after adjusting for sex, age and AHEI.
Table 3. Plasma concentration of SCFA according to CD and UC active or in remission diagnosis.
Discussion and conclusion
Main results
In this cross-sectional study comparing blood plasma concentrations of SCFA among 132 individuals with CD and 119 individuals with UC with 205 controls, lower concentrations of succinic acid among CD and UC patients were observed in univariate analysis. However, the findings were not statistically significant when adjusting for age, sex and AHEI. Similar results were shown when categorizing CD and UC according to active disease and remission. In addition, patients with active CD had lower concentrations of valeric acid. To our knowledge, this is the first study investigating plasma concentrations of SCFA in association with IBD in adults, and our results suggest that plasma SCFA concentrations may not be used as a marker for severity of disease in individuals with IBD.
Interpretation
Altered SCFA composition in plasma has previously been studied in relation to several other conditions. Higher concentrations of metylburytic acid have been observed in colorectal cancer and precancerous lesions in a cross-sectional study of 213 individuals [Citation19]. In a randomized trial testing intermittent fasting, continuous calorie restriction, and a control diet among 150 overweight or obese women and men, a small decrease in acetate, besides otherwise stable SCFA concentrations, was observed with weight loss after 12 weeks but SCFA did not differ across study arms [Citation20]. Parkinson’s disease has been associated with both dysbiosis [Citation21] and higher concentrations of acetic acid in plasma in a cross-sectional study [Citation22] suggesting a potential link between dysbiosis, gut inflammation and neurodegenerative disorders. Higher plasma levels of SCFA including propionate [Citation23] and butyrate [Citation24] have also been observed with higher dietary fibre intake in randomized clinical trials.
The association between IBD and SCFA in plasma is sparsely studied. In contrast to our study, in which we only found lower levels of succinic acid among IBD patients, a small study [Citation25] including only 6 pediatric IBD patients and 9 controls showed higher concentrations of isoburytic acid, 2-methylbutyric acid, isovaleric acid, valeric acid, isocaprionic acid, caprionic acid and propionic acid among IBD patients in comparison to controls. In addition, IBD patients also showed a higher ratio between concentration in plasma vs faeces for acetic, valeric, isocaproic, caproic and propionic acids, in comparison to controls indicating an increased gut-to-blood penetration of SCFA among IBD patients [Citation25]. The conflicting results could be due to heterogenicity in the studies (adult vs. pediatric cohorts) and different sample sizes (15 vs 456 individuals) as well as the lack of data on nutrition. SCFA levels in faeces in IBD patients are more widely studied. A recent meta-analysis reported lower concentrations of intraluminal acetate, propionate, butyrate and valerate and higher concentrations of lactate among IBD patients compared to controls [Citation11]. In addition, a reduction of butyrate was seen in UC patients with active disease compared to remission [Citation11]. This may indicate functional differences in the microbiota in IBD patients compared to healthy subjects leading to alterations in SCFA production and further damage to the intestinal barrier and increased inflammation. However, these results could not be confirmed in the current study where no differences in plasma SCFA concentrations were observed when comparing CD and UC to CC. A possible explanation may be that we examined SFCA in plasma and whereas the other studies used feces. Plasma concentrations may not necessarily reflect feces concentrations as SCFA is consumed by bowel enterocytes or metabolized in the liver resulting in that only a small portion of SCFA reaching the systemic blood circulation.
Our study showed lower levels of succinic acid in plasma among CD and UC patients compared to controls in the univariate analysis. Succinate is produced through two pathways, the mitochondrial pathway, and the microbial pathway. In microbial fermentation succinate is formed by partial reverse tricarboxylic acid [Citation26] reactions. Succinate can later become decarboxylated to form propionate [Citation27]. Succinate is also an intermediate metabolite of the tricarboxylic acid [Citation26] cycle, a central pathway in cellular respiration that takes place within the mitochondrial matrix. Since succinate is rapidly consumed as an intermediate in the production of propionate, it is detected at relatively low concentrations in the gut lumen [Citation28]. The major producers of succinate in the gut are bacteria belonging to the Bacteroidetes phylum, but bacteria in the Firmicutes, Proteobacteria and Actinobacteria phyla are also involved [Citation29]. Dysbiosis in the gut microbiota could disrupt the normal fermentation process and cause the accumulation of succinate. Increased levels of succinate in faeces have been observed in UC and CD patients in comparison to healthy controls [Citation30]. In our study, UC and CD were associated with lower levels of succinic acid, but the association did not sustain after adjusting for sex age and dietary habits. Thus, the elevated levels of succinate in faeces, shown in previous studies, do not seem to reflect the levels of succinate in plasma. This could be due to the metabolism of succinate in the gut lumen, the enterocytes, and the liver preventing the metabolite to reach systemic circulation but also the production of succinate outside the gut through the mitochondrial pathway [Citation26].
Strengths and limitations
This is to our knowledge the first study to evaluate levels of SCFA in plasma in an adult IBD cohort. In addition to previous research, this cohort also includes an extensive questionnaire with compliance of 98.9%, including detailed data on the participant’s dietary-, lifestyle- and bowel habits, which together with other objectively collected clinically important data, e.g., endoscopic disease activity status, strengthens the study. This study has also a substantially larger sample size than previous studies, however, there are some potential weaknesses. Firstly, all participants went through bowel preparation before blood samples were taken. Bowel preparation and fasting, which precede colonoscopy, could affect SCFA levels in plasma and mask possible differences between exposed and unexposed. Also, the individuals in the control group were chosen due to a lack of pathological findings in colonoscopy. But since they were referred to colonoscopy for some reason, they cannot be considered completely healthy controls. Another weakness includes the variables used in the regression model. It is still uncertain which covariates have the most influence on SCFA in blood plasma. Thus, we cannot exclude the impact of residual or uncontrolled confounding.
Finally, the IBD patients in this cohort were not treatment-naive and the effects of medications used to treat IBD on the gut microbiome are unknown.
Conclusion and planned future research
In this cross-sectional study investigating SCFA and succinic acid in plasma in association with IBD, we observed no differences in concentrations SCFA and succinic acid between CD, UC and CC in the adjusted analysis. The dysbiosis in the gut microbiota resulting in altered SCFA levels in faeces does not seem to affect plasma levels.
Author contributions
All authors meet the ICMJE-criteria for authorship. All authors have made substantial contributions to the conception and design of the study, acquisition, analysis and interpretation of data, drafting, revising and final approval of the article.
Ethical approval
The research protocol was approved 2016-02-03 by the Karolinska Institute Ethics Committee (2015/2138-31/2) and carried out in accordance with the declaration of Helsinki of the World Association (1989) (clinical trial number: NCT03302715, www.clinicaltrials.gov).
Disclosure statement
No potential conflict of interest was reported by the author(s).
Data availability statement
The datasets used and/or analyzed during the current study are available from the corresponding author upon reasonable request.
Additional information
Funding
References
- Kaplan GG. The global burden of IBD: from 2015 to 2025. Nat Rev Gastroenterol Hepatol. 2015;12(12):720–727.
- Molodecky NA, Soon IS, Rabi DM, et al. Increasing incidence and prevalence of the inflammatory bowel diseases with time, based on systematic review. Gastroenterology. 2012;142(1):46–54.e42; quiz e30.
- Marchesi JR, Adams DH, Fava F, et al. The gut microbiota and host health: a new clinical frontier. Gut. 2016;65(2):330–339.
- Sartor RB. Mechanisms of disease: pathogenesis of Crohn’s disease and ulcerative colitis. Nat Clin Pract Gastroenterol Hepatol. 2006;3(7):390–407.
- Loh G, Blaut M. Role of commensal gut bacteria in inflammatory bowel diseases. Gut Microbes. 2012;3(6):544–555.
- Sun M, Wu W, Liu Z, et al. Microbiota metabolite short chain fatty acids, GPCR, and inflammatory bowel diseases. J Gastroenterol. 2017;52(1):1–8.
- Cummings JH, Pomare EW, Branch WJ, et al. Short chain fatty acids in human large intestine, portal, hepatic and venous blood. Gut. 1987;28(10):1221–1227.
- Canfora EE, Jocken JW, Blaak EE. Short-chain fatty acids in control of body weight and insulin sensitivity. Nat Rev Endocrinol. 2015;11(10):577–591.
- Suzuki T, Yoshida S, Hara H. Physiological concentrations of short-chain fatty acids immediately suppress colonic epithelial permeability. Br J Nutr. 2008;100(2):297–305.
- Tazoe H, Otomo Y, Kaji I, et al. Roles of short-chain fatty acids receptors, GPR41 and GPR43 on colonic functions. J Physiol Pharmacol. 2008;59(Suppl 2):251–262.
- Zhuang X, Li T, Li M, et al. Systematic review and meta-analysis: short-chain fatty acid characterization in patients with inflammatory bowel disease. Inflamm Bowel Dis. 2019;25(11):1751–1763.
- Daperno M, D’Haens G, Van Assche G, et al. Development and validation of a new, simplified endoscopic activity score for Crohn’s disease: the SES-CD. Gastrointest Endosc. 2004;60(4):505–512.
- Mohammed Vashist N, Samaan M, Mosli MH, et al. Endoscopic scoring indices for evaluation of disease activity in ulcerative colitis. Cochrane Database Syst Rev. 2018;1(1):Cd011450.
- Han J, Lin K, Sequeira C, et al. An isotope-labeled chemical derivatization method for the quantitation of short-chain fatty acids in human feces by liquid chromatography-tandem mass spectrometry. Anal Chim Acta. 2015;854:86–94.
- Messerer M, Johansson SE, Wolk A. The validity of questionnaire-based micronutrient intake estimates is increased by including dietary supplement use in Swedish men. J Nutr. 2004;134(7):1800–1805.
- Larsson SC, Bergkvist L, Wolk A. Long-term dietary calcium intake and breast cancer risk in a prospective cohort of women. Am J Clin Nutr. 2009;89(1):277–282.
- Willett W, Stampfer MJ. Total energy intake: implications for epidemiologic analyses. Am J Epidemiol. 1986;124(1):17–27.
- Chiuve SE, Fung TT, Rimm EB, et al. Alternative dietary indices both strongly predict risk of chronic disease. J Nutr. 2012;142(6):1009–1018.
- Genua F, Mirković B, Mullee A, et al. Association of circulating short chain fatty acid levels with colorectal adenomas and colorectal cancer. Clin Nutr ESPEN. 2021;46:297–304.
- Sowah SA, Hirche F, Milanese A, et al. Changes in plasma short-chain fatty acid levels after dietary weight loss among overweight and obese adults over 50 weeks. Nutrients. 2020;12(2):452.
- Dutta SK, Verma S, Jain V, et al. Parkinson’s disease: the emerging role of gut dysbiosis, antibiotics, probiotics, and fecal microbiota transplantation. J Neurogastroenterol Motil. 2019;25(3):363–376.
- Shin C, Lim Y, Lim H, et al. Plasma short-chain fatty acids in patients with parkinson’s disease. Mov Disord. 2020;35(6):1021–1027.
- Vetrani C, Costabile G, Luongo D, et al. Effects of whole-grain cereal foods on plasma short chain fatty acid concentrations in individuals with the metabolic syndrome. Nutrition. 2016;32(2):217–221.
- Iversen KN, Dicksved J, Zoki C, et al. The effects of high fiber rye, compared to refined wheat, on gut microbiota composition, plasma short chain fatty acids, and implications for weight loss and metabolic risk factors (the RyeWeight study). Nutrients. 2022;14(8):1669.
- Jaworska K, Konop M, Bielinska K, et al. Inflammatory bowel disease is associated with increased gut-to-blood penetration of short-chain fatty acids: a new, non-invasive marker of a functional intestinal lesion. Exp Physiol. 2019;104(8):1226–1236.
- Hollister EB, Riehle K, Luna RA, et al. Structure and function of the healthy pre-adolescent pediatric gut microbiome. Microbiome. 2015;3:36.
- Connors J, Dawe N, Van Limbergen J. The role of succinate in the regulation of intestinal inflammation. Nutrients. 2018;11(1):25.
- Louis P, Flint HJ. Formation of propionate and butyrate by the human colonic microbiota. Environ Microbiol. 2017;19(1):29–41.
- Fernández-Veledo S, Vendrell J. Gut microbiota-derived succinate: friend or foe in human metabolic diseases? Rev Endocr Metab Disord. 2019;20(4):439–447.
- Vernia P, Caprilli R, Latella G, et al. Fecal lactate and ulcerative colitis. Gastroenterology. 1988;95(6):1564–1568.