
Abstract
Background and methods
We examined in NORDCAN database how the annual age group-specific incidence rates (IR) of gastric cancer (GCA), and correspondingly the GCA risk, have declined in Finland during the twentieth century, and whether this decline corresponds to a decrease in the cohort-specific prevalence rate of Helicobacter pylori (Hp) gastritis that is considered an important precancerous risk condition for GCA.
Results
In modelling with partial least squares regression (PLSR), the logarithmically transformed IRs (ln(IR) of GCA were well explained with age and birth cohort as explanatory model variables. By considering the observed (actual) and the PLSR-modelled IRs, the IR of GCA (and the risk of GCA) has decreased gradually in Finland from 1900 onward, cohort by cohort. By prediction of the future with PLSR, the IRs of GCA will be markedly lower in all cohorts during the twenty-first century than in the twentieth century. By PLSR modelling, less than 10 GCA cases per 100,000 people are predicted to appear annually in cohorts (generations) born at the turn of the 20th and 21st centuries, even when these people will be 60–80 years old in the years 2060–2070.
Conclusions
The IR of GCA and GCA risk progressively declined by cohort in Finland during the whole twentieth century. This decline corresponds in extent and time window to earlier observations in the decline of the prevalence rate of Hp gastritis in the same birth cohorts and supports the hypothesis of the role of Hp gastritis as an important risk condition of GCA.
Introduction
Gastric cancer (GCA) incidence rates are markedly declined worldwide, including Finland and all Nordic countries [Citation1–4]. Simultaneously, the birth cohort-specific prevalence rate of Helicobacter pylori (Hp) gastritis is decreased progressively in Finland over the past twentieth century, cohort by cohort, at a rate of some 10 per cent per decade [Citation5]. It is estimated that the cohort-specific prevalence rate and the risk of Hp gastritis will be practically nil in the cohorts (generations) of native Finns who are born at the turn of the 20th and 21st centuries [Citation5,Citation6].
Hp gastritis is considered a major environmental risk of GCA [Citation7,Citation8]. Therefore, one may assume that the age group-specific incidence rates (IR), and the risk of GCA respectively, should show similar epidemiological patterns as the case with Hp gastritis. In the present study, we examined in NORDCAN database how the age group-specific incidence rate (IR) of GCA per 10,000 people, and correspondingly the age group-specific risk of GCA, is changed during the past twentieth century regarding the age (‘age effect’), the period of cancer diagnosis (‘period effect’) and the year of birth (‘cohort effect’) as explanatory variables. Particularly, we focused on the question of how the changes in IRs of GCA are associated with the birth cohort and age. We assumed that similar trends should be noticeable in the relationship of GCA with the birth cohorts as the case is in the relationship between the prevalence rate of Hp gastritis and the birth cohorts in the twentieth century in Finland [Citation5,Citation6,Citation9].
Statistical modelling of the relationship of IRs of GCA in NORDCAN database with age, cohort and calendar period was carried out in the present study with the partial least squares regression (PLSR). In ‘Age-Period-Cohort’ (‘APC’) type analyses, collinearity between study variables is a problem that may invalidate the use of the ordinary and generalized multilinear regression models. PLSR and the corresponding iterative partial least squares approach, instead of the ordinary multiple linear regressions, offer options and statistical multivariate methods that are considered applicable in analyses of large complex data matrices even with incomplete and collinear (correlated) model variables as the case is typically in APC - studies, and concerns particularly cohort and period as study variables in the NORDCAN database on cancer [Citation10–13].
Material and methods
Study population
NORDCAN is a database on cancer incidence and mortality rates in Nordic countries (Sweden, Finland, Denmark, Norway, Iceland, Faroe Islands and Greenland) [Citation1]. NORDCAN database gives numbers of new cancer cases, including gastric cancer (GCA), as annual mean rates, e.g. as age groups specific rates of cancers per 100,000 people in 5-year age groups and in 5-year reporting periods, covering, thereby, comprehensive registration of cancer incidence or mortality data over a period of more than 50 years from large geographical area in Northern Europe [Citation1,Citation10,Citation11].
NORDCAN is a database incorporating data from all national Nordic cancer registries and is made available by the Association of Nordic Cancer Registries, ANCR [Citation14–15]. The registration of cancers is compulsory in all Nordic countries [Citation15]. Almost 100% coverage of incident cancer cases is achieved, which relies on reporting of cancer data from multiple sources, including physicians, hospitals, institutions with hospital beds, and including the pathology and cytology laboratories as well [Citation15].
Age groups, birth cohorts and periods (calendar year of GCA diagnosis)
Age group
NORDCAN database gives the number of new cancer cases as the mean annual rate per 100,000 people in 5-year age groups (from 20–24 years up to 85–84 years). In present analyses and calculations, the median year (e.g., 22 years in the age group 20–24 years, etc.) was used as an ‘index’ of each age group category.
Period of cancer diagnosis
NORDCAN database gives the data of IRs in 5-year reporting periods (from 1956–1960 to 2016–2020), covering thereby registration of cancer incidence rates over a time of more than 50 years. In present calculations, the median years (e.g., year 1958 in period category 1956–1960, etc.) were used as ‘index’ for each period category in the present study.
Birth cohort
The 5-year birth cohort groups were calculated for each data point of IRs by subtracting the median age of the age group category from the median year of each reporting period. This year was used as an ‘index’ and median value for each 5-year birth group category.
Final data matrix
The final data matrix from Finland composed of the rate of age group-specific IRs of GCA per 100,000 people in each 5-year reporting period (from 1956–1960 onwards) and included, in addition, the knowledge of age (as a median in 5-year age groups from 20–24 years to 80-84 years) and birth cohort (as a median in the 5-year interval from 190019–04 onward). Altogether, the final data matrix formed of 154 data points from age group-specific IR of GCA with simultaneous knowledge about age (‘age effect’), birth cohort (‘cohort effect’) and period (‘period effect’) of the GCA diagnosed in Finnish men and women born 1900–1904 or later. Similar data matrices were formed from IRs of GCA in Nordic males and females (Faroe Islands and Greenland excluded). From Nordic countries, the database of IRs of GCA is available from the period 1960-1964 onward.
PLS regression (PLSR)
PLS (partial least squares) regressions (PLSR) were carried out with commercial XLSTAT software in iMac and Windows with logarithmically (natural log) transformed rates of age group-specific incidence rates (IR) of GCA [Citation16]. In PLSR modelling, the ln(IR) data were applied as quantitative response Y-variable and calendar age (‘age effect’), birth cohort (‘cohort effect’) and period (‘period effect) as explanatory categorical X-variables. Standardized regression coefficients (beta coefficients; standardized for comparability by z-scores) of X-variables in PLSR were observed and used in interpretations of the rationale of ‘age effect’, ‘cohort effect’, ‘period effect’ as meaningful explanatory X-variables for the response Y-variable (ln(IR)).
PLSR is a PCA (principal component analysis) - a related statistical algorithm that uses latent parameters (vectors) in modelling of covariance matrices between the X- and Y-variables by seeking latent components to maximize the multidimensional directions of the X-space with the multidimensional variances of the Y-space, i.e. the IR of GCA (ln(IR)) as a parameter of Y-space and the explanatory variables (5-year categories of age, birth cohort and period) as parameters in X-space. PLSR is considered applicable when there exists collinearity between the variables as the case is typically in the ‘age-period-cohort’ (APC) - type analyses [Citation10–13].
Abbreviations concerning the goodness of fit statistics in PLSR models
DF: degree of freedom; Q2Y(cum): cumulative predictive ability of the model to explain the Y-variable(s); R2Y(cum) and R2X(cum): cumulative coefficients of determination to explain variation in Y- and X-variables, respectively; MSE: mean squared error, i.e. the squared difference between the estimated value and the actual value in the Y-parameter; RMSE: standard deviation of residuals indicating a prediction error.
In the selection of PLSR models, the Q2Y and R2Y indexes were considered most critical with a principle: ‘the closer the Q2Ycum and the R2Ycum index are to 1, and the closer they are to each other, with as few model parameters as possible, the better’. Q2Ycum index measures the global contribution and the relevance in predictions by the model and indicates the relevance of the model construct [Citation16]. As an index, Q2Y corresponds to R2Y when the PLSR is built on the training set and applied to the test set, and an index of Q2Y close to R2Y indicates the high predictability of the model.
Graphs
XLSTAT-3DPlot option was used in construction of the graphs [Citation16].
Ethics and authorizations
NORDCAN data are official and publicly offered by Association of Nordic Cancer Registries, ANCR [Citation2,Citation14]. Data do not include any personal and private contents.
Results
Observed (actual) age group-specific incidence rates (IR) of GCA in NORDCAN database per 100 000 people in calendar periods from 1956–1960 to 2016–2020 in Finnish men born 1900–1904 or later are presented in a graph format by 5-year categories of birth cohorts and calendar periods in and . Mutual relationship of the IRs with age, cohort and calendar periods among Finnish men are illustrated as 3D-graphs in and .
Figure 1. Age group-specific incidence rates (IR) of gastric cancer (GCA) per 100 000 people in relation to birth cohorts (‘cohort effect’) and age groups (‘age effect’) in NORDCAN database among Finnish men born in 1900–1904 or later. The figure on the left shows the IRs in cohort groups born from 1900–1904 to1960–1964 and the figure on the right demonstrates the IRs in cohort groups born from 1940–1944 to 1980–1984.
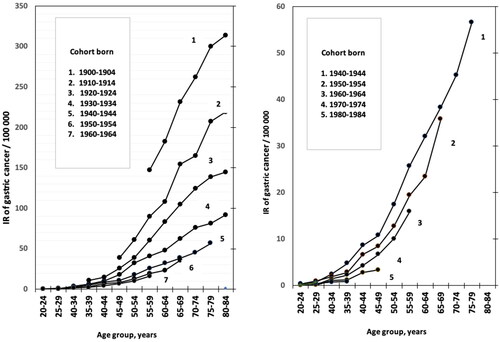
Figure 2. Age group–specific incidence rates (IR) of gastric cancer (GCA) per 100,000 people in relation to the period of GCA diagnosis (‘period effect’) and age groups (‘age effect’) in NORDCAN database in Finnish men born in 1900–1904 or later.
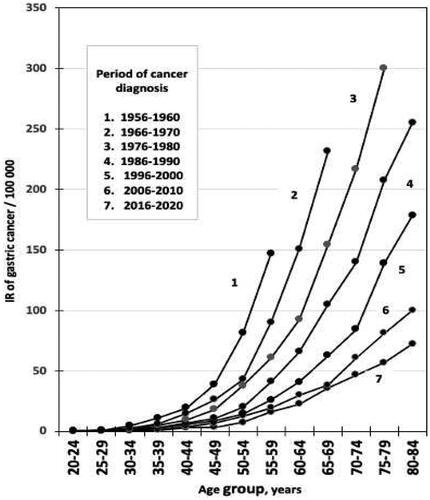
Figure 3. 3D–graph on age group specific incidence rates (IR) of gastric cancer (GCA) per 100,000 people in relation to birth cohort (‘cohort effect’) and age group (‘age effect’) in NORDCAN database in Finnish men born in 1900–1904 or later.
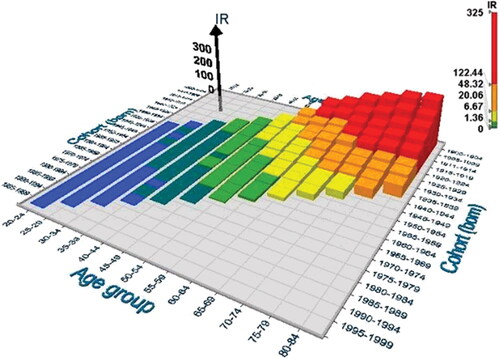
Figure 4. 3D–graph on the group specific incidence rates (IR) of gastric cancer (GCA) per 100,000 people in relation to period of GCA diagnosis (‘period effect’) and age group (‘age effect’) in NORDCAN database in Finnish men born in 1900–1904 or later.
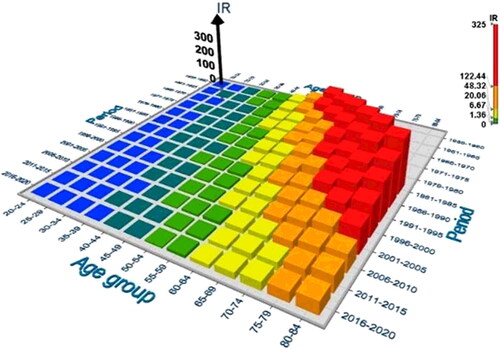
It appears by ordinary and 3D-graphs that the observed IR of GCA has gradually and exponentially declined in all birth cohort categories over the whole twentieth century, i.e. the IRs are invariably lower at the same age in the birth cohorts which are born later (‘cohort effect’) than in those born earlier during the twentieth century. On the other hand, the IRs tend to increase with the increase of age (‘age effect’) within each birth cohort, i.e. the higher the age of patient is in a cohort, the higher the IR of GCA as well.
As turns out in and as 3D-graphs, the birth cohorts and calendar periods show strong mutual collinearity. Mean annual IRs of GCA are high in men in ‘old’ birth cohorts but simultaneously in ‘old’ calendar periods as well, i.e. the IR of GCA is highest in 80-84-year-old men, born in 1900–1904 and diagnosed to have GCA in the first reporting period of the NORDCAN data in Finland, i.e., during the first calendar period 1956-1960 ( and ).
PLS regression (PLSR)
The logarithmically transformed IRs of GCA in Finnish men, born 1900 or later, fitted well the age (‘age effect’) and the birth cohort (‘cohort effect’) in PLSR model with high Q2Ycum and R2Ycum indexes when the age and cohort were applied as the only explanatory variables in same PLSR model (option [1] in ).
Table 1. Table on goodness of fit statistics of models tested by PLSR concerning observed IR of GCA as Y–variable and various combinations of age, cohort and period as explanatory X–variables. Observations from Finnish men.
A similar good fit also concerned the IRs of GCA to ‘age effect’ and ‘cohort effect’ as explanatory variables in Finnish women with Q2Ycum 0.901 and R2Ycum 0.942, and in Nordic men and women with Q2Ycum 0.937, R2Y cum 0.968 in men, and Q2Ycum 0.934, R2Ycum 0.968 in women. By applying period (‘period effect’) or age as the only X–variables, the explanatory power of the model was worse than by applying the age and cohort as explanatory variables together ().
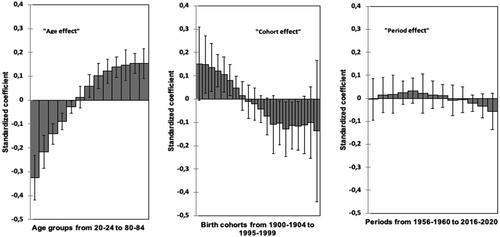
The standardized regression coefficients (‘beta’ coefficients; standardization with z–scores to get comparable coefficients) of age, cohort and period as explanatory X–variables in PLSR modelling of NORDCAN data in Finnish men are presented in . The size and 95%CIs in standardized regression coefficients suggest that particularly the age (‘age effect’) and the birth cohort (‘cohort effect’) are significant predictors for IRs of GCA ().
Figure 5. Standardized regression coefficients (with 95%CI) in PLSR with ln(IR) data of GCA as a quantitative response parameter and the consecutive 5–year categories of calendar age (‘age effect’), birth cohort (‘cohort effect’) and period (‘period effect’) of GCA diagnosis as explanatory variables without any interaction terms. Finnish men.
In modelling of IRs of GCA by PLSR with the age (‘age effect’) and birth time (‘cohort’) as explanatory X–variables, the estimated (predicted) IRs fit well the observed (actual) IRs of GCA in NORDCAN database, both in Finnish men and women (), but as well also in Nordic men and women.
Figure 6. Fit between the observed and predicted (estimated) ln(IR)s of GCA per 100 000 Finnish men and women in PLSR modelling (option [1] in ).
![Figure 6. Fit between the observed and predicted (estimated) ln(IR)s of GCA per 100 000 Finnish men and women in PLSR modelling (option [1] in Table 1).](/cms/asset/07290529-0b4e-4d4c-95f0-de9e1e578af4/igas_a_2220858_f0006_c.jpg)
Estimation of IRs of GCA by the PLSR modelling
shows how the age group-specific IRs of GCA, both the observed and the PLSR predicted ones, appear in Finnish men by applying the age and cohort together (model [1] in ) as explanatory variables. also gives the earlier estimates about the birth cohort-specific prevalence rates of H. pylori (Hp) infection in 10–year birth group categories in the general population in Finland (see references Citation8 and Citation9 for more details).
Table 2. Annual observed and PLSR–precited incidence rates (IR) of GCA per 100 000 people in 5–year categories of birth cohorts and age groups among native men born in Finland in 1900–1904 or later.
By observing both the actual and the predicted incidence rates of GCA, the age group-specific IR of GCA (and GCA risk correspondingly) have declined fast and consistently in Finland, cohort by cohort, during the past twentieth century (). The decrease in IRs of GCA resembles in extent and time window the decline in the prevalence rate of Hp gastritis in the same birth cohorts over the whole twentieth century ().
In future predictions by PLSR modelling, the annual mean IR of GCA is estimated to be below 10 GCA cases per 100,000 people in the ‘young’ generations (born at the turn of the 20th and 21st centuries), even if these people will be old, i.e., at age of 60–80 years in the years 2060–2070. For comparison, the corresponding IR of GCA was some 200 cases annually per 100,000 at the age of 60–80 years among Finnish men born in the early decades of the twentieth century ().
Discussion
Present observations suggest that birth cohort (the ‘cohort effect’) and age (the ‘age effect’) in PLSR modelling explain well the annual rates of age–group-specific incidences (IR) of GCA (IR per 100,000 people) of the NORDCAN database in the twentieth century, similarly in Finnish men and women, and among citizens in all Nordic countries as well. Therefore, one may assume that any specific risk factor, or specific carcinogenic mechanism related to the GCA pathogenesis, whatever they might be, must be associated with and explainable in context with the ‘age effect’ and the ‘cohort effect’.
In present PLSR modelling, the birth cohorts (‘cohort effect’) and the age groups (‘age effect’) explain the IR data (ln(IR)) of GCA as independent variables in same model with high Q2Ycum and R2Ycum indexes. ‘Period effect’ did not fit meaningfully and significantly the IR data, suggesting that any possible differences between periods in diagnostics and registrations of the GCA cases can hardly explain the marked changes in IRs of GCA in the NORDCAN data during the twentieth century. Eventually, the ‘cohort effect’ and ‘age effect’ seem to be the only independent demographic factors regarding the epidemiology of GCA in Finland and Nordic countries.
The PLSR was applied in the present investigation as a new research layout to model the relationship of the age–group specific IRs of GCA with age, period and cohort. PLSR is characterized as an iterative method for modelling large, even incomplete data matrices with multiple X and Y variables in linear and multivariate ways [Citation10–13,Citation16]. Instead of traditional and general linear regression methods, the PLSR technique creates new latent variables (vectors) to explain the Y–and X–variables, also in data sets where the variables are not independent and are collinear as the case is certainly in NORDCAN data on cancer incidences, concerning particularly the cohort and the period as explanatory variables [Citation10–13,Citation16]. As a benefit of PLSR, successful and proper modelling also gives an opportunity to mathematically estimate and predict the future risks and rates of cancer.
In such future prediction by PLSR, the IR of GCA is predicted to drop to levels below 10 GCA cases annually per 100,000 among native Finns that are born in 1990–1999 even when these people will be 60–80 years old in the years 2060–2070. For consideration, the corresponding IR of GCA (and risk of GCA) in men at the age of 60–80 years were some 200–300 GCA cases annually per 100 000 among the Finnish men who were born in the early 1900s (). This suggests that the GCA may practically disappear by the end of the twenty-first century from Finland and from all Nordic countries, except, predictably, some sporadic and strongly genetically determined GCA cases.
Noteworthy attention is that the decline in observed and PLSR–predicted IRs of GCA corresponds well with the previously described decline in prevalence rates of H. pylori (Hp) gastritis in the same birth cohorts [Citation5,Citation6,Citation17–21]. The extent and time window in the disappearance of both GCA and Hp infection seem to be similar during the twentieth century in Finland. Roughly 90% of people, both in both male and female sex, are estimated to have the Hp infection in Finland at the beginning of the 1900s, whereas this rate is now practically nil in generations (cohorts) born at the turn of the 20th and 21st centuries [Citation5,Citation6]. Therefore, one may assume that the Hp infection is the ultimate environmental ‘risk condition’ that acts as a factor that will decrease the mean rate and risk of GCA in cohorts (‘cohort effect’) but which also can act as a factor in ‘age effect’ that will raise the individual GCA risk in people within the cohorts.
Hp infection with subsequent chronic gastritis was considered ‘class 1 carcinogen’ (carcinogenic process) by the IARC already in 1994 (7). Hp infection is acquired in each birth cohort (generation) mostly in childhood and adolescence [Citation9,Citation19,Citation20]. Hp causes a life–long chronic progressive and active inflammation (chronic active gastritis) in stomach mucosa–if the infection is not actively eradicated [Citation22,Citation23]. The initial ‘non–atrophic Hp gastritis’ tends to develop with time (with an increase of age/exposure time) to ‘atrophic gastritis’ with more and more severe grade and may finally end up as an acid-free stomach in some patients [Citation22–29]. With an increase in exposure time to chronic inflammation, and with the progression of chronic gastritis to more and more severe forms of atrophic gastritis, the GCA risk will raise exponentially in people who sustain the ongoing Hp infection within each birth cohort [Citation8,Citation30–32]. Thus, the cohort–specific rate of Hp gastritis is a precancer condition that can determine the main overall risk and rate of GCA in each birth cohort but which can also determine the individual GCA risk in subjects in each birth cohort.
As the average risk of Hp infection decreases with time in a population or society in question, the mean cohort-specific GCA rate will correspondingly decline (‘cohort effect’). On the other hand, at an individual level (as an ‘age effect’) within each cohort, the GCA risk and rate can increase, even exponentially, among the individuals in each cohort who sustain the ongoing Hp infection, and in whom the existing chronic Hp gastritis will progress to atrophic gastritis with time (with an increase of exposure time and age) [Citation7,Citation8,Citation23,Citation31–33].
A large variety of environmental-specific risk factors are presented for GCA in the literature [Citation34,Citation35]. Theoretically, and due to the continuous decrease in GCA incidence rate during the whole twentieth century, any credible and specific environmental risk factors and any pathogenetic mechanisms of GCA should have been active already at the early beginning of the twentieth century but should also have been decreasing in action, gradually but fast, over the whole twentieth century, similarly in males and females, and similarly in all Nordic countries.
Due to the consistent decline of IR of GCA both in males and females with time, and similarly, in all Nordic countries, a plausible major specific or single environmental risk factor for GCA can hardly be, for example, any coincidental sex-related or local manner or habit (e.g. smoking, alcohol, exotic dietary manners or habits, or inherited gene defects, etc.). The specific carcinogenic factor must be environmental and equally comprehensive in both sexes and active as a risk for GCAs of both diffuse and intestinal subtypes. Otherwise, a nearly total disappearance of GCA over a period of 100–200 years, equally in males and females, or similarly in large geographical areas (Nordic countries) could hardly be possible. Hp gastritis fulfills these requirements as a general and long–term environmental precancerous condition of GCA [Citation7,Citation8,Citation21,Citation36].
There are several papers published as ‘Age–Period–Cohort (APC) analyses’ on rates of GCA incidence or particularly on mortality in different parts of the world [Citation37–46]. These investigations utilize data from cancer registers or data from case series and from variable periods. They apply Poisson regression in ‘APC analysis’ with ‘joint point trend tools’ from NIH. These studies suggest that the birth cohort–specific incidence or mortality rates of GCA have decreased worldwide with time, corresponding with the present observations. In contrast to some of the earlier observations, however, we could not find by PLSR modelling that the ‘period effect’ (period of GCA diagnosis) is a significant explanatory parameter for age group specific IRs and risk of GCA by the NORDCAN database.
Author contributions
All three authors participated in analysis of data and in writing of paper.
Disclosure statement
No potential conflict of interest was reported by the author(s).
Additional information
Funding
References
- NORDCAN–IARC https://www.kreftregisteret.no or https://www–dep.iarc.fr/nordcan/fi/frame.asp.
- Statistics on cancer in Nordic countries. 2022. https://nordcan.iarc.fr/.
- Wong MCS, Huang J, Chan PSF, et al. Global incidence and mortality of gastric cancer, 1980–2018. JAMA Netw Open. 2021;4(7):e2118457.
- Lin Y, Zheng Y, Wang H–L, et al. Global patterns and trends in gastric incidence rates (1988–2012) and predictions to 2030. Gastroenterology. 2021;161(1):116–127.e8.
- Sipponen P. Prevalence rates of heathy stomach mucosa, chronic non–atrophic and atrophic gastritis in endoscopic biopsies in adults born in Finland in 1890–1977. Scand J Gastroenterol. 2021;56(8):874–881.
- Sipponen P, Sarna S, Vohlonen I. When will Helicobacter pylori gastritis disappear in history in Finland? Scand J Gastroenterol. 2022;57(2):154–157.
- Helicobacter pylori IARC working group on the evaluation of carcinogenic risks to humans. Lyon, 7–14 June 1994. IARC Monogr Eval Carcinog Risks Hum. 1994;61:1–241. PMCID: PMC7681621
- Correa P. Helicobacter pylori and gastric carcinogenesis. Am J Surg Pathol. 1995;19(Suppl 1):S37–S43.
- Sipponen P. Helicobacter pylori: a cohort phenomenon. Am J Surg Pathol. 1995;19(Suppl 1):S30–S6.
- Wold S, Sjöström M, Eriksson L. PLS–regression: a basic tool of chemometrics. Chemometrics and Intelligent Laboratory Systems. 2001;58(2):109–130.
- Wold S, Ruhe H, Wold H, et al. The collinearity problem in linear regression. The partial squares approach to generalized inverses. SIAM J Sci and Stat Comput. 1984;5(3):735–743.
- Eriksson L, Antti H, Gottfries J, et al. Using chemometrics for navigating in the large data sets of genomics, proteomics, and metabonomics (gpm). Anal Bioanal Chem. 2004;380(3):419–429. .
- Tu Y–K, Smith CG, Gilthorpe MS. A new approach to age–period–cohort analysis using partial least squares regression: the trend in blood pressure in the glasgow alumni cohort. PLoS One. 2011;6(4):e19401.
- Pukkala E, Engholm G, Højsgaard Schmidt LK, et al. Nordic cancer registries–an overview of their procedures and data comparability. Acta Oncol. 2018;57(4):440–455.
- Leinonen MK, Miettinen J, Heikkinen S, et al. Quality measures of the population–based finnish cancer registry indicate sound data quality for solid malignant tumours. Eur J Cancer. 2017;77:31–39.
- Lumivero 2023. XLSTAT statistical and data analysis solution. New York, USA. https://www.xlstat.com/en.
- Sipponen P, Helske T, Järvinen P, et al. Fall in the prevalence of chronic gastritis over 15 years: analysis of outpatient series in Finland from 1977, 1985, and 1992. Gut. 1994;35(9):1167–1171.
- Rehnberg–Laiho L, Rautelin H, Koskela P, et al. Decreasing prevalence of helicobacter antibodies in Finland, with reference to the decreasing incidence of gastric cancer. Epidemiol Infect. 2001;126(1):37–42.
- Sonnenberg A. Epidemiology of Helicobacter pylori. Aliment Pharmacol Ther. 2022;55 Suppl 1(Suppl 1):S1–S13.
- Roosendaal R, Kuipers EJ, Buitenwerf J, et al. Helicobacter pylori and the birth cohort effect: evidence of a continuous decrease of infection rates in childhood. Am J Gastroenterol. 1997;92(9):1480–1482.
- Hooi JKY, Lai W, Ng WK, et al. Global prevalence of Helicobacter pylori infection: systematic review and meta–analysis. Gastrtoenterology. 2017;53:420–429.
- Sipponen P, Kekki M, Siurala M. The Sydney system: epidemiology and natural history of chronic gastritis. J Gastroenterol Hepatol. 1991;6(3):244–251.
- Sipponen P, Maaroos H–I. Chronic gastritis. Scand J Gastroenterol. 2015;50(6):657–667.
- Correa P. Chronic gastritis: a clinico–pathological classification. Am J Gastroenterol. 1988;83(5):504–509.
- Ihamäki T, Kekki M, Sipponen P, et al. The sequelae and course of chronic gastritis during a 30–to 34–year bioptic follow–up study. Scand J Gastroenterol. 1985;20(4):485–491.
- Dixon MF, Genta RM, Yardley JH, et al. Classification and grading of gastritis. The updated sydney system. International workshop on the histopathology of gastritis, Houston 1994. Am J Surg Pathol. 1996;20(10):1161–1181.
- Kuipers EJ, Uyterlinde AM, Peña AS, et al. Long-term sequelae of Helicobacter pylori gastritis. Lancet. 1995;345(8964):1525–1528.
- Villako K, Maards H, Tammur R, et al. Helicobacter (Campylobacter) pylori infestation and the development and progression of chronic gastritis: results of long–term follow–up examinations of a random sample. Endoscopy. 1990;22(3):114–117.
- Correa P. The epidemiology and pathogenesis of chronic gastritis: three etiologic entities. Front Gastrointest Res. 1980;6:98–108.
- Sipponen P, Kekki M, Haapakoski J, et al. Gastric cancer risk in chronic atrophic gastritis. Statistical calculations of cross-sectional data. Int J Cancer. 1985;35(2):173–177.
- Rugge M, de Boni M, Pennelli G, et al. Gastritis OLGA-staging and gastric cancer risk: a twelve-year clinico-pathological follow-up study. Aliment Pharmacol Ther. 2010;31:1104–1111.
- Sipponen P, Kosunen TU, Valle J, et al. Helicobacter pylori infection and chronic gastritis in gastric cancer. J Clin Pathol. 1992;45(4):319–323.
- Komoto K, Haruma K, Kamada T, et al. Helicobacter pylori infection and gastric neoplasia: correlations with histological gastritis and tumor histology. Am J Gastroenterol. 1998;93(8):1271–1276.
- Yusefi AR, Lankarani KB, Bastani P, et al. Risk factors for gastric cancer: a systematic review. Asian Pac J Cancer Prev. 2018;19:591–603.
- Karimi P, Islami F, Anandasabapathy S, et al. Gastric cancer: descriptive epidemiology, risk factors, screening, and prevention. Cancer Epidemiol Biomarkers Prev. 2014;23(5):700–713.
- Moayyedi P, Axon ATR, Feltbower R, et al. Relation of adult lifestyle and socioeconomic factors to the prevalence of Helicobacter pylori infection. Int J Epidemiol. 2002;31(3):624–631.
- Chapelle N, Manfredi S, Lepage C, et al. Trends in gastric cancer incidence: a period and birth cohort analysis in a well–defined French population. Gastric Cancer. 2016;19(2):682–682.
- Sonnenberg A. Differences in the birth-cohort patterns of gastric cancer and peptic ulcer. Gut. 2010;59(6):736–743.
- Wang C, Weber A, Graham DY. Age, period, and cohort effects on gastric cancer mortality. Dig Dis Sci. 2015;60(2):514–523.
- Lin Y, Lin S, Chen J, et al. Time trends and age-period-cohort effects on the incidence of gastric cancer in Changle from 2003 to 2012. Cancer Manag Res. 2019;11:8885–8892.
- Kuzmickiene I, Everatt R. Trends and age-period-cohort analysis of upper aerodigestive tract and stomach cancer mortality in Lithuania, 1987–2016. Public Health. 2021;196:62–68.
- Luo G, Zhang Y, Guo P, et al. Global patterns and trends in stomach cancer incidence: age, period and birth cohort analysis. Int J Cancer. 2017;141(7):1333–1344.
- Decarli A, La Vecchia C, Mezzanotte G, et al. Birth cohort, time, and age effects in Italian cancer mortality. Cancer. 1987;59(6):1221–1232.
- Aragonés N, Pollán M, Rodero I, et al. Gastric cancer in the European union (1968–1992): mortality trends and cohort effect. Ann Epidemiol. 1997;7(4):294–303.
- Okui T. An age-period-cohort analysis of mortality rates for stomach, colorectal, liver, and lung cancer among prefectures in Japan, 1999-2018. Environ Health Prev Med. 2020;25(1):80.
- Seoane–Mato D, Aragonés N, Ferreras E, et al. Trends in oral cavity, pharyngeal, oesophageal, and gastric cancer mortality rates in Spain, 1952–2006: an age–period–cohort analysis. BMC Cancer. 2014;254(14):1–11.