
Abstract
Background
Accompanied by the growing prevalence of nonalcoholic fatty liver disease (NAFLD), the coexistence of chronic hepatitis B (CHB) and NAFLD has increased. In the context of CHB, there is limited understanding of the factors that influence the development of NASH.
Methods
We enrolled CHB combined NAFLD patients who had liver biopsy and divided them to NASH vs. non-NASH groups. A whole transcriptome chip was used to examine the expression profiles of long noncoding RNAs (lncRNAs) and mRNA in biopsied liver tissues. The function analysis of HIGD1A were performed. We knocked down or overexpressed HIGD1A in HepG2.2.15 cells by transient transfection of siRNA-HIGD1A or pcDNA-HIGD1A. In vivo investigations were conducted using hepatitis B virus (HBV) transgenic mice.
Results
In 65 patients with CHB and NAFLD, 28 were patients with NASH, and 37 were those without NASH. After screening 582 differentially expressed mRNAs, GO analysis revealed differentially expressed mRNAs acting on nicotinamide adenine dinucleotide phosphate (NADPH), which influenced redox enzyme activity. KEGG analysis also shown that they were involved in the NAFLD signaling pathway. The function analysis revealed that HIGD1A was associated with the mitochondrion. Then, both in vivo and in vitro CHB model, HIGD1A was significantly higher in the NASH group than in the non-NASH group. HIGD1A knockdown impaired mitochondrial transmembrane potential and induced cell apoptosis in HepG2.2.15 cells added oleic acid and palmitate. On the contrary, hepatic HIGD1A overexpression ameliorated free fatty acids-induced apoptosis and oxidative stress. Furthermore, HIGD1A reduced reactive oxygen species (ROS) level by increasing glutathione (GSH) expression, but Adenosine 5’-monophosphate (AMP)-activated protein kinase (AMPK)/Acetyl-CoA carboxylase (ACC) pathway was not involved.
Conclusion
Both in vivo and in vitro CHB model, an upward trend of HIGD1A was observed in the NASH-related inflammatory response. HIGDIA played a protective role in cells against oxidative stress. Our data suggested that HIGD1A may be a positive regulator of NASH within the CHB context.
Introduction
Nonalcoholic fatty liver disease (NAFLD) is a chronic liver disease with metabolic stress, which has wide range of alterations, including nonalcoholic fatty liver (NAFL), nonalcoholic steatohepatitis (NASH), varying degree of fibrosis and even cirrhosis [Citation1]. NASH, characterized by hepatic steatosis, inflammation and liver damage, is an extremely important pathological stage. Blocking the progression of NASH can effectively control the progression of NAFLD to liver cirrhosis and hepatocellular carcinoma [Citation2,Citation3]. With the obesity epidemic, NAFLD has become one of most popular chronic liver disorders in China, and 18%-27% of chronic hepatitis B (CHB) occur in combination with NAFLD [Citation4–6]. NASH was found to be independent risk factor potentiating significant fibrosis and severe fibrosis in CHB patients [Citation7]. Furthermore, patients with CHB and NASH had worse liver-related outcomes and overall mortality than those with CHB alone [Citation8]. In evaluating NAFLD in CHB patients, it is critical to investigate variables that affect NASH development because it has therapy implications for the course of chronic liver disease.
The liver is the main site of lipid metabolism. Free fatty adds are central to the pathogenesis of NASH. The increase in fatty acids leads to dysfunction of mitochondria and peroxisomes, and the increase in oxidative stress produces toxic lipid metabolites [Citation9]. Toxic lipid metabolites can lead to oxidant stress, endoplasmic reticulum stress and inflammasome activation. These processes are responsible for hepatocellular injury, inflammation, stellate cell activation in NASH. It is well known that hepatitis C virus (HCV) infection affects changes in lipid metabolism, leading to hepatic steatosis and more severe inflammation in patients with chronic hepatitis C (CHC) [Citation10]. Unlike CHC, research on CHB and NASH is scarce and presents conflicting findings [Citation11,Citation12].
The primary aim of this study was to utilize microarray analysis to obtain long noncoding RNAs (lncRNAs) and mRNAs expression profiles in patients with CHB combined with NAFLD and elevated ALT. The patients were divided into a NASH group and a non-NASH group. We hypothesized that the expression of mRNA, namely, hypoxia-induced gene domain protein-1a (HIGD1A), may exhibit variations in the NASH-related inflammation compared to those CHB patients without NASH. Additionally, the present study aimed to investigate the involvement of HIGD1A in the progression of NASH within the CHB context.
Materials and methods
Study population
A cohort study was performed that included patients with histologically proven CHB combined NAFLD in the Fifth Hospital of Shijiazhuang. The diagnostic criteria for CHB and NAFLD are based on the Guidelines for The Prevention and Treatment of Chronic Hepatitis B (2019 edition) [Citation13] and the National Institutes of Health (NIH) NASH Clinical Research Network Guidelines for Pathologic Work [Citation14], respectively. The inclusion criteria were as follows: (1) HBsAg-positive for at least 6 months; (2) treatment-naïve; (3) ALT > 1 × ULN (the upper limit of normal ALT was 40 U/L). The exclusion criteria were as follows: (1) alcoholic fatty liver disease (alcohol intake exceeding 40 g/d in males and 20 g/d in females, over the past 5 years); (2) used medication associated with steatosis; (3) age younger than 12 years old; (4) con-infected with other types of hepatitis virus or HIV; (5) drug-induced liver injury; (6) autoimmune hepatitis; (7) Wilson’s disease; (8) decompensated liver cirrhosis and (9) liver carcinoma or biliary tract malignant tumor.
All patients’ medical charts were reviewed. Laboratory test results were retrieved from the patients’ medical records within 30 days before or after the date of liver biopsy, which were performed in the clinical central laboratory of the hospital using commercially available assays. Imaging examination were measured 1∼7 days before liver biopsy. A liver biopsy was performed using a 16 G Menghini needle under the ultrasound localization for histopathological assessment and from which RNA was extracted.
Liver histological examination and patient classification
Liver histology was assessed by a single board-certified pathologist who was blinded to the study data. The biopsy samples (patient) and liver tissues (animal) were fixed in formalin, embedded in paraffin, and stained with hematoxylin-eosin, reticular fiber and Oil Red O. HBV-infection-related damage in the liver biopsy specimens was scored according to the Scheuer classification [Citation15]. Significant inflammation/fibrosis was defined as greater than or equal to 2. Steatosis, lobular inflammation and hepatocyte ballooning were scored using the NASH Clinical Research Network (NASH CRN) scoring system, which was so-called the NAFLD activity score (NAS) [Citation14].
Based on the pathological characteristics of liver inflammation caused by NASH or not, we divided the patients of CHB combined with NAFLD into the following two groups: NASH group and non-NASH group, see Supplementary Figure 1C and 1D.
Microarray assay and interpretation of the results analysis
Paraffin-embedded liver tissues were obtained from the two groups described above. Total RNA was isolated from the paraffin-embedded liver tissues using a RecoverAllTM Total Nucleic Acid Isolation kit (Cat. #AM1975, Ambion, Austin, TX, US) according to the manufacturer’s instructions and checked for total quantity with an Agilent Bioanalyzer 4200 (Agilent Technologies, Santa Clara, CA, US). 50 ng of total RNA from each group were then used to generate biotinylated cDNA targets for a GeneChip® Human Transcriptome Array 2.0. Biotinylated cDNA targets then hybridized with the microarray. The cRNA should be used as the input to prepare 20 µg cRNA in 2ndcycle cDNA synthesis reaction. After hybridization, the arrays were stained in a Fluidics Station 450 and scanned on an Affymetrix Scanner 3000. The microarray experiments were performed according to the protocol from Affymetrix Inc. by Shanghai Biochip Corporation. The raw data were normarlized by SST-RMA algorithm using TAC4.0, and the AUC of samples should be more than 0.5 for data quality control.
Based on the criteria of p < 0.05 and |logFC|>0.5, NASH-specific long noncoding RNAs (lncRNAs) and mRNAs were selected using the Limma package in R (4.1.3). Then, the clusterProfiler package was used for gene ontology (GO) [Citation16] analysis and Kyoto Encyclopedia of Genes and Genomes (KEGG) [Citation17] analysis, and p < 0.001 and p < 0.01, respectively, were used as the standards to output the results.
MicroRNA data targeted by differentially expressed lncRNAs were downloaded from the microRNAcode database. MicroRNADB, TargetScan and microRNA TarBase were used to predict the mRNAs targeted by the above microRNAs, and then the target mRNAs were obtained by the intersection with the differentially expressed mRNAs. Finally, the intersection of differentially expressed lncRNAs, microRNAs and mRNAs were retained. Cytoscape (3.8.0) was used to construct a competitive endogenous RNA (ceRNA) network of lncRNA-microRNA-mRNA interactions.
Function analysis and immune cell infiltration analysis of HIGD1A
We used Metascape to perform a functional enrichent analysis [Citation18]. There was closed relation between the infiltration of immune cells and clinical outcomes. The CIBERSORT estimated cellular composition of complex tissues based on standardized gene expression data, which quantified the abundance of specific cell types, following by analyze of the correlation between characteristic genes and immune cells [Citation19].
Animals and tissue preparation
Male HBV transgenic mice BALB/c-TgN (HBV D type 1.3) were purchased from the 458 Hospital of the Chinese People’s Liberation Army and carefully housed under specific-pathogen-free (SPF) conditions. All animal-related experimental procedures followed the guidelines of the Ethical Committee of Jinan university. Mice were randomly assigned to non-dietary restriction or dietary restriction for 20 weeks. After being fed separately, the mice were sacrificed for analysis. Just before sacrifice, blood was then collected from the retro-orbital sinus after eyeball removal, and the serum was separated and stored at −80 °C. Liver tissues were rapidly harvested and fixed in 4% paraformaldehyde in phosphate-buffered saline (PBS) or snap-frozen in liquid nitrogen and stored at −80 °C for later assessment.
Cells and transfections
HepG2.2.15 cells were purchased from the Cell Bank of GuangZhou Jennio Biotech Co.,Ltd (Guangzhou, China). These cells were cultured at 37° C in DMEM with 10% fetal bovine serum (Gibco, Invitrogen, USA), in a humidified incubator containing 5% CO2 environment.siRNA HIGD1A (umol/L) and pcDNA HIGD1A(ug/uL) were designed and synthesized by hippobio Co. (Huzhou, China) and Jennio Biotech Co., Ltd (Guangzhou China) respectively. Cell transfection was performed using Lipofectamine 2000 (Invitrogen, USA) according to the supplier’s instructions. The sequence are provided in Supplementary Table 1.
Preparation of free fatty acids(FFAs)
Briefly, sodium oleic acid (OA) and sodium palmitate (Sigma, St. Louis, MO, USA) were dissolved separately in distilled water. Mixed vigorously with fatty acid-free BSA solution (XinFan Bio-tech, China) in phosphate-buffered saline (PBS) at a molar ratio of 2:1.
Oil Red O staining
HepG2.2.15 cells were washed three times with iced PBS and fixed with 4% paraformaldehyde for 30 min. After fixation, cells were washed three times and stained with Oil Red O solution (Servicebio, Wuhan, China) for 15 min at room temperature. Cells were then washed with PBS three times to remove redundant staining and observed under a microscope.
Cell proliferation Assay
HepG2.2.15 cells were seeded into 96-well plates at a density of 2.5 × 10³ cells per well. After FFA and siRNA/pcDNA treatment, cell viability was determined using the methylthiazolyldiphenyl-tetrazolium bromide (MTT) reagent (5 mg/ml) according to the manufacturer’s protocol. Finally, absorbance was measured at 490 nm by means of a microplate reader (Thermo, USA) for cell density quantification.
Cell apoptosis Assay
Cell apoptosis was assessed after FFA and siRNA/pcDNA treatment. 1.0 × 10⁵ Cells were resuspended in 195 μl of binding buffer, stained with Annexin V-FITC (5 μl) and propidium iodide (10 μl) in the dark for 15 min, and then analyzed using flow cytometry.
Biochemical analysis
The levels of ALT, aspartate aminotransferase (AST), total Cholesterol (TC) and triglyceride (TG) in animal serum, cell lysate or cell culture supernatant, as well as malonic dialdehyde (MDA), glutathione (GSH) and glutathione peroxidase (GSH-Px) in liver homogenate were determined by standard laboratory detection kits according to the manufacturer’s instructions (Nanjing Jiancheng Bioengineering Institute, Nanjing, China).
qRT-PCR
TRIzol reagent (MRC,USA) was used for total RNA extraction from cells/liver tissues according to the manufacturer’s instructions. Reverse transcription was performed using a reverse transcription kit (Promega, USA). Quantitative real-time reverse transcription PCR (qRT-PCR) was carried out using the GoTaq® qPCR Master Mix (Promega, USA). Targets were normalized to β-catin. All qRT-PCR reactions were performed in triplicate. The qRT-PCR primers are provided in Supplementary Table 2.
Western blotting and antibodies
The protein lysates were prepared from animal liver or HepG2.2.15 cells using Pro-Prep Protein Extraction Solution (Servicebio, Wuhan, China) according to the manufacturer’s instructions. Total cell proteins were separated by 10% SDS-polyacrylamide gels and then transferred to PVDF membranes (Servicebio, Wuhan, China). After transfer, the membranes were blocked in non-fat skim milk, followed by incubation with specific primary antibodies overnight at 4 °C. After overnight incubation, membranes were probed with the appropriate secondary antibody. The protein bands were detected using Alpha Innotech imaging system (ProteinSimple, USA). All experiments were repeated three times, and the representative bands are indicated in the figures.
Measurement of mitochondrial transmembrane potential
To detect the impact of HIGD1A on the mitochondrial membrane potential(MMP), HepG2.2.15 cells were co-culture with FFA and siRNA/pcDNA. And then cells were incubated with JC-1 working fluid (Beyotime, China) at 37° C for 20 min. After incubation, the supernatant was removed, and cells were washed twice with JC-1 staining buffer. Fluorescence was then detected using a fluorescence microscope (Olympus BX53M, Japan).
Determination of reactive oxygen species(ROS)
The level of intracellular ROS was detected by DCFH-DA method. After treatment of FFAs and siRNA/pcDNA, 10 μM DCFH-DA (2′,7′-dichlorodihydrofluorescein diacetate, Beyotime, China) was added to the cells and incubated at 37 °C for 30 min. Following the incubation period, the cells were washed with PBS three times, and analyzed using flow cytometry.
To measure the ROS levels of animal livers, the mice liver tissues was homogenized in PBS for 15 min at 4 °C. Liver tissue homogenate was incubated with 10 µM DCFH-DA at 37 °C for 20 min. Then the homogenate was centrifugated at the speed of 1500 rpm for 5 min. The centrifugate was washed with serum-free cell culture medium three times and the fluorescence were measured as described above.
Immunohistochemistry and image analysis
Four-micrometer-thick histology sections were cut, and immunohistochemical staining was performed. In brief, the liver sections were dried at 60 °C for 1 h and deparaffinized in three baths of xylene and two baths of 100% ethanol, followed by a gradient of 95% and 70% alcohol for 5 min each. Then, the slides were placed in a microwave with AR buffer, brought to the boiling point, and washed with distilled H2O2 and TBST. After blocking with 1% Blocker BSA for 15 min at room temperature, the slides were incubated overnight with primary antibodies. Next, both the sections and the corresponding HRP-conjugated secondary antibodies were incubated with for 10 min at room temperature. Lastly, the sections were stained with DAPI and sealed. Immunohistochemical scoring of the primary antibodies was analyzed using HALO software with the Highplex FL v 4.0.4 algorithm, which involves assessing both the intensity of staining (graded as nonstaining-0, weak-1, median-2 or strong-3) and the percentage of positive cells. Detailed information about the antibodies is provided in Supplementary Table 3.
Statistical analyses
Categorical variables are expressed as counts and percentages, and they were analyzed using the χ2 or Fisher’s exact test. Continuous variables are presented as the mean and standard deviation (±SD). Student’s t test or one-way ANOVA were used for statistical comparisons where appropriate. Multinomial (binary) logistic regression was applied to evaluate factors associated with NASH. Two-sided P values <0.05 were considered statistically significant. Statistical analyses were performed using SPSS 20.0 software (SPSS, Chicago, IL, USA).
Results
Clinical features in CHB patients with versus without NASH
We divided 65 patients with CHB combined with NAFLD into 2 groups: 28 in the NASH group and 37 in the non-NASH group. We found that age and glucose (Glu), TG, hyaluronic acid (HA) and fat attenuation parameter (FAP) levels differed significantly between two groups. Patients in the NASH group were older and had significantly higher Glu, TG, HA and FAP levels than non-NASH patients (Supplementary table 4). Subsequent multiple logistic regression analysis identified that TG levels (OR = 13.48, 95% CI: 1.73–104.83, Wald = 6.18, p = 0.01), HA levels (OR = 22.78, 95% CI: 2.36–220.37, Wald = 7.29, p = 0.01), and FAP levels (OR = 10.15, 95% CI: 1.37–75.49, Wald = 5.12, p = 0.02) were associated with NASH. The AUC of TG associated with the diagnosis of NASH was 0.64 (95% CI 0.45 to 0.82), which was similar to HA (0.63, 95% CI 0.44 to 0.82) and FAP (0.70, 95% CI 0.54 to 0.87).
Comprehensive mRNA profiling in liver tissue samples from NASH and non-NASH participants
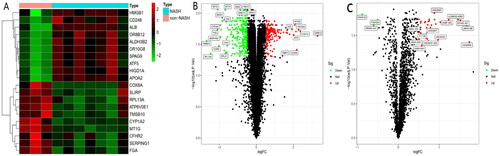
We randomly selected 10 cases of liver penetrating specimens for Microarray experiments, which involved 7 samples in the NASH group and 3 samples in the non-NASH group. Microarray experiments were used to analyze the lncRNA and mRNA expression profiles in liver biopsy tissues. Differential expression analysis was performed on the chip data, and a total of 32 differentially expressed lncRNA and 582 differentially expressed mRNA were screened. 118 mRNAs were significantly upregulated in the NASH group and 464 mRNAs were significantly upregulated in the non-NASH (HBV-inflammation) group (). GO analysis predicted that differentially expressed mRNA could act on monooxygenase activity, endopeptidase regulator activity, peptidase regulator activity, oxidoreductase activity with incorporation or reduction of molecular oxygen, MHC class II protein complex binding and NAD(P)H and affect the REDOX enzyme activity (Supplementary Figure 2). KEGG analysis predicted that differentially expressed mRNAs could participate in complement and coagulation cascades, metabolism of xenobiotics by cytochrome P450, Oxidative phosphorylation, cholesterol metabolism and the NAFLD signaling pathway (Supplementary Figure 3).
Figure 1. A. Heatmap of differentially expressed genes. The top ten up-regulated and down-regulated genes are shown in red and green, respectively. B and C. Volcano map analysis of differentially expressed mRNA (B) and lncRNA (C) respectively: red indicates that the gene is highly expressed in the sample, and green is low in the sample.
Bioinformatics analysis found that LINC00207, microRNA-761 and HIGD1A were mutually ceRNAs
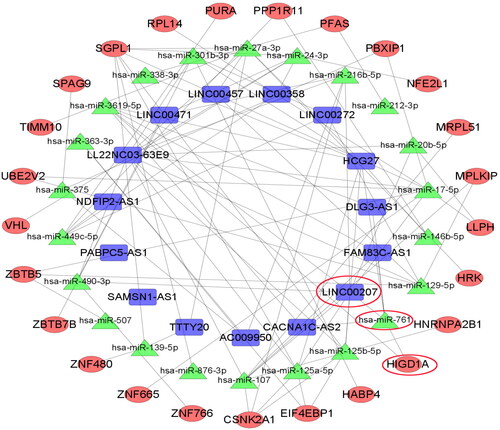
Target gene prediction and ceRNA network analysis were successively performed on differentially expressed genes. In total, 22 microRNA nodes, 25 mRNA nodes, 15 lncRNA nodes, and 413 edges were identified as differentially expressed profiles. Combined with literature search and verification of the first 6 mRNAs in the differential expression of upregulation in GSE130970, we searched for key genes among them, and finally selected the mRNA hypoxia-induced gene domain protein 1 A (HIGD1A) as our research object. HIGD1A was significantly upregulated in NASH microarray dataset and had a ceRNA relationship with LINC00207. ceRNA regulatory network analysis found that the regulatory pathway of LINC00207 and HIGD1A is LINC00207- microRNA-761-HIGD1A ().
Figure 2. ceRNA network diagram of LINC00207-microRNA-761-HIGD1A. The connection of any two genes in the network represents the interaction between the two, where blue represents LncRNA, green represents microRNA and red represents mRNA.
Functional positioning of HIGD1A
Functional enrichment analysis was conducted via Metascape and the results showed that mitochondrial respirasome assembly, mitochondrion organization, cellular protein-containing complex assembly, generation of precursor metabo, cellular responses to stimuli were significantly related with HIGD1A. And the subcellular location of HIGD1A was mitochondria, followed by nuclear cytoplasm (Supplementary Table 5). Correlation analysis of HIGD1A with immune cells showed that the expression level of HIGD1A gene was negatively correlated with M0-like macrophages (R=-0.7, p = 0.024) (Supplementary Figure 4).
HIGD1A expression is increased in vivo and vitro model of CHB combined with NASH
HpeG2.2.15 cells were treated with OA and palmitate at different concentrations for different times. HIGD1A expression was significantly increased with with 0.8 mM OA and 0.4 mM palmitate for 96 h in HepG2.2.15 cells (). Oil Red staining revealed lipid droplets in HepG2.2.15 FFA group (Supplementary Figure 5).
Figure 3. HIGD1A expression is elevated under high-fat exposure. qRT-PCR (A) revealed that HIGD1A expression was not increased when HepG2.2.15 cells were exposure to different concentration of OA and palmitate, however, western blot (B) revealed that HIGD1A expression was increased significantly upon exposure to 0.8 mM OA and 0.4 mM palmitate for 96 h in HepG2.2.15 cells. Meanwhile, qRT-PCR (C) and western blot (D) also shown that HIGD1A expression in liver tissue was higher significantly in NASH group than non-NASH group of mice (# p < 0.05 compared with non-NASH group).
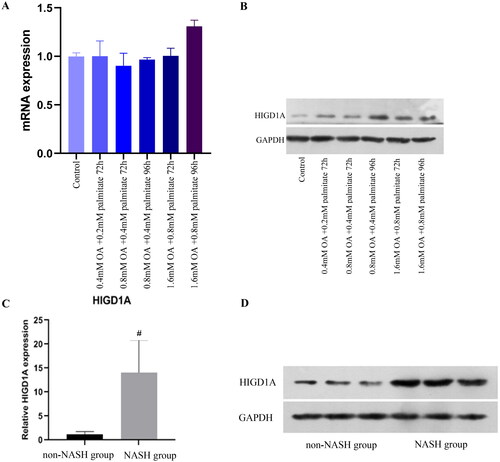
Following the non-dietary restriction for 20 weeks, the mice developed a nutritional steatohepatitis diffusely, exhibiting hepatic moderate and severe macrovesicular steatosis (F2-3), and inflammatory cell infiltration, which is histological similarities to human NASH (Supplementary Figure 1A and 1B). Furthermore, the massive fat droplets were observed in the liver section stained by Oil Red O (Supplementary Figure 5). Intriguingly, qRT-PCR and WB showed the hepatic HIGD1A expressions were dramatically increased in NASH mice compared to the control mice ().
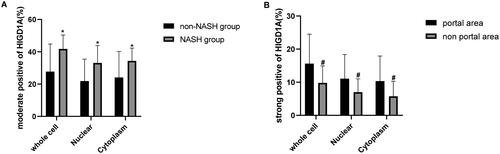
Moreover, most HIGD1A was found in the patient liver cell cytoplasm and nucleus. The moderately positive rate of HIGD1A staining in the NASH group was significantly higher than that in the non-NASH group (). Furthermore, the liver tissue was divided into three zones: zone 1 was close to the portal area, zone 3 was around the central venule, and zone 2 was situated between zones 1 and 3. The strongly positive rate of HIGD1A staining in the portal area (zone 1) was significantly higher than that in the nonportal area (zone 1 + zone 3) (). These results indicated that the expression of HIGD1A could be increased in NASH-related inflammatory response among CHB.
Figure 4. Quantification of HIGD1A staining in liver tissue of patients. (∗p < 0.05 compared with non-NASH group,# p < 0.05 compared with portal area group).
HIGD1A protects hepatic cells under high-fat exposure
HepG2.2.15 cells were treated with FFAs (0.8 mM OA + 0.4 mM palmitate), after 48 h, then transfected with pcDNA NC/pcDNA HIGD1A (4ug/ml) for 48 h, or after 72 h, transfected with siRNA NC/siRNA HIGD1A(100 nmol/L) for 24 h. HIGD1A overexpression or downregulation was confirmed by western blot (Supplementary Figure 6).
HepG2.2.15 cells were treated with FFAs (0.8 mM OA + 0.4 mM palmitate), after 48 h, then transfected with pcDNA NC/pcDNA HIGD1A (4ug/ml), and after 72 h, transfected with siRNA NC(100 nmol/L). HIGD1A overexpression was confirmed by western blot (). Cell proliferation rates in FFA + pcDNA HIGD1A + siRNA-NC group were significantly higher than FFA + pcDNA NC + siRNA NC group in HepG2.2.15 cells (63.28% versus 59.12%,p < 0.001). On the other hand, apoptosis rate in FFA + pcDNA HIGD1A + siRNA NC group were significantly lower than FFA + pcDNA NC + siRNA-NC group in HepG2.2.15 cells (10.00% versus 16.42%,p = 0.005) (). Oil Red staining showed marked accumulation of lipid droplets in HepG2.2.15 cells after FFA treated, and these were attenuated by HIGD1A upregulated (Supplementary Figure 5). The levels of ALT, AST, TC and TG were also lower in the FFA + pcDNA HIGD1A + siRNA-NC group than in the FFA + pcDNA NC + siRNA NC group (Supplementary Table 6). Moreover, upregulating HIGD1A can protected MMP in FFA + pcDNA HIGD1A + siRNA NC groups ().
Figure 5. Overexpression of HIGD1A protects cells from apoptosis under high-fat exposure and vice versa. cells in the FFA + pcDNA HIGD1A + siRNA NC group exhibited increased HIGD1A expression compared with those in the FFA + pcDNA NC + siRNA NC group and cells in the FFA + pcDNA NC + siRNA HIGD1A group exhibited decreased HIGD1Aexpression compared with those in the FFA + pcDNA NC + siRNA NC group in HepG2.2.15 cells (a). cell proliferation in each group was measured by the MTT kit in HepG2.2.15 cells (B), and cell apoptosis in each group was measured by flow cytometry using Annexin V-FITC staining in HepG2.2.15 (C) (∗p < 0.05 compared with the FFA + pcDNA NC + siRNA NC group).
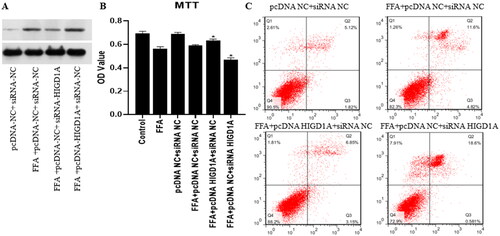
Figure 6. Overexpression of HIGD1A protects mitochondrial transmembrane potential under high-fat exposure and vice versa. The impairment of MMP was less severe in the FFA + pcDNA HIGD1A + siRNA NC group compared with the FFA + pcDNA NC + siRNA NC group, and the impairment of MMP was more severe in the FFA + pcDNA NC + siRNA HIGD1A group compared with the FFA + pcDNA NC + siRNA NC group in HepG2.2.15 cells.
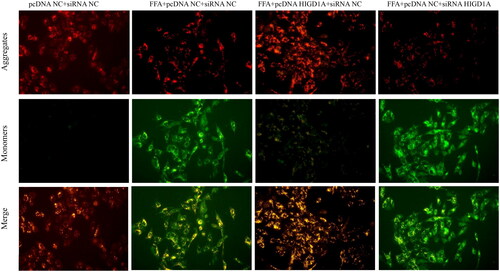
HepG2.2.15 cells were treated with FFAs (0.8 mM OA + 0.4 mM palmitate), after 48 h, and then transfected with pcDNA NC (4ug/ml), and after 72 h, transfected with siRNA NC/siRNA HIGD1A (100 nmol/L). HIGD1A knockdown was validated by western blot (). Whereas downregulating HIGD1A exerted opposite effects. Cell proliferation was inhibited in the FFA + pcDNA NC + siRNA HIGD1A group(46.92% versus 59.12%, p < 0.001), and more apoptosis was induced in the FFA + pcDNA NC + siRNA HIGD1A group compared with the FFA + pcDNA NC + siRNA NC group (19.18% versus16.42%, p < 0.05) (). Oil Red staining showed lipid droplets were significantly increased in FFA + pcDNA NC + siRNA HIGD1A group than FFA + pcDNA NC + siRNA NC group (Supplementary Figure 5). The levels of AST, TC and TG were also higher in the FFA + pcDNA NC + siRNA HIGD1A group than the FFA + pcDNA NC + siRNA NC group (Supplementary Table 6). And downregulating HIGD1A destroyed MMP in FFA + pcDNA NC + siRNA HIGD1A groups ().
Effect of HIGD1A induction on hepatic ROS in vivo and vitro
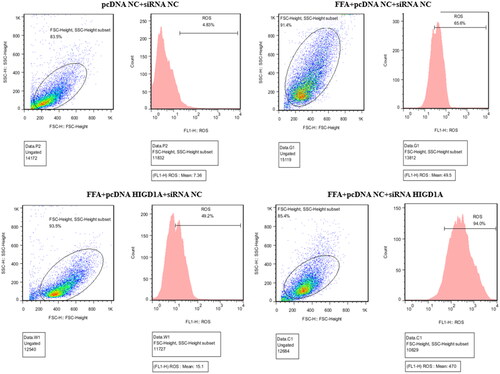
Hepatic mitochondrial ROS exerts a pivotal role in the development of NASH. HIGD1A is localized to the mitochondrial inner membrane. In extreme environments, such as hypoxia and nutrient deprivation, HIGD1A is induced and interacts with the mitochondrial electron transport chain to repress oxygen consumption. we then investigated the effect of HIGD1A induce on ROS expression under high-fat exposure. Flow cytometry using DCFH-DA staining revealed elevated intracellular ROS in the FFA + siRNA NC + pcDNA NC group than control group in HepG2.2.15 cells. We then added pcDNA HIGD1A or siRNA HIGD1A to the FFA group and assessed ROS expression. Overexpression of HIGD1A in the cells could significantly down-regulated hepatic ROS levels. Whereas, the level of ROS was notably up-regulated after silence HIGD1A by siRNA HIGD1A (). On the other hand, the hepatic level of ROS was up-regulated in mice with CHB and NASH compared with that of the control mice (Supplementary Figure 7).
Figure 7. Overexpression of HIGD1A alleviates hepatic ROS under high-fat exposure and vice versa. The intracellular ROS was significantly elevated in FFA groups than control group (pcDNA NC + siRNA NC group). The intracellular ROS of FFA + pcDNA HIGD1A + siRNA NC group was lower compared with the FFA + pcDNA NC + siRNA NC group, and the intracellular ROS of FFA + pcDNA NC + siRNA HIGD1A group was higher compared with the FFA + pcDNA NC + siRNA NC group in HepG2.2.15 cells.
HIGD1A reduce hepatic ROS not by upregulating AMPK/ACC activity under high-fat exposure
Adenosine 5′-monophosphate (AMP)-activated protein kinase (AMPK) is considered to be a classical phosphorylation upstream kinase of Acetyl-CoA carboxylase (ACC) in mammals. AMPK inhibited ACC1 and ACC2 activity by phosphorylating ACC1 Ser79 and ACC2 Ser212 in rats [Citation20–22], which can inhibit fatty acid synthesis and reduce ROS production. We then investigated whether HIGD1A played a role in AMPK/ACC mediated ROS down-regulation. p-AMPK and p-ACC expression were decreased in the FFA + siRNA NC + pcDNA NC group (Supplementary Figure 8). Similar to cells results, p-AMPK and p-ACC expression were reduced in the NASH group compared with control group in mice (Supplementary Figure 8), and the NASH group also shown higher MDA and lower GSH and GSH-Px compared with control group (Supplementary Figure 7). Then, cells were transfected with siRNA HIGD1A/pcDNA HIGD1A and also treated with FFAs. p-AMPK and p-ACC expression in the FFA + siRNA HIGD1A + pcDNA NC group was higher compared with that in the FFA + siRNA NC + pcDNA HIGD1A group (Supplementary Figure 8). However, cells transfected with siRNA HIGD1A exhibited reduced GSH expression compared with cells transfected with pcDNA HIGD1A (Supplementary Figure 9). These results suggest that HIGD1A reduce ROS expression partially through upregulating GSH, not via the AMPK/ACC pathway.
Discussion
Elevated ALT in CHB combination with NAFLD often post a challenge in clinical management. While the unique clinical profiles of these patients were associated with the NASH-related inflammation,such as significantly higher TG, HA and FAP levels in CHB patients with NASH compared to those without NASH, none of these three indicators effectively predicted NASH-related inflammation in this subgroup, as evidence by their AUC values ranging from 0.63 to 0.70. To our knowledge, the current study is the first one to provide data using a microarray method to analyze the differences in expression profiles of lncRNAs and mRNAs in liver biospy tissues between CHB patients with NASH and those without NASH.
By screening 582 differentially expressed mRNAs, we found that GO analysis predicted that these mRNA could act on NAD(P)H and affect redox enzyme activity. Furthermore, KEGG analysis suggested their potential involvement in the NAFLD signaling pathway, implying that these differentially expressed genes may play a role in the initiation and progression of NASH by virtue of their impact on oxidative stress. Then, target gene prediction and ceRNA network analysis showed that LINC00207 and HIGD1A were significantly upregulated in the NASH group and that LINC00207 may regulate HIGD1A via microRNA-761. In other words, the regulatory pathway between LINC00207 and HIGD1A was a LINC00207-microRNA-761-HIGD1A axis.
The human HIGD1A gene is located on chromosomal 3p22.1. It possesses two transmembrane domains and exhibits an orientation characterized as ‘external membrane N-terminus-membrane inner ring-external membrane C-terminus’. During episodes of metabolic stress, such as hypoxia or glucose starvation, the expression level of HIGD1A is upregulated by hypoxia inducible factor 1 A (HIF-1a), and the expression of HIGD1A is also increased due to the decrease in DNA methyltransferase levels caused by hypoxia [Citation23,Citation24]. Li T et al. reported that HIGD1A could protect NASH cells from oxidative stress under exposure to high fat [Citation24]. The present study provides insight into the differential mRNA expression between liver tissues of CHB patients with and without NASH. Moreover, we observed an upregulation of HIGD1A in the NASH-related inflammatory response in CHB combined with NAFLD in vitro and in vivo, suggesting its potential role in protecting cells from oxidative stress by higher GSH and lower cellular ROS levels.
Previous study has shown that hepatitis B x protein can increase oxidative stress level by disrupting mitochondrial function during HBV infection [Citation25]. However, oxidative stress does not constitute the primary mechanisms underlying HBV-induced hepatocellular inflammation. Oxidative stress and lipid peroxidation play pivotal roles in the onset and progression of NASH. This is attributed to the presence of lipid peroxidation products, which are related to various histological characteristics of NASH. Multiple studies have shown that these lipid peroxidation products can inhibit co-oxidase, activate uncoupling protein 2, destroy the mitochondrial membrane, and impair the normal function of the electron respiratory chain [Citation26]. When cells were exposed to high level of FFA, cell apoptosis was accelerated, MMP was impaired, and hepatic ROS level was elevated. Moreover, the levels of MDA in animals with CHB combined with NASH were also higher than in the control group. Our study revealed a correlation between HIGD1A and mitochondrial respirasome assembly through functional enrichment analysis conducted via Metascape. Additionally, the overexpression of HIGD1A in hepatocytes resulted in an enhancement of mitochondrial function and a reduction in apoptosis. Previous studies have also shown that upregulated HIGD1A interacts with mitochondrial electron transport respiratory chain complex III to enhance the activity of AMP-dependent protein kinase (AMPK), consequently reducing ROS levels to improve cell damage during glucose starvation [Citation27,Citation28]. In partial concordance with these findings, we found that HIGD1A modulates oxygen consumption and ROS production, promoting cell survival under high-fat exposure in both in vitro and in vivo, but not via the pathway of AMPK.
The activation of AMPK results in the phosphorylation of acetyl-CoA carboxylase (ACC), which, in turn, inhibit ACC from maintaining the homeostasis of reduced nicotinamide adenine dinucleotide phosphate (NADPH) in A549 cells under glucose starvation [Citation29]. When ACC was inhibited, the synthesis of fatty acids decreased, and the oxidation of fatty acids increased. Oxidative fatty acid metabolites participate in the tricarboxylic acid cycle to produce malic acid and isocitrate, which produce NADPH under the action of malate and isocitrate dehydrogenase, respectively. NADPH is essential for the regeneration of reduced glutathione (GSH). The GSH/NADPH is used by glutathione peroxidase to downregulate ROS levels and reduce apoptosis and inflammatory necrosis. The current study investigated several proteins within this pathway in both cells and liver of mice subjected to high-fat exposure. Our results showed that the levels of p-AMPK/p-ACC and GSH decreased in hepatics cells under high-fat exposure in both in vivo and in vitro setting. As expected, HIGD1A significantly increased the expression of GSH. However, in HIGD1A increased group in vitro, the level of p-AMPK/p-ACC were lower than those in the control group. Unlike in case of glucose starvation, the modulation of oxidative stress by HIGD1A in the liver under high-fat exposure might be mediated through other pathways for the activation of GSH. A recent study identified that overexpression of HIGD1A in hepatocytes may increase fatty acid oxidation genes to alleviated hepatosteatosis [Citation30].
In summary, our findings indicate an endogenous protective mechanism characterized by the upregulation of HIGD1A in the setting of the NASH-related inflammatory response in CHB combined with NAFLD. HIGD1A can reduce ROS levels and alleviate hepatocyte injury caused by oxidative stress, thus signifying its potential role as a significant upstream element within this signaling cascade.
Ethical approval
This study was carried out in accordance with the rules of the Declaration of Helsinki of 1975, revised in 2013. The studies involving human participants were reviewed and approved by the Medical Ethics Committee of The Fifth Hospital of Shijiazhuang (approval number: LL2016003). The patients provided their written informed consent to participate in this study.
Authors’contributions
Min-ran Li and Jin-zhong Li searched the literature and conceived of the study, Min-ran Li and Er-hei Dai designed the study, and Min-ran Li and Jin-zhong Li interpreted the results and drafted the report. Li-hong Ye, Hai-cong Hai and Zhi-quan Liu made pathological diagnoses of liver tissue. Xue-dong Zhang performed laboratory test. De-hua Wang, Jun-qing Li and Yun-yan Liu collected the data. Tao-yuan Li and Xu-jing Liang analyzed the data. Calvin Pan revised the manuscript and addressed the reviewers’ comments.
Supplemental Material
Download Zip (15.4 MB)Disclosure statement
No potential conflict of interest was reported by the author(s).
We declare that we do not have any commercial or associative interest that represents a conflict of interest in connection with the work submitted
Data availability statement
All data generated or analysed during this study are included in this article. Further enquiries can be directed to the corresponding author.
Additional information
Funding
References
- Rinella ME. Nonalcoholic fatty liver disease: a systemic review. JAMA. 2015;313(22):2263–2273. doi: 10.1001/jama.2015.5370.
- Wong VW, Chitturi S, Wong GL, et al. Pathogenesis and novel treatment options for non-alcoholic steatohepatitis. Lancet Gastroenterol Hepatol. 2016;1(1):56–67. doi: 10.1016/S2468-1253(16)30011-5.
- Cook N, Geier A, Schmid A, et al. The patient perspectives on future therapeutic options in NASH and patient needs. Front Med . 2019;6:61. doi: 10.3389/fmed.2019.00061.
- Diehl AM, Day C. Cause, pathogenesis, and treatment of nonalcoholic steatohepatitis. N Engl J Med. 2017;377(21):2063–2072. doi: 10.1056/NEJMra1503519.
- Fan JG, Kim SU, Wong VW. New trends on obesity and NAFLD in Asia. J Hepatol. 2017;67(4):862–873. doi: 10.1016/j.jhep.2017.06.003.
- Wang FS, Fan JG, Zhang Z, et al. The global burden of liver disease: the major impact of China. Hepatology. 2014;60(6):2099–2108. doi: 10.1002/hep.27406.
- Huang Y, Gan Q, Lai R, et al. Application of fatty liver inhibition of progression algorithm and steatosis, activity, and fibrosis score to assess the impact of non-alcoholic fatty liver on untreated chronic hepatitis B patients. Front Cell Infect Microbiol. 2021;11:733348. doi: 10.3389/fcimb.2021.733348.
- Choi HSJ, Brouwer WP, Zanjir WMR, et al. Nonalcoholic steatohepatitis is associated with liver-related out comes and all-cause mortality in chronic hepatitis B. Hepatology. 2020;71(2):539–548. doi: 10.1002/hep.30857.
- Mota M, Banini BA, Cazanave SC, et al. Molecular mechanisms of lipotoxicity and glucotoxicity in nonalcoholic fatty liver disease. Metabolism. 2016;65(8):1049–1061. doi: 10.1016/j.metabol.2016.02.014.
- Machado MV, Oliveira AG, Cortez-Pinto H. Hepatic steatosis in hepatitis B virus infected patients: meta-analysis of risk factors and comparison with hepatitis C infected patients. J Gastroenterol Hepatol. 2011;26(9):1361–1367. doi: 10.1111/j.1440-1746.2011.06801.x.
- Joo EJ, Chang Y, Yeom JS, et al. Hepatitis B virus infection and decreased risk of nonalcoholic fatty liver disease: a cohort study. Hepatology. 2017;65(3):828–835. doi: 10.1002/hep.28917.
- Wang B, Li W, Fang H, et al. Hepatitis B virus infection is not associated with fatty liver disease: evidence from a cohort study and functional analysis. Mol Med Rep. 2019;19:320–326.
- Chinese society of infectious diseases, chinese medical association; Chinese society of hepatology, Chinese medical association. The guidelines of prevention and treatment for chronic hepatitis B (2019 version). Zhonghua Gan Zang Bing Za Zhi. 2019;27:938–961.
- Kleiner DE, Brunt EM, Van Natta M, et al. Nonalcoholic steatohepatitis clinical research network. Design and validation of a histological scoring system for nonalcoholic fatty liver disease. Hepatology. 2005;41(6):1313–1321. doi: 10.1002/hep.20701.
- Scheuer PJ. Classification of chronic viral hepatitis: a need for reassessment. J Hepatol. 1991;13(3):372–374. doi: 10.1016/0168-8278(91)90084-o.
- Ashburner M, Ball CA, Blake JA, et al. Gene ontology: tool for the unification of biology. The gene ontology consortium. Nat Genet. 2000;25(1):25–29. doi: 10.1038/75556.
- Kanehisa M, Furumichi M, Tanabe M, et al. KEGG: new perspectives on genomes, pathways, diseases and drugs. Nucleic Acids Res. 2017;45(D1):D353–D361. doi: 10.1093/nar/gkw1092.
- Tripathi S, Pohl MO, Zhou Y, et al. Meta- and orthogonal integration of influenza ‘OMICs’ data defines a role for UBR4 in virus budding. Cell Host Microbe. 2015;18(6):723–735. doi: 10.1016/j.chom.2015.11.002.
- Newman AM, Liu CL, Green MR, et al. Robust enumeration of cell subsets from tissue expression profiles. Nat Methods. 2015;12(5):453–457. doi: 10.1038/nmeth.3337.
- Tong L. Acetyl-coenzyme a carboxylase: crucial metabolic enzyme and attractive target for drug discovery. CMLS, Cell. Mol. Life Sci. 2005;62(16):1784–1803. doi: 10.1007/s00018-005-5121-4.
- Munday MR. Regulation of mammalian acetyl-CoA carboxylase. Biochem. Soc. Trans. 2002;30(6):1059–1064. doi: 10.1042/bst0301059.
- Fullerton MD, Galic S, Marcinko K, et al. Single phosphorylation sites in Acc1 and Acc2 regulate lipid homeostasis and the insulin-sensitizing effects of metformin. Nat Med. 2013;19(12):1649–1654. doi: 10.1038/nm.3372.
- Hayashi T, Asano Y, Shintani Y, et al. Higd1a is a positive regulator of cytochrome c oxidase. Proc Natl Acad Sci U S A. 2015;112(5):1553–1558. doi: 10.1073/pnas.1419767112.
- Li T, Xian WJ, Gao Y, et al. Higd1a protects cells from lipotoxicity under high-fat exposure. Oxid Med Cell Longev. 2019;2019:6051262. doi: 10.1155/2019/6051262.
- Lee YI, Hwang JM, Im JH, et al. Human hepatitis B virus-X protein alters mitochondrial function and physiology in human liver cells. J Biol Chem. 2004;279(15):15460–15471. doi: 10.1074/jbc.M309280200.
- Masarone M, Rosato V, Dallio M, et al. Role of oxidative stress in pathophysiology of nonalcoholic fatty liver disease. Oxid Med Cell Longev. 2021;2021:9757921. doi: 10.1155/2018/9547613.
- Ameri K, Jahangiri A, Rajah AM, et al. HIGD1A regulates oxygen consumption, ROS production, and AMPK activity during glucose deprivation to modulate cell survival and tumor growth. Cell Rep. 2015;10(6):891–899. doi: 10.1016/j.celrep.2015.01.020.
- Ameri K, Maltepe E. HIGD1A-mediated dormancy and tumor survival. Mol Cell Oncol. 2015;2(4):e1030537. doi: 10.1080/23723556.2015.1030537.
- Jeon S-M, Chandel NS, Hay N, et al. AMPK regulates NADPH homeostasis to promote tumour cell survival during energy stress. Nature. 2012;485(7400):661–665. doi: 10.1038/nature11066.
- Zhu JY, Chen M, Mu WJ, et al. Higd1a facilitates exercise-mediated alleviation of fatty liver in diet-induced obese mice. Metabolism. 2022;134:155241. doi: 10.1016/j.metabol.2022.155241.