Abstract
In the last decades, due to climate changes, soil deterioration and land use/land cover (LULC) changes, land degradation (LD) has become one of the most important issues at the global, regional and local scale. In concrete terms, LD determines a reduction in the productivity of a territory and in its capacity of providing ecosystem goods and services. “Syndromes” of LD can be assessed in the past, and scenarios, conversely, can be developed for the future, as information baselines for sustainable land management strategies and interventions. LULC information is essential for identifying change trajectories and associated LD processes, and for deriving prediction rules. Methodological issues and results of studies led within the framework of the research project AGROSCENARI (Adaptation scenarios of Italian agriculture to climate change) are discussed in this paper, analysing the case of the Emilia-Romagna region in Italy. Two key trajectories are investigated in detail: artificialization on the one hand, and scrubland and forestland expansion on the other. The first trajectory is associated with LD especially in terms of physical loss of farming land and soil sealing. The second trajectory is related to abandonment of agricultural land, and linked to LD processes such as soil erosion and hydrological instability, and to wildfires. The identification of such spatially explicit LD syndromes, which can also be projected on the basis of future scenarios, allows proposing and evaluating focussed measures of sustainable land management.
INTRODUCTION
Land degradation (LD) is becoming one of the major environmental issues all over the world and also affects developed regions like North America, Australia and Southern Europe (Romm Citation2011). LD is a process involving multiple causal factors, among which climate variability, soil quality and land management play a significant role (Lambin et al. Citation2001; Reynolds and Stafford Smith Citation2002; Geist and Lambin Citation2004). It specifically refers to a reduction of the productivity and capacity of providing ecosystem services by cropland, rangeland and woodlands. Therefore, in the present study, LD is considered as a process occurring not only in a semi-natural context, but also in agricultural and peri-urban lands areas (Bajocco et al. Citation2011).
The identification of a unifying concept or explanation for land degradation processes is still a challenge. Such complexity can be tackled referring to the concept of “syndromes”. The basic idea behind this concept is to describe land use changes and associated degradation processes by archetypical, dynamic, co-evolutionary patterns of human-nature interactions (Hill et al. Citation2008). Syndromes describe bundles of interactive processes and symptoms which appear repeatedly and in many places in typical combinations and patterns (Schellnhuber et al. Citation1997).
The syndrome perspective is a powerful conceptual framework and is considered one of the most promising approaches to place-based integrated assessments of environmental change.
Trajectories of land use change and associated land degradation syndromes can then be evaluated in the past, and scenarios developed for the future, as information baselines for sustainable land management strategies and interventions.
Land use/land cover (LULC) changes are the visible result of the interactions between natural and socio-economic systems and represent one of the most important consequences of the increasing human pressure on land (Conacher and Sala Citation1998), reflecting dynamics in both the rural system and the settlement arrangement. Many studies have demonstrated that specific LULC patterns affect the level of land sensitivity to degradation, often accelerating degradation processes (Drake and Vafeidis Citation2003; Burke and Thornes Citation2004; Symeonakis et al. Citation2007). This is because LULC bears a direct effect on the same processes (as it might be in the case of erosion in sparsely vegetated or burnt areas) or because of its association with unsustainable cultivation practices (as in the case of farming on sloping land, with tillage performed along the slopes). It is therefore an essential piece of information for interpreting how past changes have been possibly associated to LD processes as well as for deriving prediction rules for modelling future transformations (Eastman Citation2009). Whenever available, LULC datasets providing comparable classifications as well as the needed spatial resolution and time coverage can be derived from existing thematic cartography. Alternatively, information on LULC could be extracted, for instance, from satellite data archives. The main source in this respect is Landsat (especially 5 and 7), which goes back to the mid-1980s.
Within the framework of the research project AGROSCENARI (Scenarios of agriculture adaptation to climate change) promoted by the Italian Ministry of Agriculture, this paper focuses on a number of methodological issues related to the analysis of past LULC trajectories and associated LD syndromes. It refers to the results of a specific case study in the region of Emilia-Romagna in Italy, where the available datasets permit an analysis of the changes that occurred over the period from 1954 to 2008. Emilia-Romagna represents an interesting case study due to the availability of consistent LULC data and, above all, due to its land use dynamics. Indeed, a recent pan-European study conducted by the European Environment Agency (EEA) showed a continuing and rapid spatial expansion of urban areas, especially in the last decade (EEA Citation2007). This was mostly visible in countries or regions with high levels of population density and economic activity: Belgium, the Netherlands, southern and western Germany and the northwest of Italy, where Emilia-Romagna is located.
Past trajectories of LULC can be analysed for investigating associated LD syndromes at regional level, possibly together with trends in other relevant drivers, e.g. aridity and climatic aggressiveness, water and soil erosion, hydrological instability and wildfires, soil sealing, and industrial and agricultural pollution, as well as landscape simplification and biodiversity loss.
Qualitative assessments of LD often result from participatory processes to the analysis of degradation and environmental issues. These include “narrative” interpretations of change trajectories and degradation processes which can be used directly or in combination with quantitative modelling and simulations (Alcamo Citation2008; Kemp-Benedict Citation2010).
For example, a number of “storylines” describing land degradation and desertification problems were developed with the European project MedAction. Descriptive scenarios were constructed and subsequently formalized in order to obtain model parameterizations (Kok and Van Delden Citation2013).
LD processes can be also assessed through quantitative indicators of vulnerability. The European project Mediterranean Desertification and Land Use (MEDALUS), for instance, developed the Environmentally Sensitive Areas Index or ESAI (Kosmas et al. Citation1999). The ESAI is calculated as the geometric mean of the scores obtained for a number of thematic indicators of sensitivity, according to (Basso et al. Citation2000): the climate quality index (CQI), the soil quality index (SQI), the vegetation quality index (VQI) and the management quality index (MQI). Each thematic indicator score in turn is the geometric mean of the different scores assigned to a number of environmental variables. The CQI is usually computed as the combination of average annual precipitation, average annual index of aridity and aspect. The SQI is usually obtained combining parent material, soil depth, texture and slope. The VQI is obtained as a composite of four variables: vegetation cover, fire risk, protection against soil erosion and resistance to drought. The MQI, finally, usually takes into account variables representing population dynamics and land-use changes, such as population density and growth and land use intensity. The final score ranges from 1, which corresponds to the lowest land sensitivity to degradation, to 2, the highest sensitivity score (Salvati and Bajocco Citation2011).
The Environmental Sensitivity Index (ESI) was developed as part of the Desertification Indicator System for Mediterranean Europe (DIS4ME). This was done in the context of another European project, DESERTLINKS(Combating Desertification in Mediterranean Europe: Linking Science with Stakeholders). The project followed an approach in many respects similar to the ESAI, although taking into account a much larger number of variables of both physical and especially socio-economic nature. The ESI was also included among the composite indicators proposed by the Food and Agriculture Organization (FAO) in the “Land Degradation Assessment in Drylands” (LADA) project (Zucca et al. Citation2009).
An approach which attempts to combine qualitative scenarios and quantitative outputs (from climatic forecasts and population projections, as well as land use modelling and synthetic vulnerability indicators) is used in the context of AGROSCENARI. The present paper focuses on one of the intermediate steps in this framework, i.e. the identification of land use change trajectories and associated land degradation “syndromes”.
STUDY AREA
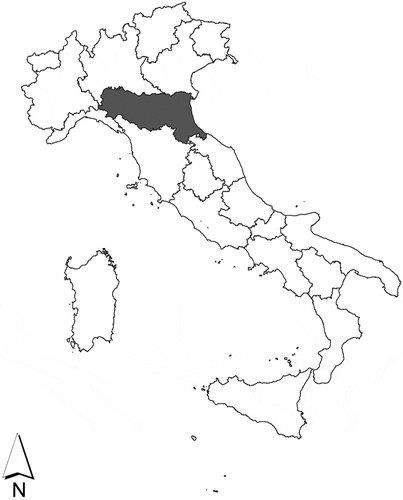
Emilia-Romagna is an administrative region of northern Italy covering an area of 22,446 km2 and with about 4.4 million inhabitants.
Nearly half of the region (48%) consists of plains while 27% is hilly and 25% mountainous. The region’s section of the Apennines is marked by areas of flysch, badland erosion (calanques) and caves. The mountains stretch for more than 300 km from the north to the southeast; the plain was formed by the gradual retreat of the sea from the Po basin and by the detritus deposited by the rivers. Almost entirely occupied by marshland in ancient times, the plains were subject to several reclamations, starting from the Etruscan period and ending just after the Second World War.
Therefore, the hard work of its people throughout the last centuries has almost totally reshaped the original landscape of Emilia-Romagna.
Vegetation in the region may be divided into belts: the common oak belt which is now covered with fruit orchards and annual crops, the pubescent and Adriatic oak belts on the lower slopes up to 900 m, the beech belt between 1000 and 1500 m and the final mountain heath belt ().
MATERIALS AND METHODS
Datasets and LULC classification harmonization
The LULC datasets were generated over the years 1954 and 2008 by the Emilia Romagna Regional Cartographic and GIS (geographic information system) Service. The classification schemes vary according to the years, but the harmonization exercise carried out by the same Service and finalized for this research allowed a comparison, with some adaptations and for most of the classes, to the third hierarchical level of the Corine Land Cover (CLC) classification system (EEA 2007). In both cases, the datasets were generated through visual interpretation (although panchromatic in the first case, and full colour and infrared in the second case). For 1954, the nomenclature is based on an a priori, hierarchical classification at two levels with five classes at the first, aggregated level (the same as in the CLC system), which are then further detailed in 19 classes at the second level. At this level there is no complete correspondence with the CLC since some classes had to be grouped, mainly due to the quality and characteristics of the photographs.
For 2008, the CLC classification system is adopted fully up to the third level in the nomenclature. Therefore, for the first level a direct comparison between the two years is possible. At the second level, a limited number of original classes had to be grouped in order to align with the 1954 classification. For instance, forest land, which originally has as separate classes broad-leaved, coniferous and mixed forest, had to be aggregated. Olive (Olea europaea) groves and fruit tree plantations also had to be included in the same class. These simplifications, however, given the hierarchical structure adopted in the nomenclature and the protocol used in both interpretations (which were made, as much as possible, coherent), are not expected to affect the validity of the analyses proposed in this study.
Both datasets have a nominal scale of 1:25,000 and are altogether comparable in terms of minimum mapping units (2.25 ha for 1954 and 1.56 ha for 2008). An overview of the main specifications of the datasets is given in .
Table 1 Land use/land cover (LULC) datasets used in the analysis
A list and description of the harmonized nomenclature, at the detailed and the aggregated levels, are given in In this case, Class 1 corresponds to artificial surfaces, Class 2 to agricultural areas, Class 3 to forest and semi-natural areas, Class 4 to wetlands and finally Class 5 to water bodies.
Table 2 Land use/land cover (LULC) classes after the harmonization
Analysis of land use changes and identification of trajectories
The European Topic Centre on Terrestrial Environment of the EEA has developed the Land and Ecosystem Accounts (LEAC) system (Gómez and Páramo Citation2005), where LULC changes are categorized into meaningful flows or “trajectories” of change. The LEAC methodology is originally based on CLC. However, it can be applied to any LULC set of data. The LEAC is basically a land cover account system, where all the possible one-to-one changes between the LULC classes are represented as a matrix and subsequently interpreted, aggregated and summarized.
There are three levels of aggregation, with the more aggregated level including the following flows:
Urban land management
Urban residential sprawl
Sprawl of economic sites and infrastructures
Agriculture internal conversions
Conversion from forested and natural land to agriculture
Withdrawal of farming
Forest creation and management
Water body creation and management
Changes of land cover due to natural and multiple causes
In this study, LULC changes (or flows) were computed by means of the IDRISI Taiga Land Change Modeler (Eastman Citation2009), comparing the 1954 and 2008 datasets. The Land Change Modeler allows, among other things, the calculation of flows, the generation of transition matrices and the statistical analysis of the significance of the drivers behind the changes.
Following the calculation of the LULC flows, the next step is their interpretation in terms of meaningful trajectories and the possible occurrence of one or more land degradation processes.
In the present study, the above was developed according to Hill et al. (Citation2008) and supported by a bibliographic analysis of, for instance, the biophysical and socio-economic factors behind the LULC changes in the area. Existing sources include peer-reviewed articles but most often “gray” literature and documents produced by the same regional authorities, local communities, etc. as well as journalistic accounts in relevant subject matters. Important sources in this respect included Saltini (Citation1981); Pelleri and Sulli (Citation1999); Preti et al. (Citation2004); Corticelli et al. (Citation2008), and Di Gennaro et al. (Citation2010).
RESULTS AND DISCUSSION
Trajectories of LULC change in Emilia-Romagna
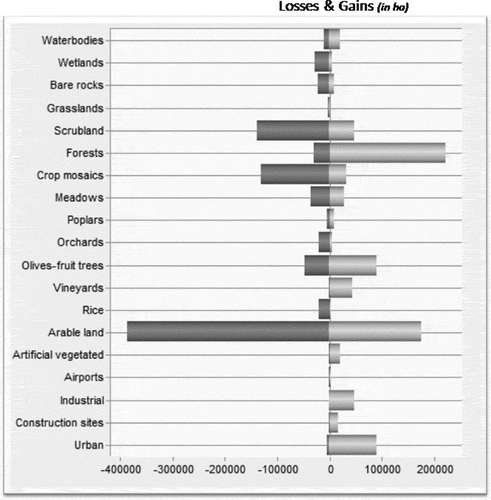
Results of gains and losses for each land use/land cover class at the third level of the nomenclature are given in (figures on the x-axis are expressed in ha). The two classes with highest net gains are urban areas and forest land. This corresponds to two distinctive land use change trajectories, i.e. artificial land expansion on the one hand and forest land expansion on the other.
Figure 2 Gains and losses for each land use/land cover class. Rice, Oryza sativa; olive, Olea europaea.
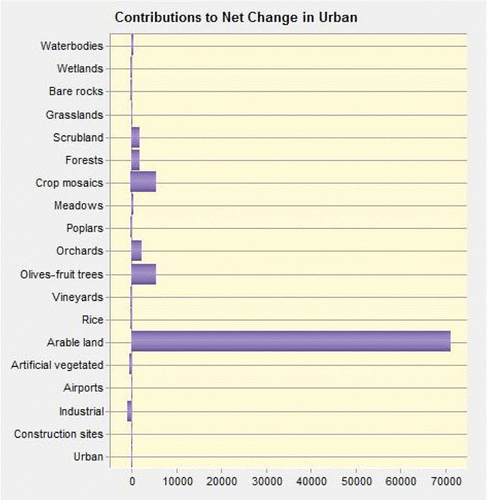
The contributions of the various land use types to the expansion of urban areas, the most important artificial land class, are shown in (figures on the horizontal axis are expressed in ha) and clearly illustrate the massive transformation of arable lands and other agricultural areas (mosaic cultivations, tree plantations and, only marginally, forest land) into artificial land that occurred over the 55 years’ time horizon. As reported in , this represents a net increase of over 172,000 ha (LULC Classes 1 to 5) out of a total regional surface of around 2,212,000 ha.
Table 3 Land use/land cover (LULC) area (in ha) and percentages for each class in 1954 and 2008 and the differences between 1954 and 2008
These changes correspond to very well-known processes of urban growth, occurring in different forms: densification around original urban centres and along the cost and, more recently, sprawl along communication axes and in the open, rural territory.
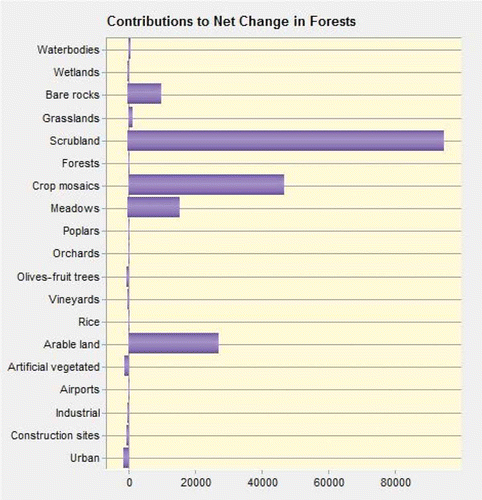
Forest expansion has taken place at the expense of several classes, as shown in (figures on the horizontal axis are in ha): mainly scrubland, crop mosaics and, once more, arable land, and only marginally at the expenses of sparsely vegetated and rock outcrops areas. While in the latter case this can be ascribed to afforestation and reforestation, the latter transformation is the result of a trajectory of land abandonment, mainly occurring in the hilly and mountainous areas of the Apennines.
This process of re-colonization of forests and natural vegetation is also well known and consists of a transition from arable land to crop mosaics and meadows, to scrubland and finally to forest stands.
Arable lands and other types of agricultural land (rice(Oryza sativa) fields, crop mosaics, meadows, etc.) are the most important net losers, due to both urban and forest expansion; in the considered time horizon of 55 years, around 346,000 ha of the agricultural surface (LULC Classes 6 to 13) have been subtracted by other LULCs.
Associated land degradation syndromes and underlying drivers
A pan-European study indicated that a rapid increase of the artificialization pace, particularly in the form of dispersed urban expansion, recently occurred in many parts of the EU, considering this as an “ignored challenge” (European Environment Agency 2007). The most visible impacts are in areas with high density of population and economic activities, as in the case of the northwestern part of Italy.
A further proof of the importance of this process is the “soil sealing guidelines”, recently published by the European Commission (Citation2012). The guidelines highlight the processes which are more directly linked to artificialization. Apart from the physical consumption of land (land take), often coinciding with the most fertile agricultural soils, the expansion of artificial areas has the known effect of sealing the soil, i.e. making its surface resistant to the absorption and storage of rainfall, thus increasing run-off and, indirectly, soil erosion (Nunes et al. Citation2010). With soil sealing, topsoil is most often removed during building activities, causing a significant loss of its organic carbon stock. While with dense urban growth the mentioned negative effects are clearly exerted on-site, with the process of dispersed expansion, given the generally lower settlement density, the related degradation processes are mainly, although not exclusively, occurring off-site.
There are many factors acting behind land take and soil sealing. In Europe, the need for new housing, industry, business locations and transport infrastructure have usually been referred to as the key drivers. Initially, this has been mainly a consequence of the growing population, while subsequently the process occurred in response to a demand for a better quality of life and living standards. In the EU, settlements increased on average by almost 9% and population only by 5% in the period 1990–2006. Although there is still a considerable difference in population growth across Europe and within regions, this process, which is also referred to as the paradox of “decoupled land take” (Prokop et al. Citation2011), was observed in many countries.
More recently, land rent and financial speculation have also played a key role in the artificialization. A paradigmatic case in this sense is Spain, which experienced a massive expansion of the construction industry after the year 2000 which then came abruptly to an end around 2007 due to the so-called “housing bubble” (Etxezarreta et al. Citation2011). In a number of countries, dependency of local taxation systems on income generated by urbanisation fees and levies, as well as an insufficient appreciation of the value of land as a scarce resource, also played a role in causing urban expansion (European Commission Citation2012).
Patterns and drivers which have occurred in Emilia-Romagna are similar to those mentioned earlier, as observed for instance by Di Gennaro et al. (Citation2010) and Lelli and Pezzi (Citation2012).
Farmland abandonment is also regarded as a key LD “syndrome” due to the subtraction of areas for agriculture (although reversible, unlike in the case of land take caused by artificialization) and to the associated land degradation processes. In Europe this process was investigated for instance by Keenleyside and Tucker (Citation2010) and in the context of the project LUCINDA (Land Care in Desertification Affected Areas) (Kosmas et al. Citation2012). An evaluation of the relation between abandonment and degradation processes with specific reference to areas in Emilia-Romagna was carried out for instance by Preti et al. (Citation2004).
As previously seen and both in terms of magnitude and spatial patterns, the main LULC trajectories identified in Emilia-Romagna over the period from 1954 to 2008 can be referred to urban expansion on the one hand and to agricultural land abandonment on the other hand. The LULC trajectories identified relate to land artificialization and abandonment; both processes occurred at the expense of good quality arable land in the flood plains of the region.
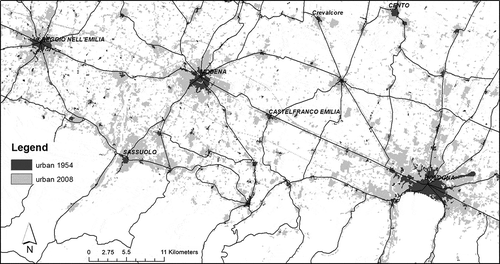
The spatial representation of the LULC changes confirms the nature of the trajectories. shows, for instance, an example of the artificialization process that occurred between 1954 and 2008 around the original urban centres. The road network is overlaid on the change map, showing also the sprawl that occurred along the major communication infrastructures.
depicts the transformation from agricultural land to forest and naturally vegetated land in the southeastern part of the region, mainly due to farmland abandonment in hilly and mountainous areas.
Figure 6 An example of areas with transition from agriculture to forest and natural vegetation land.
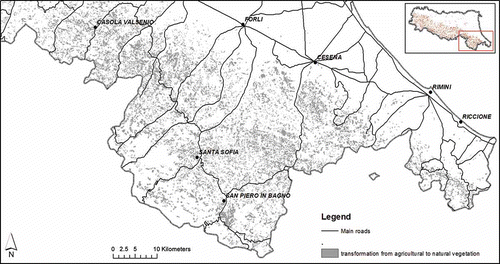
The case of forest expansion and the underlying process of abandonment of cultivated fields are characterized by a succession from arable land and complex mosaic of cultivations to protracted fallows, to meadows and natural grasslands, to transitional woodland shrub and eventually to forest and woodland creation.
In this case, the association with land degradation processes is more controversial. In principle, farmland abandonment in the region has been recognized by a number of studies as leading to soil erosion, hydrological instability (Nunes et al. Citation2010) and, indirectly, to wildfires.
However, a number of studies conducted in similar environments indicated that “new” forest land, if properly managed, can represent the agent of a positive naturalization process, a valuable asset in both economic and biodiversity terms (Pelleri and Sulli Citation1999).
The final result, i.e. whether the negative impact of land degradation would prevail over the positive effects of naturalization processes, very much depends on the climate, morphology and soils of the region, as well as on the initial characteristics of farming (e.g. presence of terraces), on conservation practices and on the type of forest succession. In general terms, it is usually recognized that land abandonment is likely to lead to land degradation in cases where vegetation cover remains altogether poor (Nunes et al. Citation2010). At this stage of the study it is not possible to establish a clear-cut relationship between land abandonment and LD; that would require more information on concurring factors or direct observations of actual degradation processes.
CONCLUSIONS
LD is not a static process and needs approaches capable of addressing its spatial and temporal dynamics (Salvati and Zitti Citation2009). LD cannot be treated as a single problem given its different underlying processes, each with distinctive impacts on the different ecosystem services: from agricultural production to water and soil quality, public health and biodiversity, just to name some important examples.
Identifying the LULC trajectories requires understanding how people make land-use decisions (decision-making processes) and how specific environmental and social factors interact to influence these decisions (decision-making context) (Geist and Lambin Citation2004; Bajocco et al. Citation2012). Through the analysis of such trajectories, negative impacts that can be related to LD could be highlighted, and the spatial pattern of the degradation processes could be evaluated (Maitima et al. Citation2009).
A better and spatially explicit knowledge of the processes driving LULC changes is a prerequisite for promoting sustainable land management. From this perspective, detailed land cover information is required to inform the many aspects dealing with sustainable land management and as a prerequisite for monitoring environmental change and modeling land use (Jansen and Di Gregorio Citation2002).
In this context, monitoring LULC trajectories at regional scale represents key information in the identification of areas affected by LD where mitigation actions should be carried out (D’Angelo et al. Citation2000).
The analysis of LULC trajectories and associated LD processes over 55 years in Emilia-Romagna showed that two key LD syndromes are of extreme importance in the region. The first is artificialization, which occurred extensively in the region, thus reducing the agricultural production base as well as generating off-site negative effects in terms of run-off and soil compaction. Land abandonment has also been shown as an important syndrome, while its net effects in terms of LD are controversial and would need more in depth-analysis of both secondary data and field observations.
While the focus of this paper is the analysis of past processes, in the continuation of the research, LULC trajectories will be used for deriving prediction rules. These are essential inputs in the construction of LD scenarios, together with external drivers such as climate change and population projections. A permanent assessment of LULC and human-related causes and responses is hence essential for operational LD studies.
REFERENCES
- Alcamo J 2008: The SAS approach: combining qualitative and quantitative knowledge in environmental scenarios. In Environmental Futures: The Practice of Environmental Scenario Analysis, Chapter 6, Ed. Alcamo J, 123–148. Elsevier, Rome.
- Bajocco S, De Angelis A, Perini L, Ferrara A, Salvati L 2012: The impact of land use/land cover changes on land degradation dynamics: a mediterranean case study. Environ. Manag., 49, 980–989.
- Bajocco S, Salvati L, Ricotta C 2011: Land degradation vs. fire: a spiral process? Prog. Phys. Geogr., 35, 3–18.
- Basso F, Bove E, Dumontet S, Ferrara A, Pisante M, Quaranta G, Taberner M 2000: Evaluating environmental sensitivity at the basin scale through the use of geographic information systems and remotely sensed data: an example covering the Agri basin—Southern Italy. Catena, 40, 19–35.
- Burke SM, Thornes JB 2004: A thematic review of EU Mediterranean desertification research in Frameworks III and IV: preface. Adv. Environ. Monit. Model, 1, 1–14.
- Conacher AJ, Sala M 1998: Land degradation in mediterranean environments of the world. Wiley, Chichester.
- Corticelli S, Guermandi M, Mariani MC 2008: Due indici per valutare l’impermeabilizzazione e il consumo del suolo. Two indexes to evaluate soil sealing and consumption of the soil. Atti 12° Conferenza Nazionale ASITA, L’Aquila 21–24 ottobre 2008 (in Italian).
- D’Angelo M, Enne G, Madrau S, Percich S, Previtali F, Pulina G, Zucca C 2000: Mitigating land degradation in Mediterranean agro-silvo-pastoral systems: a GIS-based approach. Catena, 40, 37–49.
- Di Gennaro A, Malucelli F, Filippi N, Guandalini B 2010: Dinamiche di Uso dei suoli: analisi per l’Emilia Romagna tra il 1850 e il 2003. Land use dynamics: analysis for the Emilia Romagna region between 1850 and 2003. Territori, 1/2010 (in Italian).
- Drake NA, Vafeidis A 2003: Review of spatial and temporal methods for assessing land degradation in the Mediterranean. Adv. Environ. Monit. Model., 1, 1–51.
- Eastman JR 2009: IDRISI Taiga guide to GIS and image processing. Clark Labs Clark University, Worcester, MA.
- Etxezarreta M, Navarro F, Ribera R, Soldevila V 2011: Boom and (deep) crisis in the Spanish economy: the role of the EU in its evolution. Communication for 17th Workshop on Alternative Economic Policy in Europe, September 2011, Vienna.
- European Commission 2012: Guidelines on best practice to limit, mitigate or compensate soil sealing. European Commission Staff Working Document SWD(2012) 101.
- European Environmental Agency (EEA) 2007: Urban sprawl in Europe. The ignored challenge. European Commission. Directorate-General. Joint Research Center and European Environmental Agency. Report No 10/2006, pp. 9–56.
- Geist HJ, Lambin EF 2004: Dynamic causal patterns of desertification. Bioscience, 54, 817–829.
- Gómez O, Páramo F 2005: Land and Ecosystem Accounts (LEAC). Methodological guidebook. Data processing of land cover flows. European Topic Centre on Terrestrial Environment. Universitat Antònoma de Barcelona. European Environment Agency.
- Hill J, Stellmes M, Udelhoven T, Roder A, Sommer S 2008: Mediterranean desertification and land degradation: mapping related land use change syndromes based on satellite observations. Global Planet Change, 64, 146–157.
- Jansen LJM, Di Gregorio A 2002: Parametric land cover and land-use classifications as tools for environmental change detection. Agric. Ecosyst. Environ., 91, 89–100.
- Keenleyside C, Tucker GM 2010: Farmland abandonment in the EU: an assessment of trends and prospects. Report Prepared for WWF. Institute for European Environmental Policy, London.
- Kemp-Benedict E 2010: Converting qualitative assessments to quantitative assumptions: Bayes’ rule and the pundit’s wager. Technol. Forecasting Soc. Change, 77(1), 167–171.
- Kok K, van Delden H 2013: Linking narrative storylines and quantitative models to combat desertification in the Guadalentin watershed (Spain). In Recent Developments in Foresight Methodologies, Edition: 1, Chapter 13, Ed. Giaoutzi M, Sapio B, 203–214. Springer, New York.
- Kosmas C, Kirkby M, Geeson N 1999: The Medalus project: mediterranean desertification and land use. Manual on key indicators of desertification and mapping environmentally sensitive areas to desertification. European Commission. Community Research Project Report. Energy, environment and sustainable development, EUR 18882.
- Kosmas C, Yassoglou N, Kounalaki A, Kairis O 2012: Land abandonment. Lucinda: land care in desertification affected areas: from science towards application. Booklets series B n.4, Lisbona.
- Lambin EF, Turner BL, Geist HJ et al. 2001: The causes of land-use and land-cover change: moving beyond the myths. Global Environ. Change, 11, 261–269.
- Lelli C, Pezzi G 2012: Urban sprawl, come valutare l‘urbanizzazione. Urban sprawl, how to evaluate urbanisation. Ecoscienza, Rivista di Arpa Agenzia regionale prevenzione e ambiente dell’Emilia-Romagna. Numero 5, Anno 2012 (in Italian).
- Maitima JM, Mugatha SM, Reid RS, Gachimbi LN, Majule A, Lyaruu H, Pomery D, Mathai S, Mugisha S 2009: The linkages between land use change, land degradation and biodiversity across East Africa. Afr. J. Environ. Sci Technol., 3, 310–325.
- Nunes AN, Coelho COA, de Almeida AC, Figuereido A 2010: Soil erosion and hydrological response to land abandonment in a central inland area of Portugal. Land Degrad. Dev. 21, 260–273.
- Pelleri F, Sulli M 1999: Campi abbandonati e avanzamento del bosco. Un caso di studio nelle Prealpi lombarde (Comune di Brinzio, Provincia di Varese). Abandoned fields and forest expansion. A case study in the Alps of Lombardy (Municipality of Brinzio, Province of Varese). Annali Istituto Sperimentale Selvicoltura Arezzo, Volume 28 anno 1997 (in Italian).
- Preti D, Nolè M, Guermandi M, Calzolari C, Bartolini D, Zandomeneghi M 2004: Rischio di erosione del suolo: un esempio nel comune di Monzuno. Il Suolo, 1–3: 13–16 (in Italian).
- Prokop G, Jobstmann H, Schönbauer A 2011: Overview on best practices for limiting soil sealing and mitigating its eff ects in EU-27. Environment Agency Austria, Technical Report—2011–50, ISBN: 978-92-79-20669-6. http://ec.europa.eu/environment/soil/sealing.htm
- Reynolds JF, Stafford Smith M 2002: Global desertification: do humans cause deserts? Dahlem University Press, Berlin.
- Romm J 2011: Desertification: the next dust bowl. Nature, 478, 450–451.
- Saltini A 1981: Sviluppo economico e sottrazione di spazi agricoli. Incertezze e contraddizioni del dibattito sulle esigenze di tutela degli spazi agricoli. Economic development and the taking away of agricultural spaces. Uncertainty and contradictions about the protection needs of agricultural spaces, Genio-Rurale, June 1981, Vol. 44(6), pp. 3–14 (in Italian).
- Salvati L, Bajocco S 2011: Land sensitivity to desertification across Italy: past, present, and future. Appl. Geogr., 31(1), 223–231.
- Salvati L, Zitti M 2009: Assessing the impact of ecological and economic factors on land degradation vulnerability through multiway analysis. Ecol. Indic., 9, 357–363.
- Schellnhuber HJ, Block A, Cassel-Gintz M et al. 1997: Syndromes of global change. GAIA, 6(1), 19–34.
- Symeonakis E, Calvo-Cases A, Arnau-Rosalen E 2007: Land use change and land degradation in southeastern Mediterranean Spain. Environ. Manag., 40, 80–94.
- Zucca C, Biancalani R, Hamrouni H, Attia R, Bunning S 2009: Guidelines for the identification, selection and description of nationally based indicators of land degradation and improvement. LADA and NRD, Food and Agriculture Organisation of the United Nations, Rome.

