
Abstract
Efficient nutrient use is essential for biomass production by tropical trees growing in infertile soils. Accumulation of nitrogen (N) and phosphorus (P) in the aboveground biomass of four groups of tree stands [Acacia, Eucalyptus, N2-fixing trees excluding Acacia, and other non-N2-fixing broadleaved (ONNFB) trees] were investigated using meta-analyses of a range of biomass data to test the hypothesis that fast-growing Acacia and Eucalyptus trees accumulate fewer nutrients. Data for 83 tropical tree stands were selected from the literature. Standardized major axis regressions were applied between the log10-transformed biomass and N or P accumulation. Nutrient use efficiency was compared with aboveground biomass and topsoil conditions. The slope of the regression between aboveground biomass and N accumulation for Eucalyptus was significantly smaller than the slopes for the N2-fixing trees (excluding Acacia) and the ONNFB trees. N use efficiency of Eucalyptus increased with biomass more than that of N2-fixing trees (excluding Acacia) and the ONNFB trees, because their stems and twigs tended to accumulate less N than in the other groups as biomass increased. The regressions between aboveground biomass and P accumulation had a common slope, and the intercepts of Acacia and Eucalyptus were significantly lower than that of ONNFB trees. P use efficiency of Acacia was consistently higher than that of the ONNFB trees. P use efficiency is more affected by other factors like soil conditions than is N use efficiency, and the differences in the tree groups significantly affect the use efficiency of both nutrients. These results explained some aspects of the general suitability of Acacia and Eucalyptus species for tropical plantations on infertile soils.
INTRODUCTION
Tropical forest plantations are increasingly important because of their ability to enhance biomass/carbon resources in an area (FAO Citation2006) and improve degraded soil organic matter after disturbances (Lugo Citation1997; Garay et al. Citation2004; Macedo et al. Citation2008; Wang et al. Citation2010). Fast-growing trees, including several species of Eucalyptus and Acacia, are often chosen for such purposes, because these trees can produce a profitable yield of more than 15 m3 ha−1 year−1 of biomass for small log production (Cossalter and Pye-Smith Citation2003). Weathered soils produced by long-term pedogenesis, which are usually infertile, have developed across wide areas of the humid tropics. In addition, harvesting operations and removal of tree biomass can cause serious nutrient deficits in forest soils (Nykvist Citation2000; Laclau et al. Citation2010; Dovey Citation2012). Wood biomass production is primarily regulated by nutrients, rather than water, in wet tropical areas (Jordan Citation1985). Species with the lowest nutrient demands may therefore be the best biomass producers in such soils.
Fast-growing tree species are generally considered to accumulate soil nutrients faster than slow-growing ones when multiple rotations are implemented (Cossalter and Pye-Smith Citation2003). However, whether nutrient accumulation per unit biomass differs between fast- and slow-growing trees is not known. Previous studies compared nutrient use efficiencies among several fast-growing trees (Kumar et al. Citation1998; Hiremath et al. Citation2002), some Acacia species (Kimaro et al. Citation2007) and some Eucalyptus species (Laclau et al. Citation2000), but differences in nutrient use efficiency among Acacia, Eucalyptus and other slower-growing trees are undocumented. Some fast-growing tree species have strategies that allow them to grow on degraded soils. In a nursery experiment, Acacia mangium Willd. had enhanced phosphorus (P) use efficiency under P-limited conditions (Ribet and Drevon Citation1996). Some Acacia species selectively translocate a large proportion of P (relative to nitrogen, N) away from their leaves before senescence (He et al. Citation2011; Inagaki et al. Citation2011). Some Eucalyptus plantations experience higher primary productivity with a low N investment (Binkley et al. Citation2004). Therefore, some Acacia and Eucalyptus trees may use nutrients more efficiently than other species.
Both N and P are major nutrients for tree growth (Chapin et al. Citation2011). However, they differ in their sources (Chapin et al. Citation2011), site availability (McGroddy et al. Citation2004; Chapin et al. Citation2011), metabolic forms (Matzek and Vitousek Citation2009) and degrees of translocation in plant organs (Laclau et al. Citation2001; Hättenschwiler et al. Citation2008; Inagaki et al. Citation2011). Therefore, they may not accumulate in aboveground biomass in the same way. Recent meta-analyses have clarified the relationship between leaf nutrient concentrations and some environmental and genetic factors (e.g. McGroddy et al. Citation2004; Townsend et al. Citation2007; Fyllas et al. Citation2009). A study of leaf analyses across the Amazon Basin revealed that leaf N is influenced mainly by genetic factors (family/genus/species), while leaf P is more strongly affected by the environment (Fyllas et al. Citation2009). Thus, the differing degree of structural dependency on these nutrients should be taken into account when assessing genetic differences in these levels in trees growing under different environmental conditions. In addition, the factors regulating N and P levels in plant organs other than leaves are poorly known (Kerkhoff et al. Citation2006). Understanding the accumulation of nutrients and total aboveground biomass in plants, including woody parts, will require additional research.
Trees increase the ratio of structural organs (woody parts) to metabolic organs (leaves) during their growth (Mori et al. Citation2010; Dovey Citation2012). When nutrient accumulation in aboveground biomass is considered, shift in investment between metabolic and structural organs must be considered. To evaluate this shift, forest stands ranging from juvenile to mature are needed for analysis. In contrast to leaf analyses, measuring the aboveground biomass and accumulated nutrients of entire trees is difficult because it requires destructive measurements. Until recently, very limited information on the aboveground biomass of tropical trees has been available. The results of a few international research projects, such as “Site management and productivity in tropical plantation forests” conducted by the Center for International Forestry Research (CIFOR), have improved the body of knowledge and, recently, a large amount of biomass and nutrient content data has become available (Nambiar et al. Citation2004; Nambiar Citation2008). Most of these studies have included soil parameters that help to elucidate the nitrogen use efficiency (NUE) and phosphorus use efficiency (PUE) characteristics of species growing on various levels of soil fertility.
We investigated the accumulation and allocation of N and P in the aboveground biomass of four tree groups [Acacia trees, Eucalyptus trees, N2-fixing trees excluding Acacia, and other non-N2-fixing broadleaved (ONNFB) trees], across a range of biomasses, using a meta-analysis. The aim of this study was to test the hypothesis that fast-growing Acacia and Eucalyptus tree species use smaller amounts of nutrients per unit of aboveground biomass for their growth than other tree species. Effects of topsoil conditions on N and P accumulation in tree biomass are also discussed.
MATERIALS AND METHODS
Sources of data on aboveground biomass and nutrient accumulation in tropical timber trees
Aboveground biomass and nutrient data were derived from reports on tropical plantation trees. The majority of the data was taken from a CIFOR report (Yamada et al. Citation2004), while other information was gleaned from the literature (see Appendix 1). Data for conifers were omitted because only two datasets were available. We compiled data for 83 tropical tree stands: 20 stands of Acacia species, 21 stands of N2-fixing species excluding Acacia (hereafter simply called “N2-fixing species”), 26 stands of Eucalyptus species, and 16 stands of ONNFB species. Acacia and Eucalyptus are two large genera of fast-growing trees and are planted throughout much of the tropics and in some temperate areas (Cossalter and Pye-Smith Citation2003). Most of the N2-fixing trees sampled belong to the Fabaceae, with the exception of Casuarina equisetifolia L. (Casuarinaceae). The ONNFB trees sampled grew in India and Central America, since the available data were limited to these areas.
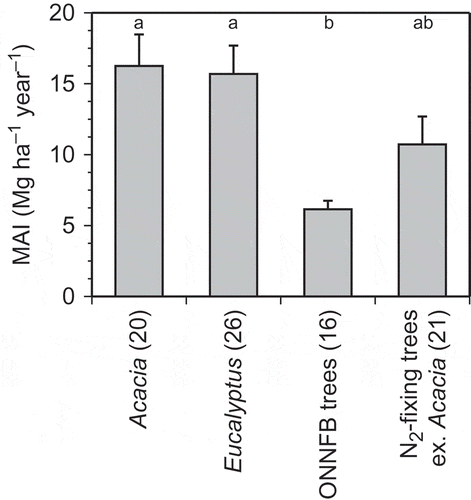
The mean annual increments (MAI) of biomass (dry weight basis) of Acacia and Eucalyptus were 16.3 and 15.7 Mg ha−1 year−1, respectively (). These MAI exceeded 15 m3 ha−1 year−1, given the wood densities of 0.55 g cm−3 for Acacia and 0.64 g cm−3 for Eucalyptus (Ogata et al. Citation2008). However, the MAI of ONNFB trees was significantly smaller than those of Acacia and Eucalyptus, and the MAI of N2-fixing trees was two-thirds of those of Acacia and Eucalyptus. In this study, we considered Acacia and Eucalyptus to be fast-growing trees, although a broader definition would encompass some rapidly growing trees in the N2-fixing and ONNFB tree groups. Total aboveground biomass was partitioned into (1) leaf biomass and (2) stem + twig biomass; we analyzed nutrient accumulation in these structural units.
Figure 1 Mean annual increment (MAI) of aboveground biomass in four tree groups: Acacia, Eucalyptus, other non-nitrogen (N2)-fixing broadleaved (ONNFB) trees, and N2-fixing trees excluding Acacia. Bars indicate the standard error of the mean. Letters indicate significant differences among tree groups according to analysis of variance and post-hoc Tukey-Kramer honestly significant difference (HSD) tests (P < 0.05). Numbers in parentheses after the names of the tree groups indicate the numbers of tree stands.
Total N and available P concentrations in the surface soil layer, mostly at depths of 0–10 cm, were used. Although the extraction methods for available P differed among studies, we did not adjust the values because no method exists to account for a variety of soil conditions. The soil data from some A. mangium stands (Nykvist and Sim Citation2009) were provided as mass values (kg ha−1) in the original literature, so we estimated the concentrations using assumed bulk density (1.2). Some of the data were supplied by N. Nykvist (pers. comm.).
Nitrogen and phosphorus use efficiency
In this study, we defined NUE and PUE as units of aboveground biomass per accumulated N and P, respectively (Kumar et al. Citation1998; Laulau et al. Citation2000; Kimaro et al. Citation2007). The original definition of nutrient use efficiency was net primary production per amount of nutrients taken up (Hirose Citation1975). We omitted belowground and litterfall components as these are not removed during harvesting. We targeted a range of tree ages when analyzing aboveground biomasses. Biomasses for the four tree groups were: (1) Acacia trees (6–326 Mg ha−1), (2) N2-fixing trees (18.2−121 Mg ha−1), (3) Eucalyptus trees (5.9−324 Mg ha−1) and (4) ONNFB trees (2.5–191 Mg ha−1) (see Appendix 1).
Statistical analyses
We applied standardized major axis (SMA) regression (Sokal and Rohlf Citation2011) to examine relationships between the log10-transformed biomass (Mg ha−1) and accumulated N or P (kg ha−1). All biomass data were categorized into one of the four tree groups listed above. The differences in slopes and intercepts of the SMA regressions were tested between these four tree groups using Sidak’s adjusted pair-wise test, depending on the significance of the null hypothesis that the slopes were equal. Analysis of covariance (ANCOVA) was applied to NUE and PUE with the factors of aboveground biomass and the tree group. Differences in slopes were tested with Holm’s adjusted pairwise test, and the differences in intercepts were tested using the Tukey-Kramer honestly significant difference (HSD) test. Log10-transformed NUE and PUE were compared by analysis of variance (ANOVA) among species represented by more than four stands. A post-hoc Tukey-Kramer HSD test was performed if the ANOVA was significant. All statistical analyses were performed using R 2.15.3 (R Core Team Citation2013) with the SMATR 3.3 package (Warton et al. Citation2012).
RESULTS
Relationship between aboveground biomass and N and P accumulation
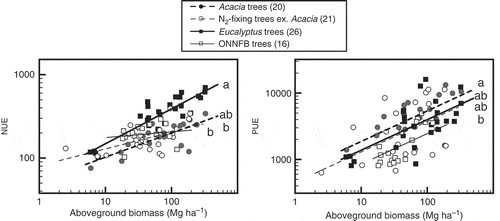
To evaluate the biomass allocation and nutrient accumulation in an entire tree and in each structural unit at different growth stages, we compared total aboveground biomass, leaf biomass and stem + twig biomass to N and P accumulation. All the regressions comparing biomass to N and P accumulation across the four tree groups were significant except those between total aboveground biomass as well as stem + twig biomass and P accumulation for ONNFB trees (P = 0.33 and 0.62, respectively; ). Although almost all of the regression slopes were similar among tree groups, the slopes of the regressions between total aboveground biomass and N accumulation and between stem + twig biomass and N accumulation were significantly different (P < 0.001). The slope for the regression of total aboveground biomass and N accumulation of Eucalyptus (0.615; 95% confidential interval, 0.535–0.706) was significantly lower (P < 0.05) than 1 and those for the N2-fixing and ONNFB trees (0.848–1.027). The slope of the regression of total aboveground biomass and N accumulation of Acacia was also lower than 1 (0.751; 95% confidential interval, 0.638–0.884). Similarly, the slope of the regression of stem + twig biomass and N accumulation of Eucalyptus (0.485) was lower (P < 0.05) than those of the other tree groups (0.875–1.194), including the slope of Acacia. Since the slope of the regression between leaf biomass and N accumulation in Eucalyptus was not significantly different from those of the other tree groups, the declined slope between total aboveground biomass and N accumulation for Eucalyptus was caused by the lower N accumulation in stems + twigs with increasing biomass. The intercept of the regression between leaf biomass and N accumulation for Eucalyptus (1.143) was significantly smaller (P < 0.05) than those of other tree groups (1.307–1.445), and thus leaf N concentration of Eucalyptus was lower.
Table 1 Parameters of the standardized major axis (SMA) regressions for the relationships between total aboveground, leaf and stem + twig biomasses and nitrogen (N) and phosphorus (P) accumulation among four tree groups
The common slope for the regressions between total aboveground biomass and P accumulation was 0.790 (95% confidential interval, 0.665–0.940) and significantly lower than 1. The intercepts for the regressions between total aboveground biomass and P accumulation for Acacia and Eucalyptus (−0.266 and −0.134, respectively) were significantly smaller than that for ONNFB trees (0.134) when the same slope was assumed. Correspondingly, the intercept of the regression between stem + twig biomass and P accumulation for Acacia (−0.566) was significantly lower than that for ONNFB trees (−0.088).
The coefficients of determination of the regressions were consistently higher in the relationships between total aboveground biomass and N accumulation (R2 = 0.82–0.89) than the relationships between total aboveground biomass and P accumulation (R2 = 0.07–0.63). Higher coefficients of determination were also observed between stem + twig biomass and N accumulation (R2 = 0.71–0.92) than between stem + twig biomass and P accumulation (R2 = 0.02–0.63). Those relationships between leaf biomass and N and P accumulations were not very different (R2 = 0.77–0.97 and 0.65–0.87, respectively).
NUE and PUE for the four tree groups and each species
Results of the ANCOVA for the effects of total aboveground biomass and tree group on NUE were significant (adjusted R2 = 0.71, F = 29.01, P < 0.001) for each factor (P < 0.001) and for their interaction (P = 0.0063). Aboveground biomass and NUE were positively correlated, and the least square mean slope was highest in Eucalyptus (). The slope for Eucalyptus was significantly higher than the slopes for the N2-fixing and ONNFB trees (P < 0.05; adjusted pairwise test). The ANCOVA results for the same factors on PUE were also significant (adjusted R2 = 0.43, F = 9.85, P < 0.001). The effects of aboveground biomass and tree group were significant (P < 0.001 and = 0.007, respectively), but their interaction was not (P = 0.48). Assuming a positive common slope, the intercepts were significantly larger in Acacia than in ONNFB trees (P < 0.05; Tukey-Kramer’s HSD test).
Figure 2 Relationships between total aboveground biomass and nitrogen use efficiency (NUE) and phosphorus use efficiency (PUE). The regression lines indicate the results of analysis of covariance for four tree groups: Acacia, Eucalyptus, other non-nitrogen (N2)-fixing broadleaved (ONNFB) trees, and N2-fixing trees excluding Acacia. Letters indicate significant differences in slopes for NUE due to the significant differences in the interaction, and in intercepts for PUE among tree groups assuming a common slope (P < 0.05). Numbers in parentheses after the names of the tree groups indicate the numbers of tree stands.
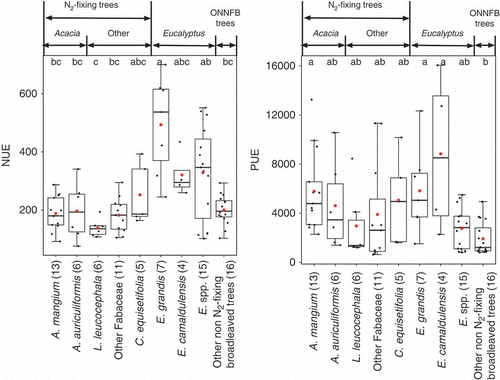
Average NUE of aboveground biomass for Eucalyptus grandis Hill ex Maiden was about 2.5-fold higher than those for ONNFB, N2-fixing and Acacia trees (). The data for E. grandis stands represented more aboveground biomass (33.7–324.3 Mg ha−1) than that for stands of Eucalyptus spp. (5.9–195.2 Mg ha−1), whereas that for other Eucalyptus spp. represented stands of a broader age range, including 1-year-old stands in the metadata (see Appendix 1). Therefore, the NUE of E. grandis was high and was significantly greater than those of most of N2-fixing trees and ONNFB trees (P < 0.05; ). The average PUEs of A. mangium, E. grandis and Eucalyptus camaldulensis Dehnh. were 3.0–4.6-fold higher than those of ONNFB trees (P < 0.05).
Figure 3 Nitrogen use efficiency (NUE) and phosphorus use efficiency (PUE) for aboveground biomass of each of several species (n ≥ 4) and the remaining members of their tree groups. Letters indicate significant differences among species according to a post-hoc Tukey-Kramer honestly significant difference (HSD) test (P < 0.05). Numbers in parentheses indicate the numbers of plots. The top, bottom and middle lines in each box correspond to the 75th, 25th and 50th (median) percentiles, respectively. Whiskers extend from upper and lower quartiles ± 1.5 × (interquartile ranges). Asterisks indicate the arithmetical means.
Relationship between topsoil conditions and NUE and PUE
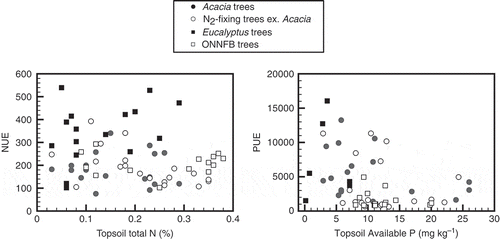
Because the metadata included various soil conditions (see Appendix 1), the relationships between total N and NUE and between available P and PUE were compared in the topsoils (). The regression between the total N and NUE was not significant (P > 0.05), whereas the SMA regression between available P and log10-transformed PUE was significant (P = 0.019; R2 = 0.098), although the P extraction methods varied.
Figure 4 Relationship between total nitrogen (N) in the topsoil and nitrogen use efficiency (NUE, left) and between available phosphorus (P) in the topsoil and phosphorus use efficiency (PUE, right).
DISCUSSION
Nutrient accumulation and allocation in Acacia and Eucalyptus
Acacia accumulated less P than did ONNFB trees. Larger Eucalyptus stands had higher NUE, and some Eucalyptus species tended to have higher PUE than did ONNFB trees. These results support the hypothesis that fast-growing Acacia and Eucalyptus tree species use fewer nutrients per unit of aboveground biomass, with the exception of N in Acacia.
P accumulation per unit biomass in Acacia and Eucalyptus tended to be small throughout the biomass range. Agricultural leguminous plants generally require a relatively large amount of P, with the exception of some tropical trees (Vitousek et al. Citation2002). For Acacia, the results corresponded with those of a pot experiment in which high PUE occurred under P-limited conditions (Ribet and Drevon Citation1996). Some Acacia species, including A. mangium, can selectively translocate a large proportion (> 70% at maximum) of P before leaf senescence (He et al. Citation2011; Inagaki et al. Citation2011). The efficiency of P resorption in Eucalyptus has been reported to be more than 50% in many studies (Fife et al. Citation2008; Yuan and Chen Citation2009). Thus, P accumulation in aboveground biomass and P usage by both Acacia and Eucalyptus may be smaller than in other species, because P in litterfall is also small. In wet tropical regions, P tends to limit primary production more than N (Chapin et al. Citation2011). Such lower PUE would be an advantage under P-limited conditions. Acacia and Eucalyptus may be competitive with other species in terms of P accumulation.
The common slopes of the regressions between total aboveground biomass and P accumulation and between total aboveground biomass and PUE may indicate that the ratios of P accumulation in stem + twig biomass to P accumulation in leaf biomass are similar among all tree groups at each biomass size. PUE of all the tree groups increased with the total aboveground biomass increase, and the common slope of the regressions between total aboveground biomass and P accumulation was less than 1. These results suggested that P concentrations in total aboveground biomass of all the trees gradually decreases during growth, and the differences in regression intercepts indicated the differences in the P concentrations of total aboveground biomass of the tree groups. Tropical trees tend to have a smaller ratio of leaf biomass to total aboveground biomass than other trees; our meta-data indicated that this percentage for all meta-data was less than 36%, and the percentages for larger-biomass trees (> 100 Mg ha−1) were only 2–12% (see Appendix 1). Therefore, P accumulation in stem + twig biomass became a large proportion of total P accumulations. In the case of Eucalyptus stands, P concentrations in stems were less than a half of those in leaves (Bouvet et al. Citation2013). The increase in woody structures, which contain less P, may enhance PUE during the growth periods of all the tree groups.
N accumulation in Eucalyptus was less than in the N2-fixing and ONNFB trees as biomass increased. The NUE increased for Eucalyptus relative to these other tree groups as aboveground biomass became larger (). These results suggested that N concentrations in stems and twigs were low or decreased as the Eucalyptus trees grew. Binkley et al. (Citation2004) noted that resource use efficiency (including NUE) increased with primary production in a Eucalyptus plantation dataset. A growth model of Eucalyptus also indicated that N concentrations in stem and twig biomass decreased as stem diameter increased, whereas stem P concentrations remained constant over time (Bouvet et al. Citation2013). Our findings supported those results. Our results also indicated that the slope of the regression between stem + twig biomass and N of Eucalyptus (0.485) was only about a half of the slopes of the other tree groups (0.875–1.194). Both NUE and PUE in Eucalyptus increased with aboveground biomass; the slope between stem + twig biomass versus their N accumulation (0.485) was distinctly lower than that between stem + twig biomass and P accumulation (0.881). Therefore, we hypothesized that Eucalyptus may selectively translocate a large proportion of N during wood senescence. While the ratio of woody parts to leaves increased as growth progressed, N concentration in woody cells may decrease. In addition, the differences in the regression slopes between total aboveground biomass and N accumulation may derive from differences in the degree of translocation of N from the woody structures in each tree group. However, more than 50% of P was translocated from stem-wood during senescence in Eucalyptus clone forests (Laclau et al. Citation2001; Sette et al. Citation2013), while less than 30% of N was translocated from stem-wood (Laclau et al. Citation2001). The translocation rates of N and P in twigs and in stems of other species are still poorly understood, and further studies are needed to understand why Eucalyptus forests had a lower slope.
Another possible reason for the differences in the slopes is differences in the ratios of N accumulation in stem + twig biomass to that in leaf biomass among the tree groups. The N concentration in leaves is more than 10-fold higher than that in wood in some forests (Wang et al. Citation1991; Nykvist et al. Citation1996; Stanley and Montagnini Citation1999; Bouvet et al. Citation2013), and these differences in N concentrations tend to exceed those in P concentrations. In contrast to P accumulation, some tree groups may have a higher ratio of N accumulation in leaves to N accumulation in stems + twigs, which may explain why the slopes between total aboveground biomass and N accumulation of the N2-fixing and ONNFB trees were not significantly lower than 1.
Acacia and N2-fixing trees contain large amounts of N. They harbor symbionts that are able to fix a considerable amount of N from atmospheric N2; not all their accumulated N comes from available soil sources. In the case of A. mangium, the percentages of accumulated N from fixation have been estimated to be 24–65% (Galiana et al. Citation2002), 10–59% (Bouillet et al. Citation2008) and 54 (± 22)% (Mercado et al. Citation2011). Therefore, the amount of soil N used by N2-fixing trees may be small even though they have high demands for N (Inagaki et al. Citation2009).
The smaller accumulations of N in Eucalyptus than in N2-fixing and ONNFB trees and of P in Acacia and Eucalyptus than in ONNFB trees suggested that some Eucalyptus and Acacia trees used in tropical plantations can produce more biomass than can ONNFB trees per unit resource (N and P). Whether such efficient nutrient use was due to their larger MAI or to the properties of the Eucalyptus and Acacia species used in this study is difficult to determine. MAI is not a suitable parameter to use to answer this question because growth rates are not consistent among tree ages and species (West Citation2006). Our results were also limited to the species for which metadata were available (see Appendix 1). To better understand nutrient use in trees, detailed growth information for each species should be prepared. Additional studies concerning nutrient translocation in trees will also further our knowledge (Laclau et al. Citation2001; He et al. Citation2011; Inagaki et al. Citation2011; Sette et al. Citation2013).
N and P accumulations under various soil conditions
More than 80% of the N accumulation in total aboveground biomass was explained by the differences among the tree groups using the regressions, even though the metadata included various soil conditions. The total N in the topsoil did not influence NUE. In contrast, only 7–63% of the P accumulation in total aboveground biomass was explained by the differences among the tree groups, indicating that other factors influenced the P accumulation. Although the P extraction methods were different among the studies, the available P in the topsoil is likely to affect PUE.
Leaf and leaf-litter P of tropical trees tend to be more affected by soil conditions than are N levels. Fyllas et al. (Citation2009) reported that leaf P is primarily regulated by environmental factors (47%), followed by genetic factors (23%), whereas leaf N is primarily regulated by genetic factors (ca. 40%). In comparisons of 45 tropical trees, the leaf-litter P concentration varied by a factor of 7, whereas the litter N concentration varied only by a factor of 3 (Hättenschwiler et al. Citation2008). The primary reason that P levels in plant structures are more influenced by environmental factors than are N levels may depend on the mobility of N and P in plants. In leaves, more than 50% of N is used to produce insoluble compounds such as photosynthetic enzymes (Rubisco) and proteins (Chapin et al. Citation2011). P in leaves seems to form more labile and mobile compounds; labile P, which consisted of >50% inorganic P, comprised most of the total P in the fresh litter horizon of temperate pine forests (Polglase et al. Citation1992). Thus, leaf P concentrations fluctuate more than leaf N ones, and the N:P ratio of leaf litter tends to be higher than that of fresh leaves in tropical forests with infertile soil because P resorption during leaf senescence increases under P-limited conditions (McGroddy et al. Citation2004; Hättenschwiler et al. Citation2008). Although the forms of N and P found in wood are poorly known, previous studies indicated that P concentrations in woody inner-stem cells produced during the previous year are considerably lower than those in woody cells produced during the current year in Eucalyptus (Laclau et al. Citation2001; Sette et al. Citation2013). Ostertag (Citation2010) suggested that P tended to be stored after P fertilization to guard against possible P starvation, in Hawaiian forests. These differences in mobility of N and P may inform our results, i.e., PUE is affected by other factors more than by the tree groups, compared to NUE.
Although other factors including soil conditions may affect the nutrient use efficiency, particularly in PUE, the differences among the tree groups significantly affect NUE and PUE. The lower nutrient requirements for biomass production by Acacia and Eucalyptus can explain why they survive on degraded soils.
CONCLUSIONS
The results of this study indicated that some Eucalyptus trees can accumulate more aboveground biomass than N2-fixing and ONNFB trees while incorporating less aboveground N. Furthermore, some Acacia and Eucalyptus trees can produce more aboveground biomass than ONNFB trees while using less P. While PUE is more affected by external factors, like soil conditions, than is NUE, differences among the tree groups significantly affected NUE and PUE. Although factors such as water availability and light capture should also be considered, our results explained some aspects of the general suitability of these tree groups for tropical plantations with infertile soils.
SUPPLEMENTARY MATERIAL
Supplementary material for this article is available online from http://dx.doi.org/10.1080/00380768.2014.929025
Appendix 2. References for Appendix 1
Download PDF (79.4 KB)Appendix 1. List of aboveground biomass, nutrient accumulation and soil chemical properties from 83 tree stands
Download MS Excel (30.7 KB)ACKNOWLEDGMENTS
We thank Drs. Hisashi Abe, Hidetoshi Shigenaga and Shigehiro Ishizuka at the Forestry and Forest Products Research Institute, Japan, and Dr. Shin Ugawa at Kagoshima University, Japan, for their valuable comments on this manuscript. We also thank Dr. Nils Nykvist in Rönninge, Sweden, for access to detailed soil data from the Mendolong site in Sabah, Malaysia. This study was financially supported by the Ministry of Agriculture, Forestry and Fisheries, Japan.
REFERENCES
- Binkley D, Stape JL, Ryan MG 2004: Thinking about efficiency of resource use in forests. For. Ecol. Manage., 193, 5–16. doi:10.1016/j.foreco.2004.01.019
- Bouillet JP, Laclau JP, Gonçalves JLDM, Moreira MZ, Trivelin PCO, Jourdan C, Silva EV, Piccolo MC, Tsai SM, Galiana A 2008: Mixed-species plantations of Acacia mangium and Eucalyptus grandis in Brazil 2: nitrogen accumulation in the stands and biological N2 fixation. For. Ecol. Manage., 255, 3918–3930. doi:10.1016/j.foreco.2007.10.050
- Bouvet A, Nguyen-The N, Melun F 2013: Nutrient concentration and allometric models for hybrid eucalyptus planted in France. Ann. For. Sci., 70, 251–260. doi:10.1007/s13595-012-0259-3
- Chapin IIIFS, Matson PA, Vitousek PM 2011: Principles of Terrestrial Ecosystem Ecology. 2nd edn. Springer, New York.
- Cossalter C, Pye-Smith C 2003: Fast-Wood Forestry –Myths and Realities. CIFOR, Bogor. http://www.cifor.org/online-library/browse/view-publication/publication/1701.html (May, 2013).
- Dovey SB 2012: Effects of clear felling and residue management on nutrient pools, productivity and sustainability in a clonal eucalypt stand in South Africa. Dissertation, Department of Soil Science, Stellenbosch University.
- FAO 2006: Global planted forests thematic study: results and analysis. In Planted Forests and Trees Working Paper 38. Eds. Del Lungo A, Ball J, Carle J, FAO, Rome, http://www.fao.org/docrep/012/j9429e/j9429e00.pdf (Oct, 2013).
- Fife D, Nambiar E, Saur E 2008: Retranslocation of foliar nutrients in evergreen tree species planted in a Mediterranean environment. Tree Physiol., 28, 187–196. doi:10.1093/treephys/28.2.187
- Fyllas NM, Patiño S, Baker TR et al. 2009: Basin-wide variations in foliar properties of Amazonian forest: phylogeny, soils and climate. Biogeosciences, 6, 2677–2708. doi:10.5194/bg-6-2677-2009
- Galiana A, Balle P, N’Guessan Kanga A, Domenach A 2002: Nitrogen fixation estimated by the 15N natural abundance method in Acacia mangium Willd. inoculated with Bradyrhizobium sp. and grown in silvicultural conditions. Soil Biol. Biochem., 34, 251–262. doi:10.1016/S0038-0717(01)00179-1
- Garay I, Pellens R, Kindel A, Barros E, Franco AA 2004: Evaluation of soil conditions in fast-growing plantations of Eucalyptus grandis and Acacia mangium in Brazil: a contribution to the study of sustainable land use. Appl. Soil Ecol., 27, 177–187. doi:10.1016/j.apsoil.2004.03.007
- Hättenschwiler S, Aeschlimann B, Coûteaux MM, Roy J, Bonal D 2008: High variation in foliage and leaf litter chemistry among 45 tree species of a neotropical rainforest community. New Phytol., 179, 165–175. doi:10.1111/j.1469-8137.2008.02438.x
- He H, Bleby TM, Veneklaas EJ, Lambers H 2011: Dinitrogen-fixing Acacia species from phosphorus-impoverished soils resorb leaf phosphorus efficiently. Plant Cell Environ., 34, 2060–2070. doi:10.1111/j.1365-3040.2011.02403.x
- Hiremath A, Ewel J, Cole T 2002: Nutrient use efficiency in three fast-growing tropical trees. For. Sci., 48, 662–672.
- Hirose T 1975: Relations between turnover rate, resource utility and structure of some plant populations: a study in the matter budgets. J. Fac. Sci. Univ. Tokyo., 3, 355–407.
- Inagaki M, Inagaki Y, Kamo K, Titin J 2009: Fine-root production in response to nutrient application at three forest plantations in Sabah, Malaysia: higher nitrogen and phosphorus demand by Acacia mangium. J. Forest Res., 14, 178–182. doi:10.1007/s10310-009-0113-0
- Inagaki M, Kamo K, Miyamoto K, Titin J, Jamalung L, Lapongan J, Miura S 2011: Nitrogen and phosphorus retranslocation and N:P ratios of litterfall in three tropical plantations: luxurious N and efficient P use by Acacia mangium. Plant Soil., 341, 295–307. doi:10.1007/s11104-010-0644-3
- Jordan CF 1985: Nutrient Cycling in Tropical Forest Ecosystems. Wiley, Chichester.
- Kerkhoff AJ, Fagan WF, Elser JJ, Enquist BJ 2006: Phylogenetic and growth form variation in the scaling of nitrogen and phosphorus in the seed plants. Am. Nat., 168, E103–122. doi:10.1086/507879
- Kimaro AA, Timmer VR, Mugasha AG, Chamshama SAO, Kimaro DA 2007: Nutrient use efficiency and biomass production of tree species for rotational woodlot systems in semi-arid Morogoro, Tanzania. Agrofor. Syst., 71, 175–184. doi:10.1007/s10457-007-9061-x
- Kumar BM, George SJ, Jamaludheen V, Suresh TK 1998: Comparison of biomass production, tree allometry and nutrient use efficiency of multipurpose trees grown in woodlot and silvopastoral experiments in Kerala, India. For. Ecol. Manage., 112, 145–163. doi:10.1016/S0378-1127(98)00325-9
- Laclau JP, Bouillet JP, Ranger J 2000: Dynamics of biomass and nutrient accumulation in a clonal plantation of Eucalyptus in Congo. For. Ecol. Manage., 128, 181–196. doi:10.1016/S0378-1127(99)00146-2
- Laclau JP, Bouillet JP, Ranger J, Joffre R, Gouma R, Saya A 2001: Dynamics of nutrient translocation in stemwood across an age series of a Eucalyptus hybrid. Ann. Bot., 88, 1079–1092. doi:10.1006/anbo.2001.1550
- Laclau JP, Levillain J, Deleporte P et al. 2010: Organic residue mass at planting is an excellent predictor of tree growth in Eucalyptus plantations established on a sandy tropical soil. For. Ecol. Manage., 260, 2148–2159. doi:10.1016/j.foreco.2010.09.007
- Lugo AE 1997: The apparent paradox of reestablishing species richness on degraded lands with tree monocultures. For. Ecol. Manage., 99, 9–19. doi:10.1016/S0378-1127(97)00191-6
- Macedo MO, Resende AS, Garcia PC, Boddey RM, Jantalia CP, Urquiaga S, Campello EFC, Franco AA 2008: Changes in soil C and N stocks and nutrient dynamics 13 years after recovery of degraded land using leguminous nitrogen-fixing trees. For. Ecol. Manage., 255, 1516–1524. doi:10.1016/j.foreco.2007.11.007
- Matzek V, Vitousek PM 2009: N:P stoichiometry and protein:RNA ratios in vascular plants: an evaluation of the growth-rate hypothesis. Ecol. Lett., 12, 765–771. doi:10.1111/j.1461-0248.2009.01310.x
- McGroddy M, Daufresne T, Hedin LO 2004: Scaling of C: N: P stoichiometry in forests worldwide: implications of terrestrial Redfield-type ratios. Ecology, 85, 2390–2401. doi:10.1890/03-0351
- Mercado AR, Van Noordwijk M, Cadisch G 2011: Positive nitrogen balance of Acacia mangium woodlots as fallows in the Philippines based on 15N natural abundance data of N2 fixation. Agrofor. Syst., 81, 221–233. doi:10.1007/s10457-010-9309-8
- Mori S, Yamaji K, Ishida A et al. 2010: Mixed-power scaling of whole-plant respiration from seedlings to giant trees. Proc. Natl. Acad. Sci. USA., 107, 1447–1451. doi:10.1073/pnas.0902554107
- Nambiar EKS 2008: Site Management and Productivity in Tropical Plantation Forests: Proceedings of Workshops in Piracicaba (Brazil) 22–26 November 2004 and Bogor (Indonesia) 6–9 November 2006.CIFOR, Bogor.
- Nambiar EKS, Ranger J, Tiarks A, Toma T 2004: Site Management and Productivity in Tropical Plantation Forests: Proceedings of Workshops in Congo July 2001 and China February 2003.CIFOR, Bogor.
- Nykvist N 2000: Tropical forests can suffer from a serious deficiency of Calcium after logging. AMBIO, 29, 310–313. doi:10.1579/0044-7447-29.6.310
- Nykvist N, Sim BL 2009: Changes in carbon and inorganic nutrients after clear felling a rainforest in Malaysia and planting with Acacia mangium. J. Trop. For. Sci., 21, 98–112.
- Nykvist N, Sim BL, Malmer A 1996: Effects of tractor logging and burning on biomass production and nutrient accumulation in Acacia mangium plantations in Sabah, Malaysia. J. Trop. For. Sci., 9, 161–183.
- Ogata K, Fujii T, Abe H, Bass P 2008: Identification of the Timbers of Southeast Asia and the Western Pacific. Kaiseisha Press, Ohtsu.
- Ostertag R 2010: Foliar nitrogen and phosphorus accumulation responses after fertilization: an example from nutrient-limited Hawaiian forests. Plant Soil., 334, 85–98. doi:10.1007/s11104-010-0281-x
- Polglase PJ, Jokela EJ, Comerford NB 1992: Phosphorus, nitrogen, and carbon fractions in litter and soil of southern pine plantations. Soil Sci. Soc. Am. J., 56, 566–573. doi:10.2136/sssaj1992.03615995005600020036x
- R Core Team 2013: R: a Language and Environment for Statistical Computing. http://www.r-project.org/
- Ribet J, Drevon JJ 1996: The phosphorus requirement of N2-fixing and urea-fed Acacia mangium. New Phytol., 132, 383–390. doi:10.1111/j.1469-8137.1996.tb01858.x
- Sette CR, Laclau J-P, Filho MT, Moreira RM, Bouillet JP, Ranger J, Almeida JCR 2013: Source-driven remobilizations of nutrients within stem wood in Eucalyptus grandis plantations. Trees, 27, 827–839. doi:10.1007/s00468-012-0837-x
- Sokal RR, Rohlf FJ 2011: Biometry. 4th edn. W. H. Freeman, New York.
- Stanley WG, Montagnini F 1999: Biomass and nutrient accumulation in pure and mixed plantations of indigenous tree species grown on poor soils in the humid tropics of Costa Rica. For. Ecol. Manage., 113, 91–103. doi:10.1016/S0378-1127(98)00417-4
- Townsend AR, Cleveland CC, Asner GP, Bustamante MMC 2007: Controls over foliar N:P ratios in tropical rain forests. Ecology, 88, 107–118. doi:10.1890/0012-9658(2007)88[107:COFNRI]2.0.CO;2
- Vitousek PM, Cassman K, Cleveland C et al. 2002: Towards an ecological understanding of biological nitrogen fixation. Biogeochemistry, 57, 1–45. doi:10.1023/A:1015798428743
- Wang D, Bormann FH, Lugo AE, Bowden RD 1991: Comparison of nutrient-use efficiency and biomass production in five tropical tree taxa. For. Ecol. Manage., 46, 1–21. doi:10.1016/0378-1127(91)90241-M
- Wang F, Li Z, Xia H, Zou B, Li N, Liu J, Zhu W 2010: Effects of nitrogen-fixing and non-nitrogen-fixing tree species on soil properties and nitrogen transformation during forest restoration in southern China. Soil Sci. Plant Nutr., 56, 297–306. doi:10.1111/j.1747-0765.2010.00454.x
- Warton DI, Duursma RA, Falster DS, Taskinen S 2012: smatr 3–an R package for estimation and inference about allometric lines. Meth. Ecol. Evol., 3, 257–259. doi:10.1111/j.2041-210X.2011.00153.x
- West PW 2006: Growing Plantation Forests. Springer, Heidelberg.
- Yamada M, Toma T, Hiratsuka M, Morikawa Y 2004: Biomass and potential nutrient removal by harvesting in short-rotation plantations. In Site Management and Productivity in Tropical Plantation Forests: Proceedings of Workshops in Congo July 2001 and China February 2003. Eds. Nambiar E, Ranger J, Tiarks A, Toma T, pp. 213–226. CIFOR, Bogor.
- Yuan Z, Chen HYH 2009: Global-scale patterns of nutrient resorption associated with latitude, temperature and precipitation. Glob. Ecol. Biogeogr., 18, 11–18. doi:10.1111/j.1466-8238.2008.00425.x