
Abstract
We investigated radioactive cesium (Cs) export in stream water during a typhoon flood event (No. 1204, Guchol) in a small forested headwater catchment (1.2 ha), which was contaminated by the Fukushima Dai-ichi Nuclear Power Plant (FDNPP) disaster. The experimental watershed is covered with hardwood and conifer trees. Hourly stream water samples were collected by an automatic water sampler, and turbidity was measured every 10 min. Downstream transport of radioactive Cs was recorded through the typhoon, during which the total rainfall was 168 mm. Total cesium-134 (134Cs), cesium-137 (137Cs) and suspended solid (SS) concentrations and turbidity were elevated on the rising limb of the hydrograph. When maximum rainfall intensity, maximum runoff peak were observed, and maximum radioactive Cs and SS concentrations occurred. Total 134Cs and 137Cs concentrations were 1.5 and 2.4 Bq L−1, respectively, at peak flow. However, concentrations of radioactive Cs, SS and turbidity dropped sharply on the receding limb. After filtration (0.7 μm), the concentrations of 134Cs and 137Cs were either not detectable (ND) or below 0.09 Bq L−1. Concentrations of dissolved radioactive Cs in stream water were very low, and radioactive Cs was mainly discharged with suspended materials. Total 134Cs and 137Cs exports from the study watershed were 43 and 72 Bq m−2, respectively. These exports represented approximately 0.07% of the 134Cs and 137Cs fallout around the study site (180 kBq m−2). We therefore concluded that discharge of radioactive Cs from forested headwaters was negligible even though a typhoon flood event.
1 INTRODUCTION
Radioactive cesium (Cs) was released into the atmosphere by the Fukushima Daiichi Nuclear Power Plant (FDNPP) disaster in March 2011. Approximately 70% of the Fukushima Prefecture is covered by forest. In spite of the fact that there was long-term retention of radioactive Cs in forest ecosystems from researches for a long period following the Chernobyl accident, there is concern that radioactive Cs may flow downwards through stream water in this part of Japan because of the steep mountainous terrain and the high rainfall (Yamaguchi et al. Citation2012). The IAEA (International Atomic Energy Agency) (Citation2006) reviewed several reports from the area influenced by the Chernobyl accident and reported that the annual net export of 137Cs from forest ecosystems was less than 1%. However, the Japanese landscape and climate are rather different from those in the Chernobyl-contaminated continental forests (Ohte et al. Citation2013). For example, typhoons are frequent in Japan, and usually result in large-scale flushing and flood events.
Previous studies have reported the behavior of radioactive Cs in river water in large mixed land-use watersheds, including forests (Matsunaga et al. Citation1991; Sansone et al. Citation1996; Burrough et al. Citation1999; Willflinger et al. Citation2005; Ueda et al. Citation2013). For example, a study was carried out in a relatively small forested watershed in North Sweden. However, 16% of the watershed was covered by a mire, from which there may have been considerable dissolved organic matter export owing to the cool climate (Nylén and Grip Citation1997). There is little information about the behavior of radioactive Cs in stream water in forested headwaters in temperate climates, such as are found in Japan.
The objectives of this study were therefore (i) to monitor the behavior of radioactive Cs in stream water from a small forested headwater catchment during a typhoon storm event and (ii) to estimate the discharge of radioactive Cs during the typhoon in the forested watershed in the Fukushima Prefecture.
2 MATERIALS AND METHODS
2.1 Study site
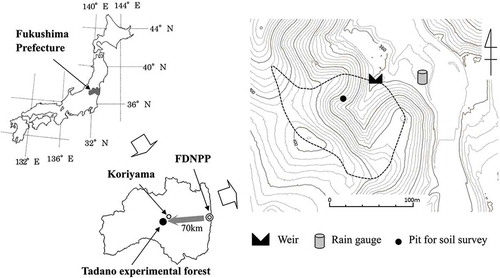
The investigation was carried out in a small catchment in the Tadano Experimental Forest of the Fukushima Prefectural Forestry Research Center, Koriyama, Fukushima Prefecture (N37°23’, E140°14’). The study catchment is located approximately 70 km west of the FDNPP. Data from the Automated Meteorological Data Acquisition System (AMeDAS) showed that the annual average rainfall in Koriyama from 1981 to 2010 was 1163 mm, and the mean air temperature was 12.1°C (JMA, Citation2013). The drainage area is 1.2 ha, and the elevation ranges from 358 to 409 m (). The mean slope is 25°, which is common in native forest hydrological experimental watersheds (Hattori et al. Citation2001). The mid-slopes in the catchment are steep (almost 40°). The catchment is underlain with sedimentary rocks (sandstone and tuff). The vegetation on the upper slopes comprises deciduous broad-leaved species, such as Quercus serrates Thunb. ex Murray, and Japanese red pine (Pinus densiflora. Sieb. et Zucc). The density of the adjacent stand, in which Quercus serrates dominates, is approximately 1000 trees ha−1 (Hiruta, pers. comm.). There is also a 0.2-ha plantation that is 48 years old. The dominant species in this plantation are Cryptomeria japonica D. Don and Chamaecyparis obtusa Sieb. et Zucc. and the density is 1150 trees ha−1. The soil is classified as Cambisols in the international soil classification system by the Food and Agriculture Organization of the United Nations, and the United Nations Educational, Scientific, and Cultural Organization (FAO-UNESCO), or Brown forest soil (Forest Soil Division Citation1976). A soil survey at a mid-slope pit () showed that the Ao horizon was 3 cm thick, and the A horizon was between 10 and 20 cm thick. The A horizon was well aggregated. The soil of the B horizon had a loam texture, and contained major (montmorillonite, chlorite and kaolinite) and minor (vermiculite and illite) clay minerals. The results of the handy dynamic cone penetration test showed that the soil layer was thin (approximately 1.5 m). Airborne monitoring data from the Ministry of Education, Culture, Sports, Science and Technology (MEXT) showed that the total deposition density of radioactive cesium (134Cs and 137Cs) was 180 kBq m−2 as of June 28, 2012, around the study watershed (MEXT Citation2012). A decontamination experiment, which involved removing the organic layer from the forest floor, was carried out on a small mid-slope area of the plantation (400 m2: about 3% of the watershed) in September 2011 (FA Citation2011). Judging from the size of the decontamination experiment, we considered that the influence of the decontamination experiment was small. From June 19 to 20, a large typhoon (No. 1204; Guchol) passed through eastern Japan and caused a large storm event in the study catchment. In this paper, we discuss the discharge of radioactive Cs during the typhoon storm event.
Figure 1 Location of the study catchment. “FDNPP” represents the Fukushima Dai-ichi Nuclear Power Plant.
2.2 Sampling methods
A 60° V-notch weir and a water level gauge (Koshin Denki Kogyo Co., Ltd., STS DL/N70) were located at the catchment outlet, close to the headwater spring. Runoff was recorded every 10 min. Stream water was sampled twice a month during base flow, and an automatic water sampler (ISCO, Model 6712) was set up near the weir to collect 2-L stream water samples every hour during the storm event. A turbidity sensor (FTS, DTS-12) was connected to the water sampler, and turbidity was recorded every 10 min. Rainfall was recorded with a tipping-bucket rain gauge, located in an open area about 50 m from the weir.
2.3 Sample analysis
Radioactive Cs concentrations were measured with a germanium semiconductor detector (relative efficiency 43%; SEIKO EG and G ORTEC, GEM-40) connected to a multichannel analyzer at Forestry and Forest Products Research Institute. Gamma-ray peaks of 604 and 662 keV were used to determine 134Cs and 137Cs activities, respectively. The measurement system was calibrated using a standard gamma-ray source (MX033MR, Japan Radioisotope Association, Tokyo, Japan), and soil samples (soil sample 01; IAEA-CU-2006-03 World-Wide Open Proficiency Test on the Determination of Gamma Emitting Radionuclides, IAEA/AL/171) were used to check the accuracy. The measured 134Cs activity was corrected for the sum effect of gamma rays. The analysis software was Gamma Studio. Untreated stream water was put into 2-L Marinelli beakers for measurements of total 134Cs and 137Cs concentrations. After measurement, the 2-L water samples were filtered with a glass fiber filter (Whatman GF/F, 0.7 μm) and radioactive Cs concentrations in the filtered stream water were measured to determine dissolved radioactive Cs concentrations. Each sample had a different measurement time and detection limit. The measurement time ranged from 15,000 to 172,800 sec, and the detection limit was 0.03 Bq L−1 at a measurement time of 172,800 sec. The counting errors were between 3 and 8%. All reported radioactive Cs concentrations were corrected for physical decay from the sampled date. The measured radioactivity is probably slightly overestimated because of uneven distribution of radionuclides in the beakers of untreated water in which dissolved and suspended fractions were mixed. We think that the influence of uneven distribution is restrictive in this study because the measurement time decreased as the radioactive Cs concentration increased. The SS on the filter was dried at 105°C for 2 h. Electrical conductivity (EC) in stream water was measured as an indicator of water quality.
2.4 Procedure for calculation of radioactive Cs export during storm event
To separate the hydrograph, we used the Hewlett and Hibbert (Citation1967) method, as shown in . This procedure has been widely used in research in Japan and elsewhere (e.g., Yusop et al. Citation2006; Chiwa et al. Citation2010). The radioactive Cs export was calculated on an hourly time interval. At times when there was no stream water sampling during direct runoff (06:00–07:00 and 08:00–17:00 on June 20), total 134Cs and 137Cs concentrations were estimated by linear interpolation. Export of radioactive Cs was calculated as the product of runoff and concentration every hour during direct runoff.
Figure 2 Hydrograph separation procedure. Direct runoff was defined as cumulated runoff, colored with dark gray in the figure.
3 RESULTS AND DISCUSSION
3.1 Hydrological observations
The largest rainfall event during 2012 occurred on June 19–20 and had a recorded precipitation of 168 mm. The storm lasted for 17 h, from 10:00 on June 19 to 03:00 on June 20, and the average storm intensity was 9.9 mm h−1. The maximum hourly rainfall and peak runoff, observed between 00:00 and 01:00 on 20 June, were 34 mm h−1 and 12.1 mm h−1, respectively. Direct runoff over a 26-h period (from 15:00 on June 19 to 17:00 on June 20) was 81 mm, while the direct runoff ratio was 48%. EC was 5.0 mS m−1 before the storm started, and remained constant at almost the same level for several hours after the storm started. When the rainfall intensity increased (16:00, June 19), runoff increased and EC decreased dramatically. The minimum value of EC was recorded at peak runoff (3.0 mS m−1), and, as is considered normal in storm events, EC gradually increased again as runoff decreased. We used the variation in EC to divide the storm into three stages: the initial stage of the storm (Stage 1), the rising limb of the hydrograph (Stage 2) and the receding limb (Stage 3) ().
Figure 3 Temporal variation in (a) rainfall, (b) runoff and EC, (c) 137Cs concentration, (d) SS concentration and (e) turbidity during the typhoon storm event on June 19–20, 2012. “S” and “E” represent the start and end time of direct runoff. N.D. represents :“Not detectable”. *Detection limit was 0.05 Bq L−1 for the sample obtained at 09:30 on June 19.
3.2 Temporal variation in radioactive Cs, SS concentrations and turbidity
Radioactive Cs and SS concentrations and turbidity appeared to follow similar trends through the storm event (–). The total 137Cs concentrations in stream water during base flow on May 24 and June 13 were 0.09 Bq L−1 and 0.08 Bq L−1, respectively. The total 137Cs concentration in stream water was ND (below 0.05 Bq L−1) at 09:30 on June 19 before the storm event, but was almost 0.10 Bq L−1 during Stage 1 (results from samples collected at 11:30 and 13:26 on June 19). SS concentrations were also low (0.7 mg L−1 on June 13) at base flow and remained low (1–5 mg L−1) during Stage 1. Turbidity was below 1 NTU until 11:00 on June 19. Total 137Cs and SS concentrations increased in Stage 2. Elevated values of turbidity, ranging from 40 to 70 NTU, were also recorded during Stage 2, while, through the most intense rainfall, turbidity ranged from 40 to 60 NTU. When peak runoff and highest rainfall intensity were recorded, the maximum concentrations of total 137Cs (2.4 Bq L−1; that of 134Cs was 1.5 Bq L−1) and SS (136 mg L−1) were observed at 00:26 on June 20. Although runoff was still comparatively high immediately after the storm, total 137Cs and SS concentrations and turbidity dropped quickly during Stage 3. For example, the total 137Cs concentration was below 0.1 Bq L−1, and the SS concentration dropped to 5 mg L−1, by 04:29 on June 20, 1.5 h after the storm ended. By 06:00 on June 20, turbidity had fallen to 5 NTU, and remained low, suggesting that linear interpolation used to estimate radioactive Cs concentrations was almost appropriate. Several hours after the end of the storm, total 137Cs and SS concentrations and turbidity were almost the same as they were before the storm.
Dissolved 137Cs concentration was less variable than total 137Cs concentration through the storm event. The dissolved 137Cs concentration was 0.05 Bq L−1 in base flow conditions on May 24, 2012, and represented 62% of the total 137Cs concentration. Dissolved 137Cs concentration was below the detection limit (0.05 Bq L−1) on June 13, 2012. Dissolved 137Cs concentration represented 10% of the total 137Cs concentration from 15:00 to 19:00 on June 19. The peak dissolved 137Cs concentration (0.09 Bq L−1), total 137Cs and SS concentrations occurred at the same time. Throughout the high rainfall intensity (more than 9 mm h−1) from 19:00 on June 19 to 02:00 on June 20, the contribution of dissolved 137Cs concentration to total 137Cs concentration fell (3–8%), while runoff, total 137Cs and SS concentrations remained high (–). During Stage 3, the dissolved 137Cs concentration decreased gradually to 0.04 Bq L−1 at 09:29 on June 21, while the proportion of dissolved 137Cs concentration to total 137Cs concentration increased from 4 to 50%. At 09:29 on June 21, dissolved 137Cs concentration represented 88% of total 137Cs concentration, the highest recorded during this storm. By this time, runoff had returned to base flow. The temporal variations in total and dissolved 134Cs concentrations during the storm event are not shown because the variation patterns of total and dissolved 134Cs concentrations during the storm event are the same as those of the 137Cs concentration.
3.3 Radioactive Cs dynamics in stream water in forested headwaters
The radioactive Cs concentration increased dramatically during the storm event. Assuming that the total 137Cs concentration at base flow was 0.08 Bq L−1 (average from sampling on May 24 and June 13 and 29), the maximum total 137Cs concentration measured in the storm was 30 times larger than at base flow. – showed that total 137Cs and SS concentrations and turbidity were elevated on the rising limb and decreased rapidly on the receding limb. Other studies have also reported rapid decreases in SS on the receding limb (e.g., Zhang et al. Citation2007). Dissolved radioactive Cs concentration was very low during this storm event, especially on the rising limb; similar results have been reported for other studies (Matsunaga et al. Citation1991; Ueda et al. Citation2013). Its contribution to total radioactive Cs was less than 10% on the rising limb of this storm event. Results suggest that radioactive Cs was transported mainly in the particulate form on the rising limb of the hydrograph during the typhoon storm event.
3.4 Discharge ratio of radioactive Cs through stream water
Exports of 134Cs and 137Cs in direct runoff were 43 and 72 Bq m−2, respectively. The total radioactive Cs export during this storm event was 115 Bq m−2. This represented 0.07% of the total deposition density of radioactive Cs around the study site, 180 kBq m−2 as of June 28 2012. The discharge ratio of radioactive Cs was extremely low even though the typhoon storm event. Another storm occurred in the study catchment on May 3, 2012, during which the total rainfall was 158 mm. Total rainfall of the May 3 storm was almost equal to that of this storm, but direct runoff (114 mm) and direct runoff ratio (72%) were slightly higher. The total radioactive Cs export was approximately 150 Bq m−2, with the result that the discharge ratio to total deposition was almost 0.1% (Shinomiya et al. Citation2013). This value (150 Bq m−2) may be slightly overestimated because the function giving a larger value was selected in estimating radioactive Cs concentration from turbidity. The fact that radioactive Cs exports in this storm event were very similar to those reported for another storm of almost the same scale suggests that the calculations of radioactive Cs discharge in this study are reliable. The IAEA (Citation2006) reported that the net export of 137Cs from forest ecosystems was less than 1%. Ueda et al. (Citation2013) estimated that two rivers in the Fukushima Prefecture that were contaminated by the FDNPP accident had annual radioactive Cs discharge ratios of 0.3 and 0.5% in 2011. Therefore, the discharge of radioactive Cs through the typhoon storm event in this study was not greater than those reported for previous studies, which perhaps may be explained by vegetation and soil type. For example, Nylén and Grip (Citation1997) reported that radioactive Cs is more likely to be discharged from a mire than from a forest surrounding a mire. Calmon et al. (Citation2009) indicated that the aggregated transfer factor (Tag) tended to be larger in hydromorphic soils than in automorphic soils. However, there are no hydromorphic forest soils in our catchment. On the other hand, despite the steep slopes and high rainfall, erosion in the topsoil of forested land is limited because of protection from vegetation and the organic layer on the forest floor. Results show that radioactive Cs exports from forested headwaters were extremely low, despite the typhoon storm event.
After the FDNPP disaster, two large storms occurred in Koriyama on July 28–29 and September 20–21, 2011; rainfall in these storms was 73 and 240 mm, respectively (AMeDAS). Nylén and Grip (Citation1997) reported that 6.8% of the radioactive Cs deposition was lost about a month after the Chernobyl accident. Unfortunately, the storms in 2011 were not monitored, so we have no information about the resultant radioactive Cs exports; there may have been elevated radioactive Cs exports shortly after the nuclear disaster.
4 CONCLUSION
Radioactive Cs exports are mainly in the particulate form on the rising limb during the typhoon storm event. Our findings in this study, that radioactive Cs export in this storm event was very small, were totally consistent with the previous report (Shinomiya et al. Citation2013). Therefore, we concluded that discharge of radioactive Cs from forested headwaters was negligible, even though typhoon storms. Information collected on radioactive Cs dynamics in stream water from forested headwaters during flood events will contribute to an improved understanding of radioactive Cs and sediment transport in rivers, reservoirs or the sea in the future.
ACKNOWLEDGMENTS
The authors wish to thank Dr. Masamichi Takahashi, Dr. Akio Akama, Dr. Shinji Kaneko, Dr. Shigeto Ikeda, Dr. Satoru Miura and Dr. Kenji Ono (Forestry and Forest Product Research Institute) and the staff of the Fukushima Prefectural Forestry Research Center for valuable advice and support. This research was supported by the contract research project “Development of Radioactive Materials Removal and Reduction Technology for Forests and Farmland” of the Agriculture, Forestry and Fisheries Research Council, Ministry of Agriculture, Forestry and Fisheries.
REFERENCES
- Burrough PA, Van Der Perk M, Howard BJ, Prister BS, Sansone U, Voitsekhovitch OV 1999: Environmental mobility of radiocaesium in the Pripyat catchment, Ukraine/Belarus. Water Air Soil Pollut, 110, 35–55. doi:10.1023/A:1005028729330
- Calmon P, Thiry Y, Zibold G, Rantavaara A, Fesenko S 2009: Transfer parameter values in temperate forest ecosystems: a review. J Environ. Radioactivity, 100, 757–766. doi:10.1016/j.jenvrad.2008.11.005
- Chiwa M, Ide J, Maruno R, Higashi N, Otsuki K. 2010: Effects of storm flow samplings on the evaluation of inorganic nitrogen and sulfate budgets in a small forested watershed. Hydrol. Processes, 24, 631–640. doi:10.1002/hyp.7557
- FA (Forestry Agency) 2011: The result of empirical nuclear decontamination experiment in forest (Removal of vegetation and litter on forest floor) http://www.rinya.maff.go.jp/j/press/hozen/111227_1.html (September, 2013) (Japanese). * The title is tentative translation from the original Japanese title by the authors of this paper.
- Forest Soil Division 1976: Classification of forest soils in Japan (1975). Bulletin of the Goverment Forest Experiment Station, 280, 1–28. (Japanese with English summary).
- Hattori S, Shimizu T, Araki M, Kosugi K, Takeuchi I 2001: The present situation of the study on forest’s headwater conservation function and how to maintain and improve it’s function (I) The survey report on the maintainable guideline of forest, at the upper river region in water famine. Water Science, 260, 1–40 (Japanese).
- Hewlett JD, Hibbert AR 1967: Factors affecting the response of small watersheds to precipitation in humid areas. In: Proceedings of the International Symposium on Forest Hydrology, Eds. Sopper WE, Lull HW pp. 275–290. Pergamon, Oxford.
- IAEA (International Atomic Energy Agency) 2006: Environmental Consequences of the Chernobyl Accident and their Remediation: Twenty Years of Experience. Reports of the Chernobyl Forum Experts Group ‘Environment’, Radiological Assessment Reports Series (2006).
- JMA (Japan Meteorological Agency) 2013: Statistics Weather Information. http://www.data.jma.go.jp/obd/stats/etrn/index.php (July, 2013).
- Matsunaga T, Amano H, Yanase N 1991: Discharge of dissolved and particulate 137Cs in the Kuji River, Japan. Appl. Geochem., 6, 159–167. doi:10.1016/0883-2927(91)90026-L
- MEXT(Ministry of Education, Culture, Sports, Science and Technology) 2012: Results of Deposition of Radioactive Cesium of the Fifth Airborne Monitoring Survey and Airborne Monitoring Survey Outside 80 km from the Fukushima Dai-ichi NPP. https://mapdb.jaea.go.jp/mapdb/?prefectures=00&category_b=b301&year=2011%2C2012%2C2013 (May, 2014).
- Nylén T, Grip H 1997: The origin and dynamics of 137Cs discharge from a coniferous forest catchment. J. Hydrol., 192, 338–354. doi:10.1016/S0022-1694(96)03083-1
- Ohte N, Murakami M, Suzuki T, Iseda K, Tanoi K, Ishii N 2013: 16. Diffusion and transportation dynamics of 137Cs deposited on the forested area in Fukushima after the Fukushima daiichi nuclear power plant accident in March 2011. In:Agricultural Implications of the Fukushima Nuclear Accident. Ed. Nakanishi TM, Tanoi K pp. 177–186. Springer, Japan, Tokyo.
- Sansone U, Belli M, Voitsekovitch OV, Kanivets VV 1996: 137Cs and 90Sr in water and suspended particulate matter of the Dnieper River-Reservoirs System (Ukraine). Sci. Total Environ. 186, 257–271. doi:10.1016/0048-9697(96)05120-0
- Shinomiya Y, Tamai K, Kobayashi M, Ohnuki Y, Shimizu T, Iida S, Nobuhiro T, Sawano S, Tsuboyama Y, Hiruta T 2013: The behavior of radioactive materials in stream water from a forested watershed. Kanto J. For. Res. 64(2), 53–56. (Japanese with English summary).
- Ueda S, Hasegawa H, Kakiuchi H, Akata N, Ohtsuka Y, Hisamatsu S 2013: Fluvial discharges of radiocaesium from watersheds contaminated by the Fukushima Dai-ichi Nuclear Power Plant accident, Japan. J. Environ. Radioactivity, 118, 96–104. doi:10.1016/j.jenvrad.2012.11.009
- Wilflinger T, Lettner H, Hubmer AK, Hofmann W 2005: Radiocaesium in flowing waters of highly contaminated Austrian alpine areas. J. Environ. Radioactivity, 83, 75–89. doi:10.1016/j.jenvrad.2005.02.014
- Yamaguchi N, Takata Y, Hayashi K et al. 2012: Behavior of radiocaesium in soil-plant systems and its controlling factor: A review. Bull. Natl. Inst. Agro Environ. Sci. 31, 75–129. (Japanese with English summary).
- Yusop Z, Douglas I, Nik AR 2006: Export of dissolved and undissolved nutrients from forested catchments in Peninsular Malaysia. For. Ecol. Manag. 224, 26–44. doi:10.1016/j.foreco.2005.12.006
- Zhang Z, Fukushima T, Onda Y, Gomi T., Fukuyama T, Sidle R., Kosugi K, Matsushige K 2007: Nutrient runoff from forested watersheds in central Japan during typhoon storms: implications for understanding runoff mechanisms during storm events. Hydrol. Processes, 21, 1167–1178. doi:10.1002/hyp.6677