
Abstract
Humic substances are ubiquitous in the environment. The development of models for their chemical structure can be expected to improve our understanding of their environmental behavior. In this study, we used X-ray diffraction (XRD) to develop models for the stacking nanostructure of 12 humic acids (HAs) extracted from Japanese Andisols, Inceptisols and Entisols. In the XRD profiles of the HAs, the γ band, which was attributed to aliphatic side chains, and the 002 band were separated by means of curve fitting with the Voigt function. The interlayer spacing of the carbon (C) planes (d002) and the mean thickness of the stacking nanostructure along the c axis (Lc) were calculated from the position of the peak for the 002 band and the full width at half maximum by means of Bragg’s and Scherrer’s equations, respectively. The average number of C planes in the stacking nanostructure (Nc) was estimated from d002 and Lc. The Lc and Nc values ranged from 1.04 to 1.84 nm and from 3.01 to 5.40, respectively. The mean Lc and Nc values of the Andisol HAs were larger than those of the Inceptisol and Entisol HAs (P < 0.01). The d002 value of the HAs was approximately 0.34 nm, which was slightly larger than that of graphite (0.335 nm). The Lc value positively correlated with aromatic C content (r = 0.938, P < 0.01) and negatively correlated with the sum of alkyl C and O-alkyl C contents (r = − 0.958, P < 0.01), which were estimated from the liquid-state carbon-13 (13C) nuclear magnetic resonance spectra. Furthermore, the degree of darkness of the HAs positively correlated with Lc (r = 0.961, P < 0.01). Analysis of the 002 band of the XRD profile clarified the number of C planes in the stacking nanostructure and the thickness of the stacking layer unit of the HAs. Our results indicate that the accumulation of polynuclear aromatic C with stacking nanostructures contributed to the darkening of HAs in soil.
1. INTRODUCTION
Humic substances are dark heterogeneous mixtures of structurally complex, high-molecular-weight aromatic and aliphatic components, bearing many acidic functional groups with various pKa values and having a wide molecular weight distribution (Yonebayashi Citation1997). Humic substances, which are the major constituents of organic matter in soil, sediment and water, are believed to be biochemically and chemically synthesized in the environment from biomass constituents and their metabolites (Stevenson Citation1994). Humic substances can be operationally divided into three main fractions according to their solubility in acid and alkali: fulvic acids (alkali- and acid-soluble fraction), humic acids (HAs; alkali-soluble and acid-insoluble fraction), and humin (alkali- and acid-insoluble fraction).
The progress of humification is evaluated on the basis of increases in the degree of darkness, particularly for HAs (Watanabe and Takada Citation2006). Among Japanese soil HAs, those of Andisol show the highest degree of darkness (Kumada Citation1987). The degree of darkness of HAs increases with increasing aromatic carbon (C) content (including aromatic C in condensed aromatic components), with increasing carboxyl group content, and with decreasing O-alkyl C and alkyl C content (Yonebayashi and Hattori Citation1988; Watanabe and Takada Citation2006; Ikeya et al. Citation2007). As darkening progresses, HAs become more structurally stable and thus highly resistant to biodegradation (Yanagi et al. Citation2003), and their residence time exceeds 10,000 years (Yamada Citation1986). Stacking nanostructures with layered condensed aromatic components are necessary for the dark color of Japanese Andisol HAs (Tsutsuki Citation2005), and such structures may contribute to the resistance of HAs to microbes.
The use of X-ray diffraction (XRD) to analyze the stacking nanostructure of humic substances has a long history; XRD profiles of fulvic acids and HAs were measured in the late 1950s (Kobo and Tatsukawa Citation1959). HAs have turbostratic structure, as indicated by the 002 band at around 25° and the 10 band at around 42° in the XRD profile of soil HAs (Yamane et al. Citation1978). The 002 band provides information about the degree of stacking of C-layer planes and the distance between C-layer planes (Iwashita et al. Citation2004). Furthermore, the 11 band at around 80°, which is derived from the C planes in the turbostratic structure, has been observed in the XRD profile of soil HAs (Ikeya et al. Citation2011). Turbostratic carbon structure is built up from randomly stacked C planes. Calculation of the diffraction patterns in terms of the random stacking networks model shows 00l-type reflections with a symmetric peak (e.g., the 002 band) and hk-type reflections with an asymmetric peak (e.g., the 10 and 11 bands), which are characteristic of stacking structure and C-layer plane structure, respectively, in turbostratic carbon structure (Reshetenko et al. Citation2003). Carbon black is a typical turbostratic carbon structure.
Several previous structural analyses of soil HAs by means of XRD have been published (Matsui et al. Citation1984; Schnitzer et al. Citation1991; Xing and Chen Citation1999; Ikeya et al. Citation2011). Ikeya et al. (Citation2011) analyzed the 11 band, and their analysis indicated that the size of the condensed aromatic rings along the a axis (La) in HAs ranges from 0.48 to 1.68 nm, corresponding to condensed aromatic components with four to 37 rings. Xing and Chen (Citation1999) suggested that HAs have stacking structure, as indicated by the presence of 002 bands at around 25° and 10 bands at around 42° in their XRD profiles. Another peak has been detected at around 20° (γ band; distance between two adjacent layers, 0.43 nm) in the XRD profile of HAs, and this peak has been attributed to aliphatic compounds or lignin (Matsui et al. Citation1984; Schnitzer et al. Citation1991; Xing and Chen Citation1999). Schnitzer et al. (Citation1991) separated the 002 and γ bands by curve fitting and calculated HA aromaticity from the areas of the two peaks. Fourier transform analysis of the 002 band by Matsui et al. (Citation1984) indicated that stacked structures are present in darkly colored Andisol HAs, but the method used is applicable only to Andisol HAs and not to the other soil HAs, because the γ band interferes with the 002 band. Therefore, the stacking nanostructures of HAs from soils other than Andisols have not been determined. Development of models for the chemical structure of humic substances, including HAs, would improve our understanding of their behavior in the environment.
In the present study, we used XRD analysis to evaluate the turbostratic structure of Andisol, Inceptisol and Entisol HAs (12 soil samples in total) using a new method involving waveform separation. We analyzed the relationship between the stacking nanostructure properties of the HAs and their chemical structure properties, which were determined by carbon-13 (13C) nuclear magnetic resonance (NMR) spectroscopy.
2. MATERIALS AND METHODS
2.1. Samples
We collected samples of six Andisols, three Entisols and three Inceptisols from various regions in Japan (). The soil samples were air-dried and passed through a 2-mm-mesh sieve. Fine roots and litter were removed from the sieved samples with tweezers. To obtain humus extracts, an extractant [1:1 mixture of aqueous 0.1 mol L−1 sodium hydroxide (NaOH) and 0.1 mol L−1 sodium diphosphate (Na4P2O7)] was added to each soil sample at a concentration of 300 mL per g soil C, and the resulting suspension was allowed to stand for 24 h at 25°C under a nitrogen (N2) atmosphere with intermittent shaking. HAs were purified from the humus extracts by means of a previously described method (Yonebayashi and Hattori Citation1988). Carbon black (lot no. MKBN7009V, Sigma-Aldrich Japan, Tokyo, Japan) and lignin (lot no. M2P4239, Nacalai Tesque, Kyoto, Japan) were used as reference samples.
Table 1 Characteristics of soil humic acids used in this study.
2.2. Characterization of HAs
The elemental compositions of the HAs (%C, %Hydrogen, and %Nitrogen) were determined with an elemental analyzer (2400 II, Perkin-Elmer Japan, Yokohama, Japan); %Oxygen was calculated by subtracting (%C + %H + %N + %ash) from 100%. The elemental compositions are expressed as H/C, O/C, and O/H atomic ratios, to clarify the stoichiometric relationships between the elements.
The degree of darkness (A600/C, where A600 is the absorbance at 600 nm and C is the organic C concentration in milligrams of C per milliliter) of the HAs was determined according to the method of Ikeya and Watanabe (Citation2003). The absorbance at 600 nm of HAs dissolved in alkali was measured with a UV-vis spectrophotometer (UVmini-1240, Shimadzu) within 2 h after dissolution. Organic C concentration was determined with a total organic carbon analyzer (TOC-VCSH, Shimadzu, Kyoto, Japan).
Liquid-state 13C NMR spectra were recorded at 100.5 MHZ on a JEOL ECX 400 spectrometer (JEOL, Tokyo, Japan). Each HA (50 mg) was dissolved in 0.5 mL of 0.5 mol L−1 Sodium deuteroxide (NaDO) in deuterium oxide (D2O) in a 5-mm-diameter sample tube. Chemical shifts were referenced to sodium 3-trimethylsilylpropionate-2,2,3,3-D4 (0 ppm). To quantify the 13C NMR spectra, 13C signals were proton-decoupled by means of the inverse-gated decoupling technique under the following operating conditions: pulse width, 4.9 μs (45°); acquisition time, 1.04 s; pulse delay, 2.5 s. A total of 15,000 to 20,000 scans were accumulated, and line broadening was set at 50 Hz. Resonance areas were calculated by means of electronic integration. The spectra were divided into the following six regions (Fujitake and Kawahigashi Citation1999): alkyl C, 0–48 ppm; O-alkyl C, 48–110 ppm; aryl C, 110–145 ppm; O-aryl C, 145–165 ppm; carboxylic C, 165–190 ppm; and carbonyl C, 190–230 ppm. Aromaticity as determined by NMR (fa-NMR) was given by the ratio of (aryl C+O-aryl C) to (alkyl C+O-alkyl C + aryl C+O-aryl C) (Watanabe and Fujitake Citation2008). The O-aryl C content was very small and was classified as aromatic C, along with aryl C (110–165 ppm).
2.3. Analysis of the 002 band of the XRD profile
Forty to fifty milligrams of each sample (freeze-dried HA, carbon black or lignin) was packed into a 0.2-mm-deep hole on a nonreflecting silicon holder, and XRD patterns were measured with a diffractometer (MiniFlex, Rigaku, Tokyo, Japan) with copper (Cu) Kα radiation (wavelength, 0.154 nm). The generator was set at 30 kV and 15 mA. Samples were scanned over a 2θ range from 5 to 90° with a step size of 0.1° and a scanning speed of 2° min−1. Aburahi HAs (sample designation SA, ) were analyzed in triplicate to estimate the experimental error, whereas a single data set was obtained for the other soil HAs. The XRD profiles were corrected with the Lorentz factor, the polarization factor and the adsorption factor (Iwashita et al. Citation2004). After those corrections, the smoothing treatment was done using a weighted mean method (smoothing number, 11). The areas covering the 2θ range from 5 to 60° were separated into four peaks by calculation of the second derivative and comparison of the profiles of the reference and HA samples, and least-squares iterative curve fitting was carried out with the Voigt function using PeakFit (ver. 4.12, SeaSolve Software Inc., Framingham, MA, USA). The peak positions, widths and areas were determined. The validity of the profile fitting can be evaluated from the R-factor, which is defined as follows:
where I(2θ) is the experimentally observed intensity profile, and Pr(2θ) is the intensity profile fitted by calculation. The value of the R-factor should be as small as possible. The spacing between C planes (d002) in the HAs was calculated from the position of the peak for the separated 002 band by means of Bragg’s equation:
where λ is the wavelength of the X-rays in nanometers (0.154 nm for Cu Kα), and θ is Bragg’s angle at a diffraction line. The mean thickness of the stacking nanostructure along the c axis (Lc) was calculated from the full width at half maximum and the position of the peak for the 002 band by means of Scherrer’s equation (Iwashita et al. Citation2004):
where β is the full width at half maximum of the 002 band, and K is Scherrer’s constant (0.91). The average number of C planes in the stacking nanostructure (Nc) was estimated from d002 and Lc by means of the following equation:
2.4. Statistical analysis
When one-way analysis of variance (ANOVA), which was used to evaluate the significance of differences among variables, indicated a significant difference, mean comparisons were performed with Tukey’s honestly significant difference test. All statistical analyses were carried out with IBM SPSS Statistics 21 (IBM Corporation, Armonk, NY, USA).
3. RESULTS AND DISCUSSION
3.1. Characterization of HAs
The elemental compositions and optical properties of the HAs are shown in . The A600/C values and atomic ratios of all the HAs were within the range of commonly accepted values for soil HAs (Ikeya and Watanabe Citation2003; Kuwatsuka et al. Citation1978; Yonebayashi and Hattori Citation1988). The average H/C ratio of the Andisol HAs was significantly lower than that of the Inceptisol and Entisol HAs, whereas the average O/H ratio and the average A600/C value of the Andisol HAs were significantly higher than those of the Inceptisol and Entisol HAs. Increases in A600/C are generally attributed to increases in the degree of humification of HAs, and decreases in H/C are ascribed to increases in the unsaturated bond content of HAs (Yonebayashi and Hattori Citation1988).
The peaks in the liquid-state 13C NMR spectra of the HAs () were assigned according to the reports of Fujitake and Kawahigashi (Citation1999), Kögel-Knabner (Citation1997), and Schnitzer and Preston (Citation1986). The major peaks appeared at around 32, 58, 72, 130, 150 and 170 ppm. The peak at 32 ppm was attributed to methylene C in long-chain aliphatic compounds, such as lipids, suberin and cutin; the peak at 58 ppm was assigned to lignin-derived methoxyl C; and the peak at 72 ppm was ascribed to polysaccharides. The peaks at 130 and 150 ppm were attributed to C-substituted and H-substituted aromatic C and phenolic C, respectively. The peak at 170 ppm was assigned to carboxyl C. Methylene C was the dominant peak in the spectra of the Inceptisol and Entisol HAs. Methoxyl C and phenolic C were observed clearly in the spectra of the Inceptisol and Entisol HAs, which suggests that those HAs contained altered lignin-like structure. In contrast, aromatic C and carboxyl C were the dominant peaks in the spectra of the Andisol HAs, and the peaks for methylene C, methoxyl C and polysaccharides were minor peaks.
Figure 1 Carbon-13 (13C) nuclear magnetic resonance (NMR) spectra of humic acids (HAs).
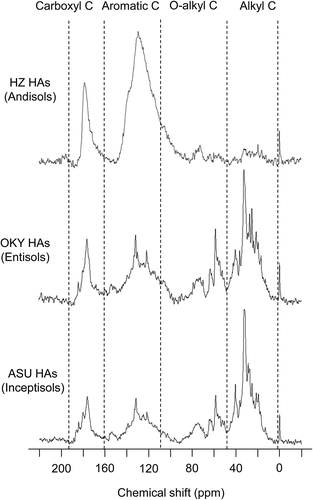
The relative contents of the various functional groups were determined by integrating over the standard chemical shift range (). In the Andisol HAs, the major C species were aromatic C (aryl C + O-aryl C; 37.1–63.9% of total intensity). The aromatic C content and aromaticity of the Andisol HAs were significantly higher than those of the Inceptisol and Entisol HAs (P < 0.01). The aromatic C of Andisol HAs consists mainly of C in condensed aromatic components (Ikeya et al. Citation2004, Citation2007; Kramer et al. Citation2004). In the Andisol HAs, alkyl C contributed < 20% of the total intensity. In contrast, alkyl C and O-alkyl C in the Inceptisol and Entisol HAs were the major C species (alkyl C, 33.5–43.1% of total intensity; O-alkyl C, 20.8–28.9% of total intensity). Aromatic C content was strongly positively correlated with A600/C (r = 0.978, P < 0.01) and negatively correlated with H/C (r = –0.982, P < 0.01). These results indicate that aromatic C was responsible for the dark color of the HAs.
Table 2 Distribution of carbon (C) species and aromaticity estimated by carbon-13 (13C) nuclear magnetic resonance (NMR).
3.2. XRD profiles of HAs and related substances
The XRD profiles of HAs and related substances are shown in . The XRD profile of carbon black exhibited four peaks, at 26, 42, 54 and 80°, which were assigned to the 002, 10, 004 and 11 bands, respectively. The XRD profile of lignin showed a peak at 22°, two shoulders (at 32 and 42°) and a small peak at 80° (Matsui et al. Citation1984).
Figure 2 X-ray diffraction profiles of humic acids (HAs) and related substances.
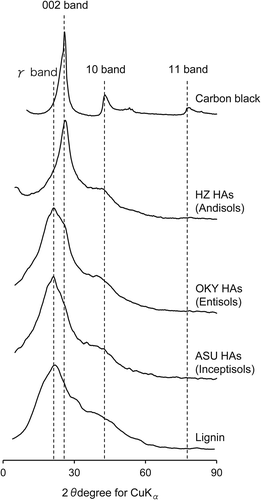
The XRD profiles of the HAs showed an asymmetric peak at 22–26°, a shoulder at 42° and a small peak at 80°, which were attributed to the 002, 10 and 11 bands, respectively (). The asymmetry of the peak at 22–26° suggests the coexistence of another band (the γ band) to the left of the 002 band. In the profiles of the Entisol and Inceptisol HAs in particular, the overlap of the 002 and γ bands markedly broadened the peak with a maximum at around 22°. Matsui et al. (Citation1984) and Schnitzer et al. (Citation1991) attributed the γ band at 22° to lignin or saturated compounds. In contrast, the shapes of the peaks for the Andisol HAs were similar to those of carbon black, suggesting that Andisol HAs have a chemical structure similar to that of carbon black. All the HAs, as well as carbon black, exhibited turbostratic structure, as indicated by the presence of the 002, 10 and 11 bands (Ikeya et al. Citation2011; Matsui et al. Citation1984). The 002 band of the Andisol HAs was sharper than the 002 bands of the Inceptisol and Entisol HAs, which indicates that, among the three types of HAs, the Andisol HAs had the most developed turbostratic structure.
3.3. Analysis of stacking nanostructure in HAs
The XRD profiles of the HAs after waveform separation are shown in . The R-factors were < 3 for all samples, confirming the accuracy of the fitting. The XRD profile of the HAs were separated into four peaks, at around 21, 25, 32 and 42°, which were attributed to the γ1, 002, γ2 and 10 bands, respectively. The peaks at around 21 and 32° were specific to the XRD profile of lignin and were thus not present in the XRD profile of carbon black (). Waveform separation allowed us to define the new peaks at around 21 and 32° as the γ1 and γ2 bands, respectively.
Figure 3 X-ray diffraction profiles of (a) HZ (Andisols), (b) OKY (Entisols), and (c) ASU (Inceptisols) humic acids after waveform separation.
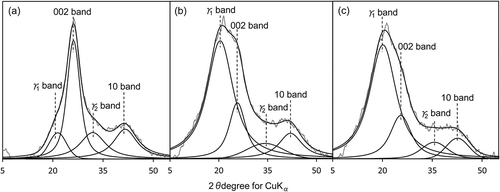
We investigated the relationship between the ratio of the area of each band to the sum of the areas of the γ1, 002 and γ2 bands and the relative contents of the various C species (calculated by integrating the standard chemical shift range in the 13C NMR spectra). The proportion of the γ1 band area (Aγ1) positively correlated with relative alkyl C content (r = 0.931, P < 0.01) and negatively correlated with relative aromatic C content (r = – 0.968, P < 0.01). Thus, we attributed the γ1 band to aliphatic components in the HAs. In contrast, there was no association between the proportion of the γ2 band area (Aγ2) and the relative contents of any of the C species. Because the 002 band was attributed to the spacing between the C planes, the proportion of the 002 band area (A002) positively correlated with aromatic C content (r = 0.872, P < 0.01) and negatively correlated with alkyl C content (r = − 0.884, P < 0.01).
The stacking nanostructure properties of the soil HAs estimated from the XRD 002 band are listed in . The relative standard deviation obtained from Aburahi HAs (n = 3) was ± 11.4% for the Aγ1/A002, ± 1.2% for Lc, ± 0.1% for the d002, ± 1.3% for the Nc and ± 2.8% for the fa-XRD, which exhibited low variability. The area ratios of the γ1 and 002 bands (Aγ1/A002) ranged from 0.24 to 5.95. The Aγ1/A002 ratios for the Andisol HAs were lower than those for the Inceptisol and Entisol HAs (P < 0.01). This result indicates that the Andisol HAs were richer in aromatic components and poorer in aliphatic components than the Inceptisol and Entisol HAs. In fact, Aγ1/A002 negatively correlated with aromatic C content (Spearman’s rank correlation test, ρ = – 0.923, P < 0.01) and positively correlated with H/C (Spearman’s rank correlation test, ρ = 0.853, P < 0.01). Therefore, Aγ1/A002 provides a good indication of the structural features of the HAs.
Table 3 Stacking structure properties of soil humic acids (HAs) estimated from the 002 band of the X-ray diffraction profile.
Theoretically, the areas of the 002 and γ1 bands are proportional to the number of aromatic C atoms (Car) and the number of aliphatic C atoms (Cal), respectively (Yen et al. Citation1961; Lu et al. Citation2000; Sonibare et al. Citation2010). According to Schnitzer et al. (Citation1991) and Lu et al. (Citation2000), the aromaticity determined by XRD (fa-XRD) can be expressed by the following equation using the separated peak areas of the XRD profile:
Aromaticities calculated from XRD and 13C NMR ranged from 0.14 to 0.81 and from 0.24 to 0.76, respectively, and fa-XRD was highly correlated with fa-NMR (r = 0.958, P < 0.01). Linear regression analysis of the HA aromaticity data obtained by the two methods yielded the following equation:
The regression model explained 92% of the variability in fa-NMR, and fa-NMR can be estimated from fa-XRD. The slope of the regression equation (0.752) indicates that the aromaticity obtained by XRD was larger than that obtained by 13C NMR. The fa-XRD has often been used to characterize coal and carbon black (e.g., Lu et al. Citation2000), which are composed mainly of aromatic C and contain a small amount of aliphatic C. In contrast, HAs consist of aromatic C and aliphatic C as well as polysaccharides and lignin derivatives, as indicated by the 13C NMR spectra of the HAs, especially for the Inceptisol and Entisol HAs (). Therefore, the overestimation of aromaticity by means of XRD is due to the fact that C derived from polysaccharides and lignin derivatives is not included in the denominator of Eq. 5.
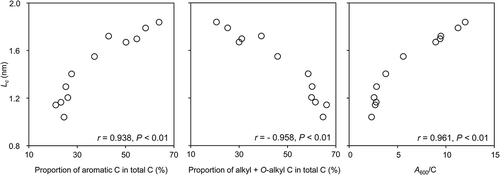
The d002 values of the HAs ranged from 0.340 to 0.349 nm () and were slightly larger than the value of graphite (0.335 nm). The d002 values of the HAs from the three soil orders did not differ substantially from one another. The Lc and Nc values ranged from 1.04 to 1.84 nm and from 3.01 to 5.40, respectively (). The Lc and Nc values of the Andisol HAs were higher than those of the Inceptisol and Entisol HAs (P < 0.01) but lower than the values of the carbon black used in this study (Lc, 2.70 nm; Nc, 8.86). Takagi et al. (Citation2004) reported Lc and Nc values for seven types of raw coal ranging from 0.71 to 1.89 nm and from 2.99 to 6.43, respectively. These results suggest that the degree of stacking nanostructure in the HAs we studied was in the same range as that in raw coal. We observed significant relationships between the proportions of the various carbon species and the stacking nanostructure properties measured by XRD (). The proportion of aromatic C positively correlated with Lc, whereas the sum of the alkyl C and O-alkyl C contents negatively correlated with Lc; furthermore, Lc positively correlated with A600/C (). These findings suggest that the formation and accumulation of building blocks containing layered C planes contribute to the darkening of HAs in soil. The presence of HAs with the highest degree of darkness is believed to be the reason for the darkness of Japanese Andisols (Iimura et al. Citation2013). Therefore, the presence of stacking nanostructures in HAs plays a role in the darkening of soils, especially for Japanese Andisols.
Figure 4 Relationships between mean stacked structure length along c axis (Lc) and proportion of aromatic carbon (C) (%), (alkyl C + O-alkyl C) (%), and degree of darkness (A600/C, where A600 is the absorbance at 600 nm and C is the organic C concentration in milligrams of C per milliliter).
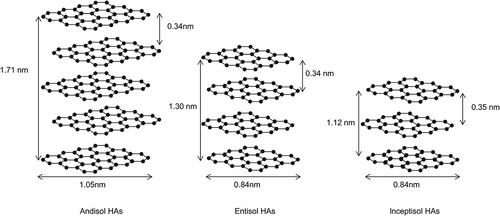
Ikeya et al. (Citation2011) reported that the average La values for Andisol HAs (n = 5) and Inceptisol HAs (n = 3) range from 0.80 to 0.96 nm and from 0.81 to 0.91 nm, respectively, and that the value for Entisol HAs (n = 1) is 0.86 nm. These results taken together with ours suggest that the average stacking nanostructure models shown in were present in the HAs analyzed in this study.
Figure 5 Proposed average stacking nanostructure models for humic acids (HAs) analyzed in the present study. These nanostructure models used theoretical values for the size of the condensed aromatic rings along the a axis La) and approximate value for the average number of C planes in the stacking nanostructure (Nc).
The process by which stacking nanostructures form in HAs is largely unknown. The La of Andisol HAs is larger than that of polynuclear quinones, such as dihydroxyperylenequinones in Type P HAs, produced by fungi (Kumada and Hurst Citation1967). Because the mean La of charred plant fragments in Andisols ranges from 1.26 to 1.37 nm (Sultana et al. Citation2010), they can be expected to contribute to condensed aromatic components in Japanese volcanic ash soils (Shindo et al. Citation2004). Fresh char contains very small amounts of HAs (Shindo and Honma Citation1998). However, partial degradation and oxidation of char are necessary to produce HAs with a high degree of darkness (Trompowsky et al. Citation2005). Furthermore, Nishimura et al. (Citation2006) extracted HAs with a high degree of darkness from charred plant fragments that had naturally oxidized in the field. The mean La values of HAs extracted from nitric acid and hydrogen peroxide-oxidized char are 1.29 and 1.05 nm, respectively (Sultana et al. Citation2011), and the mean La of the latter HAs is about the same as that of Andisol HAs. Moreover, we confirmed that the Lc of HAs is increased, from 1.29 to 1.67 nm, by heating soils at 250°C (Katsumi et al. Citation2014). Therefore, char and heating are likely to be important factors in the presence of turbostratic structures in HAs.
4. CONCLUSIONS
We proposed a new method for analysis of the stacking C structure of HAs using XRD. In the new method, the 002 band was separated from the interfering γ band. To compare the stacking nanostructures of HAs extracted from soils of three different orders (Andisols, Inceptisols and Entisols), we applied this method to several HAs from each soil order. The Lc and Nc values of the Andisol HAs were larger than those of the Inceptisol and Entisol HAs. In contrast, the d002 values of the HAs from the three soil orders did not differ substantially. The degree of darkness of HAs was correlated with Nc. These results indicate that accumulation of polynuclear aromatic C with stacked structures contributed to the darkening of HAs in soil. This method for analyzing the 002 band of the XRD profiles is a useful tool for estimating the stacking nanostructure of HAs and can be expected to be applicable to other organic materials containing such structures in the environment.
ORCID
Naoya Katsumi ![]() http://orcid.org/0000-0002-9340-4746
http://orcid.org/0000-0002-9340-4746
ACKNOWLEDGMENTS
We thank Dr. Nobuaki Ishida and Dr. Yuji Honda of Ishikawa Prefectural University for advice on optimization of the NMR conditions. We acknowledge an anonymous reviewer for valuable suggestions that greatly improved the manuscript, and Professor Nobuhide Fujitake for editorial support.
REFERENCES
- Fujitake N, Kawahigashi M 1999: 13C NMR spectra and elemental composition of fractions with different particle sizes from an Andosol humic acids. Soil Sci. Plant Nutr., 45, 359–366. doi:10.1080/00380768.1999.10409350
- Iimura Y, Fujimoto M, Tamura K, Higashi T, Kondo M, Uchida M, Yonebayashi K, Fujitake N 2013: Black humic acid dynamics during natural reforestation of Japanese pampas grass (Miscanthus sinensis). Soil Biol. Biochem., 57, 60–67. doi:10.1016/j.soilbio.2012.07.011
- Ikeya K, Hikage T, Arai S, Watanabe A 2011: Size distribution of condensed aromatic rings in various soil humic acids. Org. Geochem., 42, 55–61. doi:10.1016/j.orggeochem.2010.10.006
- Ikeya K, Ishida Y, Ohtani H, Yamamoto S, Watanabe A 2007: Analysis of polynuclear aromatic and aliphatic components in soil humic acids using ruthenium tetroxide oxidation. Eur. J. Soil Sci., 58, 1050–1061. doi:10.1111/j.1365-2389.2006.00884.x
- Ikeya K, Watanabe A 2003: Direct expression of an index for degree of humification of humic acids using organic carbon concentration. Soil Sci. Plant Nutr., 49, 47–53. doi:10.1080/00380768.2003.10409978
- Ikeya K, Yamamoto S, Watanabe A 2004: Semiquantitative GC/MS analysis of thermochemolysis products of soil humic acids with various degree of humification. Org. Geochem., 35, 583–594. doi:10.1016/j.orggeochem.2003.12.004
- Iwashita N, Park CR, Fujimoto H, Shiraishi M, Inagaki M 2004: Specification for a standard procedure of X-ray diffraction measurements on carbon materials. Carbon, 42, 701–714. doi:10.1016/j.carbon.2004.02.008
- Katsumi N, Yonebayashi K, Fujitake N, Okazaki M 2015: Relationship between stable carbon and nitrogen isotope ratios of humic acids extracted from Andisols and non-Andisols. Catema, 127, 214–221. doi:10.1016/j.catena.2015.01.005
- Katsumi N, Yonebayashi K, Okazaki M 2014: Effect of heating on humic substances: changes in composition, structure and degree of darkness with several heating conditions. 2014 Joint Seminar of NPUST and IPU for Environmental and Ecological Restoration, 30–34.
- Kobo K, Tatsukawa R 1959: On the colored material of fulvic acid. Zeitschrift für Pflanzenernährung, Düngung. Bodenkunde, 84, 137–147. doi:10.1002/jpln.19590840123
- Kögel-Knabner I 1997: 13C and 15N NMR spectroscopy as a tool in soil organic matter studies. Geoderma, 80, 243−270. doi:10.1016/S0016-7061(97)00055-4
- Kramer RW, Kujawinski EB, Hatcher PG 2004: Identification of black carbon derived structures in a volcanic ash soil humic acid by Fourier Transform Ion Cyclotron Resonance Mass Spectrometry. Environ. Sci. Technol., 38, 3387–3395. doi:10.1021/es030124m
- Kumada K 1987: Chemistry of Soil Organic Matter. Japan Scientific Societies Press, Tokyo; Elsevier Science Publishers, Amsterdam.
- Kumada K, Hurst M 1967: Green humic acid and its possible origin as a fungal metabolite. Nature, 214, 631–633. doi:10.1038/214631a0
- Kuwatsuka S, Tsutsuki K, Kumada K 1978: Chemical studies on soil humic acids. I. Elementary composition of humic acids. Soil Sci. Plant Nutr., 24, 337−347. doi:10.1080/00380768.1978.10433113
- Lu L, Sahajwalla V, Harris D 2000: Characteristics of chars prepared from various pulverized coals at different temperatures using drop-tube furnace. Energy Fuels, 14, 869–876. doi:10.1021/ef990236s
- Matsui Y, Kumada K, Shiraishi M 1984: An X-ray diffraction study of humic acids. Soil Sci. Plant Nutr., 30, 13–24. doi:10.1080/00380768.1984.10434664
- Nishimura S, Hirota T, Hirahara O, Shindo H 2006: Contribution of charred and buried plant fragments to humic and fulvic acids in Japanese volcanic ash soils. Soil Sci. Plant Nutr., 52, 686–690. doi:10.1111/j.1747-0765.2006.00086.x
- Reshetenko TV, Avdeeva LB, Ismagilov ZR, Pushkarev VV, Cherepanova SV, Chuvilin AL, Va L 2003: Catalytic filamentous carbon structural and textural properties. Carbon, 41, 1605–1615. doi:10.1016/S0008-6223(03)00115-5
- Schnitzer M, Kodama H, Ripmeester JA 1991: Determination of the aromaticity of humic substances by X-ray diffraction analysis. Soil Sci. Soc. Am. J., 55, 745–750.
- Schnitzer M, Preston CM 1986: Analysis of humic acids by solution and solid-state carbon-13 nuclear magnetic resonance. Soil Sci. Soc. Am. J., 50, 326–331.
- Shindo H, Honma H 1998: Comparison of humus composition of charred susuki (Eulalia, Miscanthus sinensis) plants before and after HNO3 treatment. Soil Sci. Plant Nutr., 44, 675–678. doi:10.1080/00380768.1998.10414491
- Shindo H, Honna T, Yamamoto S, Honma H 2004: Contribution of charred plant fragments to soil organic carbon in Japanese volcanic ash soils containing black humic acids. Org. Geochem., 35, 235–241. doi:10.1016/j.orggeochem.2003.11.001
- Sonibare OO, Haeger T, Foley SF 2010: Structural characterization of Nigerian coals by X-ray diffraction, Raman and FTIR spectroscopy. Energy, 35, 5347–5353. doi:10.1016/j.energy.2010.07.025
- Stevenson FJ 1994: Humus Chemistry: Genesis, Composition, Reactions. 2nd ed. John Wiley and Sons, New York.
- Sultana N, Ikeya K, Shindo H, Nishimura S, Watanabe A 2010: Structural properties of plant charred materials in Andosols as revealed by X-ray diffraction profile analysis. Soil Sci. Plant Nutr., 56, 793–799. doi:10.1111/j.1747-0765.2010.00520.x
- Sultana N, Ikeya K, Watanabe A 2011: Partial oxidation of char to enhance potential interaction with soil. Soil Sci., 176, 495–501. doi:10.1097/SS.0b013e318224743b
- Takagi H, Maruyama K, Yoshizawa N, Yamada Y, Sato Y 2004: XRD analysis of carbon stacking structure in coal during heat treatment. Fuel, 83, 2427–2433. doi:10.1016/j.fuel.2004.06.019
- Trompowsky PM, Benites VM, Madari BE, Pimenta AS, Hockaday WC, Hatcher PG 2005: Characterization of humic like substances obtained by chemical oxidation of eucalyptus charcoal. Org. Geochem., 36, 1480–1489. doi:10.1016/j.orggeochem.2005.08.001
- Tsutsuki K 2005: Soil organic matter. In Introductory Soil Science, Ed Saigusa M., Kimura M., 138–148. Buneido Publishing Co., Tokyo. (in Japanese)
- Watanabe A, Fujitake N 2008: Comparability of composition of carbon functional groups in humic acids between inverse-gated decoupling and cross polarization/magic angle spinning 13C nuclear magnetic resonance techniques. Anal. Chim. Acta, 618, 110–115. doi:10.1016/j.aca.2008.04.045
- Watanabe A, Takada H 2006: Structural stability and natural 13C abundance of humic acids in buried volcanic ash soils. Soil Sci. Plant Nutr., 52, 145−152. doi:10.1111/j.1747-0765.2006.00029.x
- Xing B, Chen Z 1999: Spectroscopic evidence for condensed domains in soil organic matter. Soil Sci., 164, 40–47. doi:10.1097/00010694-199901000-00006
- Yamada Y 1986: The characterization of humus accumulation in Andosols by 14C dating. Bull. Nat. Inst. Agro-Environ. Sci., 3, 23−86. (in Japanese with English summary).
- Yamane I, Matsui T, Irisawa S, Okazaki M, Hosono M 1978: Illustrated Soils of Japan. Asakura Publishing Co., Tokyo, Japan. (in Japanese).
- Yanagi Y, Hamaguchi S, Tamaki H, Suzuki T, Otsuka H, Fujitake N 2003: Relation of chemical properties of soil humic acids to decolorization by white rot fungus Coriolus consors. Soil Sci. Plant Nutr., 49, 201−206. doi:10.1080/00380768.2003.10409998
- Yen TF, Erdman JG, Pollack SS 1961: Investigation of the structure of petroleum asphaltene by X-ray diffraction. Anal. Chem., 33, 1587−1594. doi:10.1021/ac60179a039
- Yonebayashi K 1997: Soil organic matter. In Current Soil Science, Ed. Kyuma K, 43−53. Asakura Publishing Co., Tokyo, Japan. (in Japanese)
- Yonebayashi K, Hattori T 1988: Chemical and biological studies on environmental humic acids. I. composition of elemental and functional groups of humic acids. Soil Sci. Plant Nutr., 34, 571–584. doi:10.1080/00380768.1988.10416472