
ABSTRACT
Alternate wetting and drying (AWD) technique has been widely reported to reduce methane (CH4) emission from irrigated rice paddies. However, little is known about its feasibility in an environment that has distinct weather conditions involving tropical wet season (WS). To investigate the AWD’s feasibility in terms of reducing greenhouse gas (GHG) emissions both in dry season (DS) and WS, 3-year field experiments were conducted in Central Luzon, Philippines. Three treatments of water management were continuous flooding (CF), flooding when surface water level naturally declines to 15 cm below the soil surface (AWD), and site-specific AWD that modified the criteria of soil drying (AWDS). Methane and nitrous oxide (N2O) fluxes were measured using a closed chamber method, and the global warming potential (GWP) of the two GHGs was calculated. Rice grain yield did not significantly differ among treatments. In accordance with the previous findings, the seasonal total CH4 emission was significantly greater in WS than in DS. The effect of treatment was significant, but the reduction rate by AWD was just 1.7% compared to CF. The seasonal total N2O emission was significantly affected by cropping season and treatment. The AWD increased the N2O emission by 97%, especially in DS. The resultant GWP did not significantly differ among three treatments. The results indicate that the AWD and AWDS with the current settings were insufficient to reduce the annual GHG emissions in this site. However, fragmentary results obtained in the last DS suggest that an earlier rice residue incorporation and keeping dry soil conditions in the preceding fallow season is effective in reducing CH4 emission in combination with an earlier implementation of AWD.
1. Introduction
Rice is the most important staple food in the Philippines. The area harvested to rice is about 4.5 M ha, of which 2.7 M ha are irrigated (Moog Citation2005). Much of the country’s irrigated rice is grown in the Central Plain of Luzon – rice granary of the country, which accounts for 20% of the total national rice production as of 2015 (DA-Department of Agriculture Citation2016). In the typical irrigated rice cultivation, rice seedlings are transplanted in puddled and bunded fields which are continuously flooded throughout the growing season (Koidi et al. Citation2013). It is grown mostly with supplemental irrigation (e.g., using shallow tube well) when rainfall is not sufficient in the wet season (WS) whereas depends entirely on irrigation in the dry season (DS) (Bouman et al. Citation2007). With increasing population of the country with an average rate of 2% per annum (PhilRice-Philippine Rice Research Institute Citation2011), rice production is expected to move toward rice intensification in terms of (1) increased cropping per year, (2) use of high-input technologies (Corton et al. Citation2000), and (3) increased cropping intensity (i.e., the ratio of effective area harvested to the physical area). However, the trade-off result for rice intensification is the increase in greenhouse gas (GHG) emissions, especially methane (CH4) from flooded soils (Inubushi et al. Citation2001; Corton et al. Citation2000).
Several studies have shown that rice production from flooded soils enhanced the production of CH4 (e.g., Singh et al. Citation2003; Van Der Gon et al. Citation2002; Bharati et al. Citation2001). Flooding rice fields blocks oxygen penetration into the soil, which is favorable for CH4 production and emission especially in the tropics (Rath et al. Citation2000). Reduction in CH4 emissions from irrigated rice fields has been reported from multiple aeration of soil by alternate wetting and drying (AWD), single aeration in mid-season (Zou et al. Citation2005; Wassmann et al. Citation2000; Corton et al. Citation2000), and crop residue management (Sander et al. Citation2014; Yagi et al. Citation1997; Knoblauch et al. Citation2011). However, Wassmann et al. (Citation2004) reported a large fluctuation in CH4 emission reductions from 7% to 80% by modifying water management, and suggested number of constraints due to an inverse effect on nitrous oxide (N2O) emissions. The N2O is produced through soil microbial processes, such as nitrification and denitrification (Zou et al. Citation2005). Several studies showed that N2O fluxes increased with the timing of drainage period after nitrogen (N) fertilizer application, and with the rate of N applied (Ly et al. Citation2014; Sander et al. Citation2014; Corton et al. Citation2000). The trade-off relationship between CH4 and N2O emissions resulting from AWD or mid-season drainage in irrigated rice fields has also been well studied (Cai et al. Citation1997; Zou et al. Citation2005).
The Philippines has a tropical climate dominated by WS and DS. It is characterized by four climate types in terms of the relative duration and intensity of dry and wet periods. In most part of Luzon, the climate is very pronounced and distinct with the DS, which generally begins in November and ends in April. During WS, rainfall is heavy from May to October. Nelson et al. (Citation2015) reported in their modeling study that AWD would be feasible in WS in case of Cagayan, Philippines. Corton et al. (Citation2000) reported greater CH4 emissions in WS than in DS from a long-term field experiment in Central Luzon, Philippines. However, very little is known about the difference in the effect of AWD in reducing CH4 emissions between WS and DS in Central Luzon, Philippines.
Irrigated rice fields share many traits, and their contributions to CH4 and N2O emissions can differ markedly due to the variations in local temperatures, soil properties, crop management, and resultant rice growth (Rath et al. Citation2000; Chidthaisong et al. Citation1996). Therefore, the objectives of this field monitoring study were (1) to evaluate the feasibility of AWD in reducing CH4 emission during two distinct rice seasons in Central Luzon, Philippines, and (2) to determine a suitable water management for reducing CH4 and N2O emissions and saving water without compromising grain yields from irrigated rice fields in Muñoz, Nueva Ecija.
2. Materials and methods
2.1. Site description
Field experimental site was established at the Central Experiment Station (Block 6, Lot 5) of the Philippine Rice Research Institute located in Muñoz, Nueva Ecija, Philippines (15°40ʹ N, 120°53ʹ E) during three DSs (December–April) and three WSs (June–September) from 2014 to 2016. The province of Nueva Ecija is located at the Central Plain of Luzon. The climate is tropical with two distinct weather conditions, DS and WS, with mean annual rainfall of 1941 mm year−1, mean air temperature of 27.6°C, relative humidity of 82.4%, and solar radiation of 20.6 MJ m−2 day−1 (Lampayan et al. Citation2015). The study site is fully irrigated and planted twice a year. The source of irrigation comes from a shallow tube well nearby. The soil is classified as fine montmorillonitic, isohyperthermic Ustic Epiaquerts (USDA classification). It is derived from alluvium parent material and is poorly drained (Corton et al. Citation2000). shows the soil properties of the experimental site.
Table 1. Soil properties of the experimental site.
2.2. Experimental design
The experimental factor was water management with three treatments and four replications. A randomized block design was used to arrange the field layout with each plot of 6 m × 6 m. The treatments were (1) continuous flooding (CF), (2) safe AWD (AWD), and (3) site-specific AWD (AWDS). Hereafter, positive values of surface water level indicate water depth on the soil surface, whereas negative values indicate water depth below the soil surface. The plot for each treatment was fixed throughout the conduct of the study.
In CF, 1–5 cm surface water level was maintained until 1–2 weeks before harvest. Surface water level in AWD and AWDS was monitored using a preinstalled field water tube made of PVC pipe (Lampayan et al. Citation2015). When the water level was naturally declined to a threshold level, the plot was irrigated up to 5 cm. The threshold level of −15 cm has been identified as safe AWD as this will not cause any reduction in rice yield (Bouman et al. Citation2007). In AWD treatment, when the water level declined to −15 cm, the plot was irrigated up to 5 cm. The AWDS was tested in two different ways to examine the effects of soil drying strength on the reduction of CH4. In 2014, the AWDS was a single aeration as the mid-season drainage, where the surface water was drained for 7–10 days before rice panicle initiation. In 2015 and 2016, AWDS was so-called AWD at −25 cm, that is, the plot is irrigated when the water level declines to −25 cm. For 2014 and 2015, both AWD and AWDS were imposed 21 days after transplanting (DAT) based on the recommendation by Bouman et al. (Citation2007). However, in 2016DS, AWD and AWDS were started from 10 DAT to achieve drier soil condition. In all the three treatments, the plots were irrigated 3–5 cm water level just before N fertilizer application and during rice flowering stage to avoid spikelet sterility. The terminal drainage was conducted 1–2 weeks before harvest.
2.3. Crop management
Crop management practices followed the recommendations from the PalayCheck System®(PhilRice Citation2007) and summarized in Table S1. Before starting the field experiment, the field was tilled and rice stubbles were incorporated just after harvest of the previous crop as customary practice at PhilRice farm. The field was tilled again several weeks before transplanting for 2014DS to establish the new field layout. Bunds and canals were constructed in between plots, and plastic linings were installed along the bund at 40 cm depth in each plot to prevent water seepage between treatments. In the following seasons, rice stubbles from the previous crop (~40 cm height) were incorporated several weeks before transplanting during the first plowing. In 2016DS, the field was plowed earlier than the previous seasons (i.e., only 10 days after the 2015WS harvest) under dry soil conditions to test the effect of this change on mitigating the high CH4 fluxes that were observed at the early stage in the previous years.
Twenty-one-day-old rice seedlings of an inbred variety (NSIC Rc238) were manually transplanted at two to three seedlings per hill in 20 cm × 20 cm spacing. Surface water level was maintained at 1–3 cm from transplanting to 21 DAT, except for 2016DS where the plots were flooded until 10 DAT (i.e., another change employed for the CH4 mitigation). Thereafter, the water level was raised to 5 cm, and AWD and AWDS were started. A total of 120 and 90 kg ha−1 of N fertilizer was applied during DS and WS, respectively, in three equal splits into basal application (0 DAT), topdressing in the mid-tillering stage (25–26 DAT), and in the panicle initiation stage (44–46 DAT). Phosphorous and potassium were applied each at a rate of 40 kg ha−1 during the land preparation in both seasons. A compound fertilizer (14-14-14) was used for basal application and urea (46-0-0) for topdressing. Preemergence herbicide and pesticide were applied 3 DAT in 2014DS. Postemergence herbicide was applied 22 DAT in 2015WS.
2.4. Measurements
Rice grain yield was determined from a 5 m2 crop cut at the center of each plot. The harvested rice was threshed, cleaned, dried, and weighed. The moisture content of the grains was measured using a digital moisture meter, and grain yield was calculated at 14% moisture content. Weather data (daily rainfall, and daily maximum and minimum air temperatures) were collected from an automatic weather station adjacent to the experimental area.
Field water tubes were used as observation wells to monitor the surface water level in each plot. Using a ruler, the water level was manually measured once a day between 0800 and 0900 h. A 3-in. diameter of calibrated analog flow meter was installed in the irrigation pump, and was used to monitor the volume of irrigation water to each plot. The seasonal water use per plot was calculated as the sum of all irrigation applied and rainfall from transplanting to 1–2 weeks before the expected time of harvest.
Gas fluxes were measured at three points in each plot using a manually operated closed chamber method as described by Minamikawa et al. (Citation2015). To avoid soil disturbance and artificial CH4 ebullition during gas sampling, wooden scaffoldings were preinstalled in each plot. The base chambers were made of transparent, solid polycarbonate sheet with 48 cm diameter and 20 cm height. Each chamber covers four rice hills, but it is noted that the round-shape area covered may have underestimated the CH4 flux from 40 cm × 40 cm space during flooded periods by 12.5% because CH4 is mainly emitted through rice plants. Three base chambers were installed 10 cm depth into the soil 1 day before the first gas sampling to stabilize the soil, and then remained throughout the cropping season (CS). A 15-cm extension chamber, which was mounted on the base chamber, was used when the height of rice plants became high. The top chamber is a white plastic pail made of polypropylene with a volume of 108 L, equipped inside with a small fan, thermometer, vent with stopper, and a gas sampling port.
Regular gas sampling was conducted weekly until harvest. Additional gas samplings were performed at 1, 3, and 5 days after N fertilizer application to capture temporal high N2O fluxes. Five gas samples were collected using a 60-ml plastic syringe during 30-min chamber deployment (0, 6, 12, 20, and 30 min), and transferred into a 30-ml evacuated glass vial with butyl rubber stopper and screw cap. The concentrations of CH4 and N2O in the samples were then analyzed using a gas chromatograph (8610C, SRI Instruments, Torrance, CA, USA) equipped with flame ionization detector (FID) and electron capture detector (ECD), respectively. The carrier gas for both detectors was dinitrogen with a flow rate of 60 mL min−1. The column used for CH4 and N2O analyses was Porapak Q (50–80 mesh). Detector temperature was set at 350°C for the FID and at 330°C for the ECD. The GC was calibrated for CH4 using standard gas concentrations of 2, 5, and 10 ppm, and for N2O using 0.3, 0.5, and 1.0 ppm. The detection limits of the flux measurements were 0.283 and 0.143 mg m−2 h−1 for CH4 and N2O, respectively.
The gas fluxes were calculated based on a linear regression using the equations given in Minamikawa et al. (Citation2015). Seasonal cumulative CH4 and N2O emissions were estimated using a trapezoidal integration method (i.e., linear interpolation and numerical integration between sampling times).
The global warming potential (GWP), CO2-equivalent cumulative emission of CH4 and N2O, was calculated using the IPCC’s GWPs for 100-year time horizon with inclusion of climate-carbon feedbacks (IPCC Citation2014; 34 for CH4 and 298 for N2O). The yield-scaled GWP was calculated by dividing GWP over grain yields. The water productivity (WP), the weight of grain yield over the total volume of water used (irrigation and rainfall) from transplanting to 1–2 weeks before the expected time of harvest, was calculated.
Soil organic carbon and total nitrogen were analyzed by a dry combustion method. Soil samples were taken from two depths (0–10 and 10–20 cm) in each plot before the experiment as the initial data and after 2014WS, whereas from one depth (0–20 cm) after 2015WS, 2016DS, and 2016WS. The analysis was conducted at the International Rice Research Institute (IRRI) in Los Baños, Laguna, Philippines.
2.5. Statistical analysis
Analysis of variance was conducted using a split-plot design, where CS was treated as the whole-plot factor and treatment (water management: CF, AWD, AWDS) as the split-plot factor, with four replications. To test differences between DS and WS, the sums of squares for the whole-plot components were separated into the following sources of variation: between DS and WS (DW), within DS, and within WS. For the split-plot factors, the main effect of water treatment (T) and its interaction with CS were examined. The sums of squares of the interaction term (T × CS) were also separated into the following sources of variation: T × DW, T × DS, T × WS. Because the emissions of CH4 and N2O showed highly skewed distributions and violated normality and homoscedasticity assumptions, the Box–Cox transformation was conducted for CH4, N2O, GWP, and yield-scaled GWP using the ‘powerTransform’ function in the ‘car’ package of R (Box and Cox Citation1964; Fox and Weisberg Citation2011). To test differences among T, Tukey’s HSD test was performed with a significance level of 0.05.
3. Results
3.1. Weather and the irrigation water
The amount and pattern of rainfall were distinctly different between DS and WS ( and ). Rainfall in DS was negligible, while the total rainfall in WS ranged from 674 to 923 mm season−1. Seasonal variation pattern in air temperature was generally similar between DS and WS ( and ). The mean minimum and maximum air temperatures in WS were 2.7°C and 0.7°C higher than those in DS, respectively. On the other hand, daily solar radiation and sunshine duration in DS were 11% and 40% higher than those in WS, respectively (data not shown).
Figure 1. Seasonal variations in daily rainfall (A–C), daily maximum and minimum air temperature (D–F), mean surface water level (G–I), CH4 flux (J–L), and N2O flux (M, N) for three water management practices in dry season (DS) of 2014, 2015, and 2016. Error bars for CH4 and N2O fluxes indicate the standard error (n = 4). Vertical dotted lines indicate the application timing of nitrogen fertilizer. Gray areas in A–F indicate the lack of data observation.
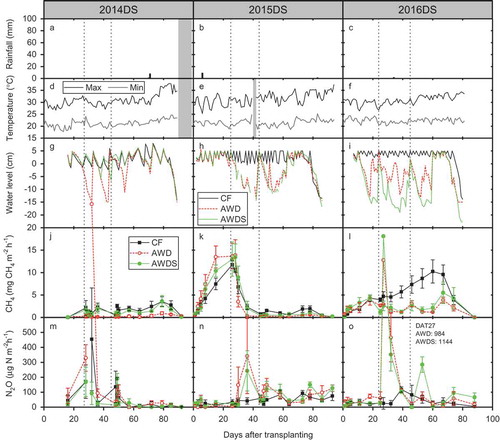
Figure 2. Seasonal variations in daily rainfall (A–C), daily maximum and minimum air temperature (D–F), mean surface water level (G–I), CH4 flux (J–L), and N2O flux (M, N) for three water management practices in wet season (WS) of 2014, 2015, and 2016. Error bars for CH4 and N2O fluxes indicate the standard error (n = 4). Vertical dotted lines indicate the application timing of nitrogen fertilizer. Gray areas in A–F indicate the lack of data observation.
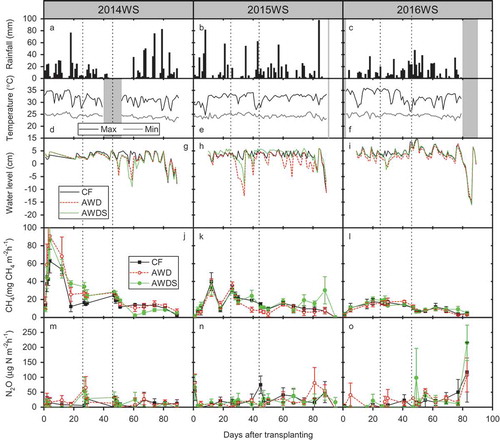
Surface water level under AWD and AWDS was better managed in DS than in WS ( and ) due to no interruptions by rainfall. However, the water level under CF in DS occasionally reached 0 cm, and the mean water level until the terminal drainage ranged from 2.1 to 3.6 cm compared to from 3.4 to 4.0 cm in WS. In addition, the water level under AWD and AWDS often declined to be negative after N topdressing in DS.
The total water use (i.e., irrigation and rainfall) was significantly reduced by AWD and AWDS compared to CF although the efficiency of water savings differed between DS (43–52% reduction relative to CF) and WS (16–18%) (; see Table S2 for the detailed data in each season). The AWDS obtained higher irrigation water savings by 15% than AWD. In addition, the total water use in WS was significantly higher (by 27%) than that in DS due to the greater rainfall. The amount of rainfall in WS accounted for 60–100% of the total water use.
Table 2. Seasonal CH4 and N2O emissions, GWP, rice grain yield, yield-scaled GWP, total water use, and water productivity as affected by cropping season and water management.
3.2. CH4 emission
The seasonal variation pattern and magnitude of CH4 fluxes differed between the two seasons ( and ). There were large peaks of CH4 fluxes at the early growth stage of rice plants in three consecutive seasons, 2014WS, 2015DS, and 2015WS ( and . In contrast, there were no such peaks in 2016DS (), in which a series of field management practices were modified from the previous crops (see Section 2.3 for detail). The resultant seasonal variation pattern was distinctly different between CF and others.
There was significant difference in the seasonal total CH4 emission among the six seasons, especially between DS and WS (). The total CH4 emission in WS was 6.4 times greater than that in DS. The effect of treatment was significant and the total emission was smaller in AWD than in CF. The interaction between CS and treatment was significant due mainly to (1) the changes in field management practices in 2016DS and (2) the field preparation before 2014DS.
3.3. N2O emission
The seasonal variation pattern in N2O fluxes was sporadic regardless of treatment through the six seasons ( and ). There were occasionally large peaks after N fertilizer topdressing and after the terminal drainage. In DS, the peaks after N topdressing were especially high in the case of unintended drained period for AWD and AWDS ().
There was significant difference in the seasonal total N2O emission among the six seasons, especially between DS and WS (). The total N2O emission in DS was 4.6 times greater than that in WS. The effect of treatment was also significant and the total emission was 97% greater in AWD than in CF.
3.4. GWP of CH4 and N2O
The effect of CS on the GWP of CH4 + N2O was significant mainly due to the significant difference between DS and WS (). The GWP in WS was 4.6 times greater than that in DS. The average contribution of N2O to the total GWP under the three water management was 33% during DS and only 2.1% during WS. Further, the fraction of N2O to the total GWP increased from 17% under CF to 36% under AWD and AWDS during DS. Consequently, the 39% CH4 reduction through AWD was offset by more than 100% increase in N2O. Reflecting the trade-off between CH4 and N2O, there was no significant effect of treatment on the GWP.
3.5. Grain yield and the yield-related indices
Grain yield level was comparable to earlier reports for DS and WS in Central Luzon (Corton et al. Citation2000; Lampayan et al. Citation2015). The effect of CS was significant; and reflecting the higher solar radiation, the yield in DS was 24% greater than that in WS (). The grain yield was not significantly different among treatments.
The effect of CS was significant on the yield-scaled GWP, and it was 5.6 times greater in WS than in DS (). Water productivity was significantly affected by CS and treatment (). Their interaction was also significant due mainly to the different responses of AWD and AWDS compared to CF between DS and WS.
4. Discussion
4.1. Effects of CS on GHG emissions
Greater CH4 emissions in WS than those in DS observed in our study confirmed the earlier report (Corton et al. Citation2000) showing that CH4 emission in WS was two to three times greater than that in DS. The greater emission in WS would be attributed to three possible causes. First, higher air temperatures in WS than in DS ( and ) can enhance the root exudates released into the soil, which contribute to the pool of available carbon substrates for methanogens (Allen et al. Citation2003; Tokida et al. 2011). Second, the amount of crop residue incorporation from the previous DS to WS was greater than the opposite, as shown in the greater yield in DS (). Although smaller rice biomass in WS could cause less CH4 emission through providing limited substrate supply and emission pathway, the greater residue incorporation would have provided a substantial carbon substrate for rapid development of soil reductive conditions and the resultant greater CH4 production (Gaihre et al. Citation2016). Third, the considerable volume of rainfall in WS resulted in longer flooding periods under CF than in DS ( and ). These would have contributed to the greater CH4 emission in WS.
Smaller N2O emission in WS is partly explained by the longer flooding period as the result of the greater rainfall. This agrees with Padre et al. (Citation2016), in which N2O emission was minimal under CF. However, as argued later, the substantial N2O emission after N fertilizer topdressing during the temporal drained periods in DS () amplified the difference between DS and WS.
4.2. Effects of water management on GHG emissions
The effect of treatment on the total CH4 emission was limited than expected. This is mainly because of the substantial CH4 emission irrespective of treatments in WS. The implementation of drainage under AWD and AWDS treatments was often impossible in WS due to the intermittent heavy rainfall, causing no reduction of the CH4 emission by AWD and AWDS. In addition, the initial high peaks observed in all water management treatments in 2014WS and 2015WS masked the small reduction in CH4 emission by AWD at later stages ().
In DS, the significant difference was detected between CF and AWD (). It should be noted that the CH4 emission under CF was lowered due to temporal drained periods in 2014DS and 2015DS. If proper implementation of water management had been achieved under CF, the difference from other treatments might have been more pronounced. The AWDS did not work well for the CH4 reduction in DS despite of the severe criterion of surface water level (−25 cm) set in 2015DS and 2016DS. This is because the decline in water level in this site was gradual and interrupted by the requirement of irrigation for N fertilizer topdressing (). In 2014DS, a single mid-season drainage was practiced as AWDS treatment, but the reduction in the CH4 emission was limited compared to AWD.
Minimizing the initial high peaks of CH4 flux observed both in DS and WS is a plausible option to clearly detect the effect of water management in this site. Because rice root system would not be well established by then, ebullition was a plausible pathway of the CH4 emission (Schutz et al. Citation1989). Bronson et al. (Citation1997) reported that CH4 production was enhanced after an extended saturated soil condition. Corton et al. (Citation2000) observed the initial high peaks of CH4 flux at the vegetative stage due to the anaerobic decomposition of rice straw incorporated. However, as clearly observed in 2016DS (), the two additional practices, earlier implementation of AWD drainage and an earlier implementation of fallow tillage (i.e., residue incorporation) under dry soil conditions, can suppress the initial high peaks. The shallow dry tillage practiced 10 days after harvest of 2015WS would have enhanced the decomposition of rice stubble/straw, leading to less carbon substrates for CH4 production, as observed by Toma et al. (Citation2016). Sander et al. (Citation2014) also reported that dry fallow with tillage reduced the CH4 emission in the following rice growing season as compared to dry fallow only.
The significant difference in the total N2O emission between CF and AWD () is mainly derived from a typical trade-off relationship between CH4 and N2O associated with paddy water management. The early drainage or soil drying after only a few days of N application resulted in high N2O emissions due to dry conditions in DS, although, the Philippines’ recommendation during fertilizer application is to maintain 3–5 cm ponded water. As observed in many previous field studies (e.g., Bronson et al. Citation1997; Sander et al. Citation2014; Sun et al. Citation2016; Tariq et al. Citation2017), substantial N2O fluxes were often observed after N fertilizer topdressing during temporal drained periods under AWD and AWDS, especially for DS. In other words, as reported by Zou et al. (Citation2005), keeping flooded soil conditions could minimize the N2O flux peaks observed after the topdressing.
4.3. Feasibility of AWD in terms of rice productivity, water use, and GHG emissions
The implementation of AWD and AWDS with the current criteria does not reduce rice grain yield in this site. Bouman et al. (Citation2007) and Lampayan et al. (Citation2015) suggest that there is no yield penalty under the AWD that rice field is irrigated whenever surface water level declines to 15–20 cm below the soil surface. This study confirmed their suggestions from the 3-year field trial.
The AWD and AWDS reduce the total water use and thus increase WP compared to CF both in DS and WS of this site. Although not significantly different from AWD, the WP of AWDS was higher due to its relatively high grain yields and lower total water input from irrigation and rainfall relative to CF especially in DS. The concept of WP becomes more important when water is scarce (Bouman et al. Citation2007) and expensive by a power-driven irrigation. The WP under CF was within the range of reported values in the Philippines (Bouman and Tuong Citation2001). However, the WP under AWD was relatively high compared to the reported values in the same site (Lampayan et al. Citation2015). This difference could be attributed to the different age of rice seedlings transplanted in the earlier study.
The results of GWP of CH4 and N2O suggest that AWD and AWDS with the current settings are not the best techniques to reduce the annual GWP in this site. Because AWD and AWDS could not be fully imposed in WS, it is necessary to develop other options for reducing the GWP, especially for CH4 emission. However, this study also found several lessons from the 3-year field experiment to enhance the ability of AWD and AWDS in reducing the GWP. As demonstrated in 2016DS, an earlier rice residue incorporation and keeping dry soil conditions in the preceding fallow season would be plausible options to reduce CH4 emission in the following rice growing season. As for N fertilizer topdressing, rice field should be flooded during and after the application to reduce N2O emission as well as to enhance the efficiency for rice uptake. In addition, it should be noted that AWD and AWDS did not reduce the soil carbon content in the topsoil (0–20 cm) throughout the 3-year experiment (Supplemental Fig. S1). Complying the above two lessons and the proper implementation of water management practices will be key to success in reducing GHG emissions through the feasible implementation of AWD.
5. Conclusions
This study found that the implementation of AWD is feasible in DS in Central Luzon, Philippines. Intermittent heavy rainfall in WS often interrupts the natural drainage under AWD, leading to insufficient soil drying that cannot substantially reduce CH4 emission. The original concept of AWD to save irrigation water consumption does not apply to WS. Because highly reductive soil conditions are unfavorable to sound rice growth as well as microbial CH4 production, more active drainage practices, such as surface drainage and pump drainage, may be plausible options in WS.
The AWD with the current settings significantly reduced the seasonal total CH4 emission, but the reduction rate against CF was very limited (1.7%). In addition, N2O emission was enhanced by the AWD, and the resultant GWP of CH4 and N2O did not significantly differ among treatments. However, learning from field experiences, we found feasible options that enhance the ability of AWD in reducing GHG emissions: (1) an earlier rice residue incorporation under dry soil conditions, (2) an earlier implementation of drainage, and (3) a proper maintenance of flooded soil condition during/after N fertilizer topdressing. Further study is necessary to test the quantitative effect of these options under field conditions.
Supplemenrat_files.zip
Download Zip (92.9 KB)Acknowledgements
This study was funded by the Ministry of Agriculture Forestry and Fisheries (MAFF) of Japan through the International Research Project “Technology development for circulatory food production systems responsive to circulatory food production systems responsive to climate change: Development of mitigation options for greenhouse gas emissions from agricultural lands in Southeast Asia 2 (MIRSA 2)”. We would like to thank Prof. Kazuyuki Inubushi (Chiba University, Japan), Dr Reiner Wassmann (IRRI, Philippines), and Dr Kazuyuki Yagi (NIAES, Japan) for their valuable comments on the earlier version of this manuscript.
Supplemental data
Supplemental data for this article can be accessed here.
Additional information
Funding
Related Research Data
References
- Allen LH, Albrecht SL, Colon-Guasp W, Covell SA, Baker JT, Pan D, Boote KJ 2003: Methane emissions of rice increased by elevated carbon dioxide and temperature. J. Environ. Qual., 32, 1978–1991. 10.2134/jeq2003.1978
- Bharati K, Mohnaty SR, Rao VR, Adhya TK 2001: Influence of flooded and non-flooded conditions on methane efflux from two soils planted to rice. Chemosphere-Glob. Change Sci., 3, 25–32. 10.1016/S1465-9972(00)00034-9
- Bouman BAM, Lampayan RM, Tuong TP 2007: Water Management in Irrigated Rice: coping with Water Scarcity, 54. International Rice Research Institute, Los Baños, Philippines.
- Bouman BAM, Tuong TP 2001: Field water management to save water and increase its productivity in irrigated rice. Agric. Water Manage., 49, 11–30. 10.1016/S0378-3774(00)00128-1
- Box GE, Cox DR 1964: An analysis of transformations. J. Royal Stat. Soc. Series B., 26. 211–246.
- Bronson KF, Singh U, Neue HU, Abao EB 1997: Automated chamber measurements of methane and nitrous oxide flux in a flooded rice soils: II. Fallow period emissions. Soil Sci. Soc. Am. J., 61, 988–993. 10.2136/ssaj1997.03615995006100030039x
- Cai Z, Guangxi X, Yan X, Xu H, Tsuruta H, Yagi K, Minami K 1997: Methane and nitrous oxide emissions from paddy fields as affected by nitrogen fertilizers and water management. Plant Soil, 196, 7–14. 10.1023/A:1004263405020
- Chidthaisong A, Inubushi K, Muramatsu Y, Watanabe I 1996: Production potential and emission of methane in flooded rice soil microcosm after continuous application of straws. Microbes Environ., 3, 73–78. 10.1264/jsme2.11.73
- Corton TM, Bajita JB, Grospe FS, Pamplona RR, Asis CA Jr, Wassmann R, Lantin RS, Buendia LV 2000: Methane emissions from irrigated and intensively managed rice fields in Central Luzon (Philippines). Nutr. Cycl. Agroecosyst., 58, 37–53. 10.1023/A:1009826131741
- DA-Department of Agriculture 2016: 2015 Annual Report Magandang Ani Magandang Buhay, p 65. Department of Agriculture. Quezon City, Philippines.
- Fox J, Weisberg S 2011: An R Companion to Applied Regression, Sage, Thousand Oaks, CA, USA.
- Gaihre YK, Wassmann R, Villegas-Pangga G, Sanabria J, Aquino E, Sta. Cruz PC, Paningbatan EP 2016: Effects of increased temperatures and rice straw incorporation on methane and nitrous oxide emissions in a greenhouse experiment with rice. Eur. J. Soil Sci, 67, 868–880. 10.1111/ejss.12389
- Inubushi K, Sugii H, Nishino S, Nishino E 2001: Effects of aquatic weeds on methane emission from submerged paddy soils. Am. J. Bot., 88, 975–979. 10.2307/2657078
- IPCC-Intergovernmental Panel on Climate Change 2014: Climate Change 2014: synthesis Report. Contribution of Working Groups I, II and III to the Fifth Assessment Report of the Intergovernmental Panel on Climate Change. In eds, Pachauri RK, Meyer LA. Intergovernmental panel on climate change. 151. IPCC, Geneva, Switzerland.
- Knoblauch C, Maarifat AA, Pfeiffer EM, Haefele SM 2011: Degradability of black carbon and its impact on trace gas fluxes and carbon turnover in paddy soils. Soil Biol. Biochem., 43, 1768–1778. 10.1016/j.soilbio.2010.07.012
- Koidi N, Robertson WA, Ines AVM, Qian J-H, DeWitt DG, Lucero A 2013: Prediction of rice production in the Philippines. J. Appl. Meteorol. Climatol., 52, 552–569. 10.1175/JAMC-D-11-0254.1
- Lampayan RM, Samoy-Pascual KC, Sibayan EB, Ella VB, Jayag OB, Cabangon R, Bouman BAM 2015: Effects of alternate wetting and drying (AWD) threshold level and plant seedling age on crop performance, water input, and water productivity of transplanted rice in Central Luzon, Philippines. Paddy Water Environ., 13, 215–227. 10.1007/s10333-014-0423-5
- Ly P, Vu DQ, Jensen LS, Pandey A, De Neergaard A 2014: Effects of rice straw, biochar, and mineral fertilizer on methane (CH4) and nitrous oxide (N2O) emission from rice (Oryza sativa L.) grown in a rain-fed lowland rice soil of Cambodia: a pot experiment. Paddy Water Environ., 13, 465–475. 10.1007/s10333-014-0464-9
- Minamikawa K, Tokida T, Sudo S, Padre A, Yagi K 2015: Guidelines for Measuring CH4 and N2O Emissions from Rice Paddies by a Manually Operated Closed Chamber Method, National Institute for Agro-Environmental Sciences, Tsukuba, Japan.
- Moog FA 2005: Country pasture/forage resource profiles: Philippines. http://www.fao.org/ag/agp/agpc/doc/Counprof/Philippines/Philipp.htm (January 20, 2017).
- Nelson A, Reiner W, Sander BO, Palo LK 2015: Climate-determined suitability of the water saving technology “alternate wetting and drying” in rice systems: a scalable methodology demonstrated for a province in the Philippines. PLoS ONE, 10(12), e0145268. pone.0145268. 10.1371/journal
- Padre AT, Rai M, Kumar V et al. 2016: Quantifying changes to the global warming potential of rice wheat systems with the adoption of conservation agriculture in northwestern India. Agric. Ecosyst. Environ., 219, 125–137. 10.1016/j.agee.2015.12.020
- PhilRice 2007: PalayCheck® System for Irrigated Lowland Rice, PhilRice, Maligaya, Muñoz, Nueva Ecija, Philippines.
- PhilRice-Philippine Rice Research Institute 2011: Philippine Rice Industry Prime Series, pp. 32. PhilRice, Maligaya, Munoz, Nueva Ecija, Philippines.
- Rath CK, Das SN, Thakur RS 2000: Methane emission from flooded rice fields. J. Sci. Ind. Res., 59. 107–113.
- Sander OB, Samson M, Buresh RJ 2014: Methane and nitrous oxide emissions from flooded rice fields as affected by water and straw management between crops. Geoderma, 235-236, 355–362. 10.1016/j.geoderma.2014.07.020
- Schutz H, Seiler W, Conrad R 1989: Processes involved in formation and emission of methane in rice paddies. Biogeochemistry, 7, 33–53. 10.1007/BF00000896
- Singh SN, Verma A, Tyagi L 2003: Investigating options for attenuating methane emission from Indian rice fields. Environt. Int., 29, 547–553. 10.1016/S01604120(03)00010-2
- Sun H, Sheng Z, Fu Z, Chen G, Zou G, Song X 2016: A two-year field measurement of methane and nitrous oxide fluxes from rice paddies under contrasting climate conditions. Sci. Rep., 6, 28255. 10.1038/srep28255
- Tariq S, Jensen LS, De Tourdonnet S, Sander BO, De Neergaard A 2017: Early drainage mitigates methane and nitrous oxide emissions from organically amended paddy soils. Geoderma, 304, 49–58. 10.1016/j.geoderma.2016.08.022
- Tokida T, Adachi M, Cheng W, Nakajima Y, Fumoto T, Matsushima M, Nakamura H, Okada M, Sameshima R, Hasegawa T 2011: Methane and soil CO2 production from current-season photosynthates in a rice paddy exposed to elevated CO2 concentration and soil temperature. Global Change Biol. 17, 3327–3337.
- Toma Y, Oomori S, Maruyama A, Ueno H, Nagata O 2016: Effect of the number of tillages in fallow season and fertilizer type on greenhouse gas emission from a rice (Oryza sativa L.) paddy field in Ehime, southwestern Japan. Soil Sci. Plant Nutr., 62, 69–79. 10.1080/00380768.2015.1109999
- Van Der Gon HACD, Kripff MJ, Van Breemen N, Wassmann R, Lantin RS, Aduna E, Corton TM 2002: Optimizing grain yields reduces CH4 emissions from rice paddy fields. Proc. Natl. Acad. Sci. USA., 99, 12021–12024. 10.1073/pnas.192276599
- Wassmann R, Neue HU, Ladha JK, Aulak H 2004: Mitigating greenhouse gas emissions from rice-wheat cropping systems in Asia. Environ. Dev. Sustain., 6, 65–90. 10.1023/B:ENVI.0000003630.54494.a7
- Wassmann R, Neue HU, Lantin RS, Makarim K, Chareonsilo N, Buendia LV, Rennenberg H 2000: Characterization of methane emissions from rice fields in Asia. II. Differences among irrigated, rainfed and deepwater rice. Nutr. Cycl. Agroecosyst., 58, 13–22. 10.1023/A:1009822030832
- Yagi K, Tsuruta H, Minami K 1997: Possible options for mitigating methane emission from rice cultivation. Nutr. Cycl. Agroecosyst., 49, 213–220. 10.1023/A:1009743909716
- Zou J, Huang Y, Jiang J, Zheng X, Sass R 2005: A 3-year field measurement of methane and nitrous oxide emissions from rice paddies in China: effects of water regime, crop residue, and fertilizer application. Glob. Biogeochem. Cycles, 19, GB2021. 10.1029/2004GB002401