
ABSTRACT
Water regimes play a central role in regulating methane (CH4) and nitrous oxide (N2O) emissions from irrigated rice field. Alternate wetting and drying (AWD) is a possible option, but there is limited information on its feasibility under local environmental conditions, especially for tropical region. We therefore carried out a 3-year experiment in a paddy field in Central Java, Indonesia to investigate the feasibility of AWD in terms of rice productivity, greenhouse gas (GHG) emission, and water use both in wet and dry seasons (WS and DS). The treatments of water management were (1) continuous flooding (CF), (2) flooding every when surface water level naturally declines to 15 cm below the soil surface (AWD), and (3) site-specific AWD with different criteria of soil drying (AWDS) established to find out the optimum for GHG emission reduction. Gas flux measurement was conducted by a static closed chamber method. Rice growth was generally normal and the grain yield did not significantly differ among the three treatments both in WS and DS. AWD and AWDS significantly reduced the total water use (irrigation + rainfall) as compared to CF. As expected, the seasonal total CH4 emission was significantly reduced by AWD and AWDS. On average, the CH4 emissions under AWD and AWDS were 35 and 38%, respectively, smaller than those under CF. It should be noted that AWD and AWDS were effective even in WS due partly to the field location on inland, upland area that facilitates the drainage. The seasonal total N2O emission did not significantly differ among the treatments. The results indicate that AWD is a promising option to reduce GHG emission, as well as water use without sacrificing rice productivity in this field.
1. Introduction
A major cause of global warming and climate change is the increase in the abundance of greenhouse gases (GHGs) in the atmosphere. Rice cultivation is a major source of a potent GHG, methane (CH4), contributing to about 11% of the global anthropogenic CH4 emissions (Ciais et al. Citation2013). Wassmann et al. (Citation2000) reported that, among rice ecotypes, irrigated rice emits approximately 70–80% of CH4 from the global rice area, followed by rainfed rice (15%) and deep-water rice (10%). Thus, irrigated rice represents one of the most promising targets for GHG mitigation strategies in agricultural sector.
Agricultural productivity is constrained by the availability of fresh water. In Asia, irrigated agriculture consumes around 80% of fresh water available (Tuong and Bouman Citation2003). However, Gleick (Citation1993) projected that the availability of water resources will decline by 15–54% in 2025 compared to 1990 in many Asian countries. It is known that every kg of rice has traditionally need 1900–5000 L of water (Bouman et al. Citation2007); therefore, instead of continuous flooding, a technique to save/conserve water in rice field, alternate wetting and drying (AWD), have been developed by the International Rice Research Institute (IRRI) (Price et al. Citation2013). Comparing to continuous flooding, AWD reduced the global warming potential (GWP) of CH4 and N2O emissions by 45–90% (Linquist et al. Citation2014), reduced irrigation water by 15–35% without significant yield loss (Siopongco et al. Citation2013), and can increase food security (Bouman et al. Citation2007). The other benefit of AWD was the reduction of arsenic accumulation in the grain by 64% (Linquist et al. Citation2014).
The principle of AWD is water saving technology which re-floods rice field after the disappearance of surface water around 1 day to more than 10 days. The AWD could be started from 1 to 2 weeks after transplanting, and the field is naturally drained until the water level reaches 15 cm below the soil surface, and then re-flooded up to 5 cm above the surface. This cycle is repeated until the final drainage before rice harvest, except for the flowering stage. The threshold of water at 15 cm below the soil surface will not cause any yield decline because still adequately supplied with water for the root of the rice from saturated soil (Lampayan et al. Citation2009). Liang et al. (Citation2016) reported that the AWD with the re-flooding threshold of 15 cm below soil surface and that of 30 cm reduced CH4 emission by 37–46% and 61–77%, respectively, while grain yield in the former was consistently higher than continuous flooding in South China. Xu et al. (Citation2015) observed the effectiveness of different water regimes to save water, mitigate CH4 emission and maintain rice yields for two rice varieties in a no-till paddy in central China. Hadi et al. (Citation2010) reported that the intermittent drainage reduced the GHG (CH4 and nitrous oxide, N2O) emissions by 37% compared to continuous flooding in South Kalimantan, Indonesia. However, there is limited information on the feasibility of AWD as a way to achieve less GHG emissions, including CH4 and N2O, and maintain rice yields in local situation, especially for tropical region.
Indonesia is the third-largest rice producing country in the world, as well as the world’s biggest rice consumer. The rice area occupies approximately 8.1 million ha as of 2013 (Statistics Indonesia Citation2017), in which lowland rice is still dominated by continuous flooding. Indonesian government is fully committed to achieve self-sufficient through the intensification of rice cultivation and open new paddy field from unproductive land. If these policies are implemented, GHG emissions from paddy fields and water scarcity will be increased substantially. Although Setyanto (Citation2004) reported that intermittent and pulse irrigation reduced CH4 emission compared to the conventional continuous flooding in Central Java, Indonesia, there is still lack information on the effect of AWD implementation on GHG emission and water saving in this country. The objective of this study was to investigate the feasibility of AWD under the local settings of climate and agricultural practices in Indonesia. Here we show AWD is an effective option to reduce GHG emission without rice yield penalty in an Indonesian rice paddy.
2. Materials and methods
2.1. Experimental site
The study was conducted at an experimental paddy field of Indonesian Agricultural Environment Research Institute (IAERI) located in Pati, Central Java (6°46ʹ39.7’ S and 111°11ʹ53.0’ E) during six consecutive rice growing seasons from 2013 to 2016. The wet season (WS) was from November to March and dry season (DS) from March to July. The location has a climate characteristic with annual mean rainfall of <1500 mm, maximum air temperature of 40°C and minimum air temperature of 24°C. The paddy soil is classified as silt loam, Aeric Endoaquepts (Soil Survey Staff Citation2010). The soil properties are listed in .
Table 1. Soil chemical and physical properties.
2.2. Experimental design and rice cultivation
The three treatments were arranged in randomized complete block design with three replications. The treatments were (1) continuous flooding at 5 cm (CF), (2) re-flooding 5 cm everywhen the surface water level naturally declined to 15 cm below the soil surface (AWD), and (3) site-specific AWD (AWDS) that had different criteria of soil drying from AWD treatment as explained below. In WS and DS in the first year (i.e., WS1 and DS1), multiple drainage 7 days before 1st and 2nd fertilization was implemented as AWDS, whereas in the second and third years (i.e., WS2, DS2, WS3, and DS3), re-flooding 5 cm everywhen the water level reached 25 cm below the soil surface was implemented as AWDS. AWDS treatment was flexibly set to find out the optimum water regime for GHG emission reduction.
Field management practices implemented are listed in . Fallow period continued for 3–4 months before WS, whereas only 1–2 weeks before DS. The rice plants were harvested with the cutter at 20 cm above the soil surface. The residues of rice stubble were incorporated into the soil 7 days after harvesting and the fields were plowed and puddled thoroughly to a 10-cm depth before transplanting or direct seeding. A long duration rice variety, Cisadane was planted at 20 cm × 20 cm spacing of rice hills to each plot with 5 m × 7 m area. In WS, rice seeds were sowed directly, while 14-day-old rice seedlings were transplanted in DS. Each plot was separated with plastic sheets up to 40 cm soil depth to prevent water seepage among plots. Two piezometers made of PVC pipe were installed to each plot to measure daily water level at 4:00–5:00 pm. Each plot was irrigated whenever the water level met the threshold, so that the irrigation schedule varied among replications. Irrigation water was supplied from water reservoir, embung, equipped with a water pump and connected with PVC pipe to distribute water to the plots. In WS, water level was kept at 1–2 cm during the first 15 days after sowing (DAS), and then the irrigation treatments practiced until 7 days before harvest. The irrigation treatments started from 5 to 10 days after transplanting (DAT) in DS.
Table 2. Field management practices in the six rice growing seasons.
The total broadcasting fertilization rates were 120 kg N ha−1 as urea, 60 kg P2O5 ha−1 as super phosphate, 90 kg K2O ha−1 as potassium chloride, and 5 ton ha−1 of farmyard manure (12.4% organic carbon and 1.3% nitrogen (N)). Super phosphate was applied as the basal dose. Urea and potassium chloride were applied in three equal split doses. The Leaf Color Charts were used to determine the time of the 2nd and 3rd fertilization. It is a tool for monitoring the relative greenness of a rice leaf as an indicator of the plant nitrogen status (IRRI Citation1998; Alam et al. Citation2005). Pests, disease, and weeds were appropriately controlled.
2.3. Measurements
The CH4 and N2O fluxes were measured by a closed chamber method. The size of chamber made of plexiglass was 50 cm length × 50 cm width × 100 cm height that covered four rice hills. The chamber was equipped with a fan to ensure the inside gas mixing during chamber deployment. The chamber basement equipped with water seal was installed into 5 cm soil depth after rice plant establishment. Gas sampling was conducted simultaneously at three points per plot once a week with additional daily sampling for 5 days after fertilizer application.
Gas samples were collected at 0, 6, 12, 20, and 30 min after the chamber deployment between 7:00–9:00 am. The samples taken by a 20-mL syringe were stored in 10-mL evacuated glass vials, and then subjected to the laboratory analysis using gas chromatography (GC). The air temperature inside the chamber was recorded during gas collection using a thermometer. The GC (Varian 450-GC, Varian Inc., CA, USA) was equipped with a flame ionization detector for CH4 analysis and an electron capture detector for N2O analysis. The CH4 and N2O fluxes were calculated from the linear regression of the concentrations. The seasonal total CH4 and N2O emissions were calculated using a trapezoidal integration method (i.e., a linear interpolation and numerical integration between sampling times; Minamikawa et al. Citation2015). To calculate the CO2-equivalent emission, the total CH4 and N2O emissions were converted using the IPCC’s GWP for 100-year time horizon with climate feedback (i.e., 34 for CH4 and 298 for N2O; IPCC Citation2013).
Rice plant height and the number of tillers per hill were regularly measured through the growing season. The grain yield of harvested rice (14% moisture content) was measured from 6-m2 sampling in each plot. The yield-scaled GWP was calculated by dividing the CO2-equivalent emission of CH4 and N2O by the grain yield.
Irrigation water usage (ton ha−1) was estimated by multiplying the flow rate in the pipe by the time of irrigation. Water saving against CF treatment and water productivity (WP), the ratio of the grain yield to the total water input (irrigation + rainfall) were calculated (Liang et al. Citation2016):
2.4. Statistical analysis
We conducted an analysis of variance (ANOVA) using a split-plot design, where cropping season (CS) was treated as the whole-plot factor and treatment (water management: CF, AWD, AWDS) as the split-plot factor, with three replications. To test differences between DS and WS, we separated the sums of squares for the whole-plot components into the following sources of variation: between DS and WS (DW), within DS, and within WS. For the split-plot factors, we examined the main effect of water treatment (T) and its interaction with CS. We also separated the sums of squares of the interaction term (T × CS) into the following sources of variation: T × DW, T × DS, T × WS. Because the emissions of CH4 and N2O showed highly skewed distributions and violated normality and homoscedasticity assumptions, the Box-Cox transformation was conducted for CH4, N2O, GWP, and yield-scaled GWP using the ‘powerTransform’ function in the ‘car’ package of R (Box and Cox Citation1964; Fox and Weisberg Citation2011). To test differences among water managements, Tukey’s HSD test was performed with a significance level of 0.05.
3. Results
3.1. Weather and irrigation water
During the 3-year field experiment, weather conditions were generally normal. The seasonal total rainfall ranged 705–1128 mm in WS and 142–466 mm in DS (–C and A–C). The mean air temperature was comparable between WS and DS (–F and D–F). The mean maximum and minimum air temperatures were 38.9°C and 24.0°C, respectively, in WS and 39.5°C and 23.7°C, respectively, in DS.
Figure 1. Seasonal variations in daily rainfall (A, B, C), daily maximum and minimum air temperatures (D, E, F), mean surface water level (G, H, I), CH4 flux (J, K, L), and N2O flux (M, N, O) for three water management practices in the 1st, 2nd, and 3rd wet seasons (WS). Error bars for CH4 and N2O fluxes indicate the standard error (n = 3). Vertical dotted lines indicate the application of nitrogen fertilizer. Grey areas in b and e indicate the lack of data observation.
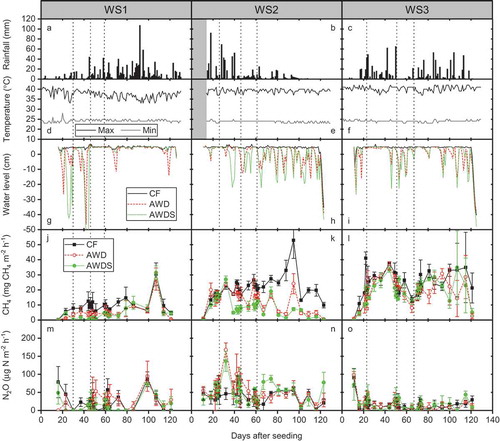
Figure 2. Seasonal variations in daily rainfall (A, B, C), daily maximum and minimum air temperatures (D, E, F), mean surface water level (G, H, I), CH4 flux (J, K, L), and N2O flux (M, N, O) for three water management practices in the 1st, 2nd, and 3rd dry seasons (DS). Error bars for CH4 and N2O fluxes indicate the standard error (n = 3). Vertical dotted lines indicate the application of nitrogen fertilizer. Grey areas in c and f indicate the lack of data observation.
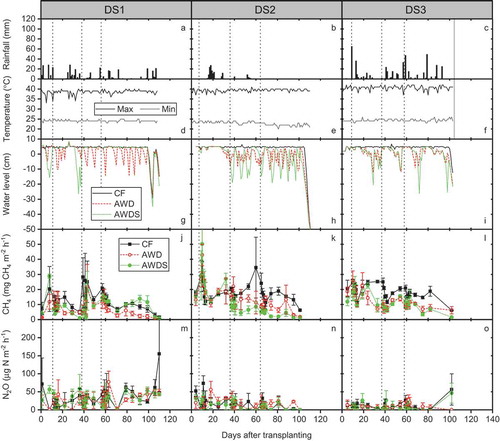
The surface water level was well controlled under AWD and AWDS in DS, whereas intermittent rainfall in WS often interrupted the drainage (–I and G–I). Although the criteria for AWDS differed between the first year (i.e., WS1 and DS1) and after that, the water level reached deeper than that under AWD in every season.
The total amount of water use was significantly greater in WS than in DS (). The average of water use in CF was 9578 m3 ha−1, while AWD and AWDS treatments were 9051 and 8961 m3 ha−1, respectively. The supply from irrigation water accounted for 14–24% and 24–66% of the total water use in WS and DS, respectively. The total water use was significantly reduced by AWD (by 5%) and AWDS (by 6%) compared to CF. The volume of irrigation water was reduced by AWD and AWDS by 17% and 20%, respectively, compared to CF.
Table 3. Seasonal CH4 and N2O emissions, GWP, rice grain yield, yield-scaled GWP, total water use, and water productivity as affected by cropping season and water management.
3.2. Rice growth and grain yield
Rice growth was generally normal, but in DS2, AWDS plots’ rice plants were damaged by rats (data not shown). The development of plant height and of tiller number clearly differed between WS with sowing and DS with transplanting (Fig. S1). In WS, plant height reached more than 130 cm and the number of effective tillers ranged 12–19 per hill, while in DS plant height was around 110–120 cm and the number of effective tillers was around 8–9 per hill. No obvious difference in rice growth was found among treatments. Rice grain yield was significantly greater (by 33%) in WS than in DS, and there was no significant effect of water management on the yield ().
3.3. CH4 and N2O emissions
The seasonal variation pattern in CH4 flux was distinct between WS and DS each with different crop establishment and fallow residue management (–L and J–L). Although the magnitude of CH4 flux was generally comparable between WS and DS, the highest value was always recorded in WS of each year. The seasonal variation pattern was not changed by water management; however, the magnitude was changed in each season.
The seasonal total CH4 emission was significantly affected by each of CS and water management (). The emission was also significantly different among the three WSs and among the three DSs. The emission in WS was 33% greater than that in DS. The emissions under AWD and AWDS were 35% and 38% smaller than that under CF, respectively. The significant interaction was observed between water management and DS and between water management and WS because the setting of AWDS differed between the first year and thereafter (for detail, see the subchapter of 2.2).
The seasonal variation pattern in N2O flux was sporadic (–O and M–O). Relatively high fluxes were observed in WS, especially after N fertilizer topdressing. The seasonal total N2O emission was significantly affected by CS (). The emission in WS was 65% greater than that in DS. The emission was also significantly different among the three WSs and among the three DSs.
3.4. GWP, yield-scaled GWP, and water productivity
On average, CH4 emission accounted for 97% of the GWP of CH4 and N2O; the contribution did not differ between WS and DS and among three treatments. Therefore, the result of statistical analyses was almost the same as that of the total CH4 emission (). The GWP in WS was 34% greater than that in DS, and AWD and AWDS significantly reduced the GWP compared to CF. The significant interaction between water management and DS was observed due to the same reason mentioned above.
The yield-scaled GWP was significantly affected by each of CS and water management (). The effect of CS was not due to the difference between WS and DS but due to temporal variation among the three WSs and among the three DSs. The yield-scaled GWP was reduced by AWD and AWDS by 35% and 36%, respectively, compared to CF.
The WP was significantly affected only by CS (). The WP in DS was 46% higher than that in WS. In addition, the temporal variation in WP also significant among the three WSs and among the three DSs.
4. Discussion
4.1. Rice productivity and water saving under AWD
The tested rice cultivar, Cisadane is a high-yield one compared with local varieties but requires a longer growth period. Rice grain yield ranged from 4.32 to 7.26 Mg ha−1 (Supplementary Table S1) compared to the local varieties of 4 and 6 Mg ha−1 in DS and WS in this area, respectively (Pramono and Setyanto Citation2015). As expected, rice growth and the resultant grain yield were greater in WS than in DS due to the different planting method and weather condition (most likely because of higher nutrient, lower pest and disease incidences in the WS). This result is consistent with Irawan (Citation2003).
We found no yield loss by implementing AWD and AWDS throughout the six CS. This result is consistent with the concept of safe AWD (Lampayan et al. Citation2009). Soil drying is one of the important factors in positively affecting rice yield because it can enhance root growth, grain-filling rate, and remobilization of carbon reserves from vegetative tissues to grains (Zhang et al. Citation2008; Yang et al. Citation2009; Chu et al. Citation2015). Rice plant photosynthesis is not severely inhibited and plants can rehydrate overnight, if AWD is properly implemented (Yang et al. Citation2016). Thus, we speculate that the AWD and AWDS implemented in this study were not so severe for sound rice growth that negative effects of soil drying, such as water stress, were not displayed on the grain yield. However, Carrijo et al. (Citation2017) reported from the meta-analysis that severe AWD (i.e., soil water potential in the rooting zone dropped below −20 kPa) resulted in yield losses of 22.6% relative to CF. We recorded there was no day drained on CF compared to AWD and AWDS treatments (Suplemental Table S2).
As expected, AWD and AWDS significantly reduce the total water use for irrigation () as well as the volume of irrigation water. Especially in DS, AWD and AWDS treatments demonstrate its power for saving both water and pump fuel. However, AWD and AWDS did not enhance the resultant WP owing to the no significant difference in rice grain yield among treatments. Increasing WP implies either to produce the same yield with less water or to obtain greater crop yield with the same water volume (Zwart and Bastiaanssen Citation2004). To make AWD feasible under the local environmental and socioeconomic conditions, further study is necessary to elucidate the minimum water requirement of the cultivar used.
4.2. GHG emission reduction through AWD
This study demonstrates that AWD and AWDS are powerful options to reduce GHG emission from irrigated rice paddies, if sufficient soil drying is achieved even in WS. Because this experimental site was located at inland, upland area (see Section 2.1), the soil drying would have been feasible even in WS with intermittent rainfall. This may not be the case of coastal, lowland area in tropical region. The greater CH4 emission in WS, especially at the latter stage, can be explained by the greater rice biomass and the longer flooding periods. Rice plants provide carbon substrates for methanogenesis via root exudation and decaying matter during senescence (Raimbault et al. Citation1977; Tokida et al. Citation2011). It is known that Cisadane, rice variety used in this study has large plant biomass in both above- and below-ground. For example, Setyanto et al. (Citation2004) reported that Cisadane showed the largest dry matter production and CH4 emission among four cultivars including Memberamo, IR64, and Way Apoburu.
There was no consistent seasonal pattern in N2O emission under AWD through the six CS. In other words, there was no trade-off relationship between CH4 and N2O emissions under AWD. Generally, low N2O fluxes are found during flooded periods, whereas high N2O fluxes are found during temporal drained periods (e.g., Zheng et al. Citation2000; Cai et al. Citation2001; Xu et al. Citation2004; Zou et al. Citation2005). In this study, the greater N2O emission was observed in WS. We speculated that wet but drained soil conditions as was in WS would enhance temporal N2O production and emission. However, further study is needed to elucidate the proper timing of AWD drainage and of N fertilizer topdressing in terms of rising N use efficiency and reducing N2O emission in this site.
Reflecting the results of CH4 emission, the resultant GWP and yield-scaled GWP were successfully reduced by implementing AWD and AWDS. The contribution of CH4 to the GWP in this experiment (97%) is comparable to those observed in temperate climate area with relatively low N input (e.g., Itoh et al. Citation2011). Our findings in this experiment have important implications for mitigation strategies in Indonesia. According to Tian et al. (Citation2015), some regions which experiencing excessive nitrogen input could practice less nitrogen input and it could result similar rice productivity but reduce the risks for higher CH4 and N2O emissions. van Groningen et al. (Citation2011) also showed this option was the best management practices to reduce GHG emission, while achieving high yields. Although the yield-scaled GWP from rice cultivation is known to be the highest among three major cereals including wheat and maize (Linquist et al. Citation2012), the reduction through AWD can approach the yield-scaled GWP toward those of other upland crops. Tian et al. (Citation2015) stated that in Asia, rice fields have expanded dramatically due to fast-growing population, which was the major contributor to the increasing CH4 emission. The policy makers should pay special attention to reduce CH4 and N2O emissions and, in the meanwhile, increasing carbon sequestration in order to slow down the future global warming.
5. Conclusions
This study investigated the local feasibility of AWD in terms of rice productivity, GHG emission, and water saving through a 3-year field experiment. The results indicated that the adoption of AWD to rice cultivation in Indonesia will be feasible because AWD can reduce GHG emission and water use without rice yield loss. However, it should be noted that the success of AWD in WS would depend on the field location (lowland vs. upland). In addition, the results that there was no significant difference in grain yield between AWD or AWDS and CF suggest feasibility of much severer soil drying for reducing GHG emissions without yield pinalties. Further study is needed to find out the optimum AWD threshold and schedule that lead to the improvement of rice productivity as observed in temperate region.
Suppl._tables.zip
Download Zip (108.8 KB)Acknowledgments
The research was funded by the Ministry of Agriculture, Forestry and Fisheries of Japan through the international research project ‘Technology Development for Circulatory Food Production Systems Responsive to Climate Change: Development of Mitigation Options for Greenhouse Gas Emissions from Agricultural Lands in Asia (MIRSA-2)’. We would like thank Prof. Kazuyuki Inubushi (Chiba University, Japan), Dr. Reiner Wassmann (IRRI, Philippines), and Dr. Kazuyuki Yagi (NARO, Japan) for their valuable comments on the earlier version of this manuscript.
Supplemental Data
Supplemental data can be accessed here.
Additional information
Funding
Related Research Data
References
- Alam MM, Ladha JK, Rahman Khan S, Foyjunnessa H-U-R, Khan AH, Buresh RJ 2005: Leaf color chart for managing nitrogen fertilizer in lowland rice in Bangladesh. Agron. J., 97, 949–959. doi:10.2134/agronj2004.0206
- Bouman BAM, Lampayan RM, Tuong TP 2007: Water Management in Rice: coping with Water Scarcity, 54 pp. International Rice Research Institute, Los Baños, Philippines.
- Box GEP, Cox DR 1964: An analysis of transformations. J. Roy. Stat. Soc. B, 26, 211–246.
- Cai ZC, Laughlin JR, Stevens RJ 2001: Nitrous oxide and dinitrogen emissions from soil under different water regimes and straw amendment. Chemosphere, 42, 113–121. doi:10.1016/S0045-6535(00)00116-8
- Carrijo DR, Lundy ME, Linquist BA 2017: Rice yields and water use under alternate wetting and drying irrigation: a meta-analysis. Field Crops Res., 203, 173–180. doi:10.1016/j.fcr.2016.12.002
- Chu G, Wang ZQ, Zhang H, Liu LJ, Yang JC, Zhang JH 2015: Alternate wetting and moderate drying increases rice yield and reduces methane emission in paddy field with wheat straw residue incorporation. Food Energy Secur., 4, 238–254. doi:10.1002/fes3.66
- Ciais P, Sabine C, Bala G et al. 2013: Carbon and other biogeochemical cycles.In Climate Change 2013: the Physical Science Basis. Contribution of Working Group I to the Fifth Assessment Report of the Intergovernmental Panel on Climate Change, Eds. Stocker TF, Qin D, Plattner G-K et al. Cambridge University Press, Cambridge, UK and New York, NY.
- Fox J, Weisberg S 2011: An R Companion to Applied Regression. Sage, Thousand Oaks, CA.
- Gleick PH 1993: Water in Crisis: A Guide to the World’s Fresh Water Resources. Oxford University Press, New York, NY.
- Hadi A, Inubushi K, Yagi K 2010: Effect of water management on greenhouse gas emissions and microbial properties of paddy soils in Japan and Indonesia. Paddy Water Environ., 8, 319–324. doi:10.1007/s10333-010-0210-x
- IPCC 2013: Climate change 2013 the physical science basic. Contribution of Working Group I to the Fifth Assessment Report of the Intergrovemental Panel on Climate Change, 714 pp. Cambridge University Press, Cambridge, UK and New York, NY.
- Irawan B 2003: The dynamics of productivity and the quality of cultural practises in rice field. In Indonesia’s Rice Economy, Eds. Kasryno F, Pasandaran E, Am F. Indonesian Agency for Agriculture Research and Development (IAARD), Jakarta, Indonesia. (In Bahasa Indonesia).
- IRRI-International Rice Research Institute 1998: Use of leaf color chart (LCC) for N management in rice. CREMNET Technology Brief No. 2, p. 4. IRRI, Los Banos, Philippines.
- Itoh M, Sudo S, Mori S et al. 2011: Mitigation of methane emissions from paddy fields by prolonging midseason drainage. Agric. Ecosyst. Environ., 141, 359–372. doi:10.1016/j.agee.2011.03.019
- Lampayan RM, Palis FG, Flor RB et al. 2009: Adoption and dissemination of “Safe Alternate Wetting and Drying” in pump irrigated rice areas in the Philippines. Proceedings of 60th International Executive Council Meeting and 6th Asian Regional Conference of the International Commission on Irrigation and Drainage, 6–11 December 2009, New Delhi, Indian National Committee on Irrigation and Drainage, pp. 1–11.
- Liang K, Zhong X, Huang N, Lampayan RB, Pan J, Tian K, Liu Y 2016: Grain yield, water productivity and CH4 emission on irrigated rice in response to water management in south China. Agric. Water Manage., 163, 319–331. doi:10.1016/j.agwat.2015.10.015
- Linquist B, Groenigen KJ, Adviento-Borbe MA, Pittelkow C, Kessel C 2012: An agronomic assessment of greenhouse gas emissions from major cereal crops. Glob. Change Biol., 18, 194–209. doi:10.1111/j.1365-2486.2011.02502.x
- Linquist BA, Anders MM, Adviento-Borbe MAA, Chaney RL, Nalley LL, da Rosa EFF, van Kessel C 2014: Reducing greenhouse gas emissions, water use, and grain arsenic levels in rice systems. Glob Change Biol., 21, 407–417. doi:10.1111/gcb.12701
- Minamikawa K, Tokida T, Sudo S, Padre A, Yagi K 2015: Guidelines for Measuring CH4 and N2O Emissions from Rice Paddies by a Manually Operated Closed Chamber Method. National Institute for Agro-Environmental Sciences, Tsukuba, Japan.
- Pramono A, Setyanto P 2015: CH4 emission on integrated crop-livestock system. Proceeding of national conference, information system and mapping of land resources in supporting food security. ICALRD-IAARD, Indonesian Ministry of Agriculture, July 29–30, Bogor, pp. 283–290. (in Bahasa Indonesia).
- Price AH, Norton GJ, Salt DE, Ebenhoeh O, Meharg AA, Meharg C 2013: alternate wetting and drying irrigation for rice in Bangladesh: is it sustainable and has plant breeding something to offer? Food Energy Sec., 2, 120–129. doi:10.1002/fes3.29
- Raimbault M, Rinaudo G, Garcia J-L, Boureau M 1977: A device to study metabolic gas in the rice rhizosphere. Soil Biol. Biochem., 9(3), 193–196. doi:10.1016/0038-0717(77)90074-8
- Setyanto P 2004: Methane emission and its mitigation in rice field under different management practices in Central Java. PhD thesis. University Putra Malaysia.
- Setyanto P, Rosenani AB, Boer R, Fauziah CI, Khanif MJ 2004: The effect of rice cultivars on methane emission from irrigated rice field. Indonesian J. Agric. Sci., 5(1), 20–31.
- Siopongco JDLC, Wassmann R, Sander BO 2013: Alternate wetting and drying in Philippine rice production: feasibility study for a clean development mechanism. IRRI Technical Bulletin No. 17. International Rice Research Institute (IRRI), Los Baños, Philippines.
- Soil Survey Staff 2010: Keys to Soil Taxonomy. 11th edition. USDA. Natural Resources Conservation Service, Washington, DC.
- Statistic Indonesia (BPS) 2017: Table of harvested area-productivity-production paddy in all provinces. http://www.bps.go.id/eng/tnmn_pgn.php?kat=3&id_subyek=53¬ab=0 (February, 2017).
- Tian H, Chen G, Lu C et al. 2015: Global methane and nitrous oxide emissions from terrestrial ecosystems due to multiple environmental changes. Ecosyst. Health Sustainability, 1(1), 1–20. doi:10.1890/EHS14-0015.1
- Tokida T, Adachi M, Cheng W, Nakajima Y, Fumoto T, Matsushima M, Nakamura H, Okada M, Sameshima R, Hasegawa T 2011: Methane and soil CO2 production from current-season photosynthates in a rice paddy exposed to elevated CO2 concentration and soil temperature. Global Change Biol., 17, 3327–3337. doi:10.1111/j.1365-2486.2011.02475.x
- Tuong TP, Bouman BAM 2003: Rice production in water-scarce environments. In Water Productivity in Agriculture: limits and Opportunities for Improvement, Eds. Kijne JW, Barker R, Molden D, pp. 53–67. CABI Publishing, Wallingford, UK.
- van Groningen JW, Oenema O, van Groenigen KJ, Velthof G, van Kesse K 2011: Best nitrogen management practices to decrease greenhouse gas emissions. Better Crops, 95(2), 16–17.
- Wassmann R, Neue HU, Lantin RS, Makarim K, Chareonsilp N, Buendia LV, Rennenberg H 2000: Characterization of methane emissions from rice fieldsin Asia: II. Differences among irrigation, rainfed, and deepwater rice. Nutr. Cycl. Agroecosyst., 58, 13–22. doi:10.1023/A:1009822030832
- Xu YC, Shen QR, Li ML, Dittert K, Sattelmacher B 2004: Effect of soil water status and mulching on N2O and CH4 emission from lowland rice field in China. Biol. Fertil. Soils., 39, 215–217. doi:10.1007/s00374-003-0692-4
- Xu Z, Zhou Z, Liu Y, Xu X, Wang J, Zhang H, Xiong Z 2015: Effects of water-saving irrigation practices and drought resistant rice variety on greenhouse gas emissions from a no-till paddy in the central lowlands of China. Sci. Total Environ., 505, 1043–1052. doi:10.1016/j.scitotenv.2014.10.073
- Yang JC, Huang DF, Duan H, Tan GL, Zhang JH 2009: Alternate wetting and moderate soil drying increases grain yield and reduces cadmium accumulation in rice grains. J. Sci. Food Agric., 89, 1728–1736. doi:10.1002/jsfa.v89:10
- Yang JC, Zhou Q, Zhang J 2016: Moderate wetting and drying increases rice yield and reduces water use, grain arsenic level, and methane emission. Crop J., 5(2), 151–158. doi:10.1016/j.cj.2016.06.002
- Zhang H, Zhang SF, Yang JC, Zhang JH, Wang ZQ 2008: Postanthesis moderate wetting drying improves both quality and quantity of rice yield. Agron. J., 100, 726–734. doi:10.2134/agronj2007.0169
- Zheng XH, Wang MX, Wang YS, Shen RX, Gou J, Li J, Jin JS, Li LT 2000: Impact of soil moisture on nitrous oxide emission from croplands: a case study on the rice-based agro-ecosystem in Southeast China. Chemosphere – Glob. Change Sci., 2, 207–224. doi:10.1016/S1465-9972(99)00056-2
- Zou JW, Huang Y, Jiang JY, Zheng XH, Sass RL 2005: A 3-year field measurement of methane and nitrous oxide emission from rice paddies in China: effects of water regime, crop residue, and fertilizer application. Glob. Biogeochem. Cycles, 19, GB2021. doi:10.1029/2004GB002401
- Zwart SJ, Bastiaanssen WGM 2004: Review of measured crop water productivity values for irrigated wheat, rice, cotton and maize. Agric. Water Manage., 69, 115–133. doi:10.1016/j.agwat.2004.04.007