
ABSTRACT
This study comprises a comprehensive assessment, integration, and synthesis of data gathered from a 3-year field experiment conducted at four sites in Southeast Asia, namely Hue, Vietnam; Jakenan, Indonesia; Prachin Buri, Thailand; and Muñoz, Philippines, to assess the site-specific feasibility of alternate wetting and drying (AWD) as a greenhouse gas (GHG) mitigation option in irrigated rice fields. AWD effectively reduced water use compared to continuous flooding (CF) but did not significantly reduce rice grain yield and soil carbon content in all sites. Methane (CH4) emissions varied significantly among sites and seasons as affected by soil properties and water management. AWD reduced CH4 emissions relative to CF by 151 (25%), 166 (37%), 9 (31%), and 22 (32%) kg CH4 ha−1 season−1 in Hue, Jakenan, Prachin Buri, and Muñoz, respectively. In Prachin Buri and Muñoz, AWD reduced CH4 emissions only during the dry season. Site-specific CH4 emission factors (EFs) ranged 0.13–4.50 and 0.08–4.88 kg CH4 ha−1 d−1 under CF and AWD, respectively. The mean AWD scaling factors (SFs) was 0.69 (95% confidence interval: 0.61–0.77), which is slightly higher than the Intergovernmental Panel on Climate Change (IPCC)’ SF for multiple aeration of 0.52 (error range: 0.41–0.66). Significant reductions in the global warming potential (GWP) of CH4+nitrous oxide (N2O) by AWD were observed in Hue and Jakenan (27.8 and 36.1%, respectively), where the contributions of N2O to the total GWP were only 0.8 and 3.5%, respectively. In Muñoz, however, CH4 emission reduction through AWD was offset by the increase in N2O emissions. The results indicate that the IPCC’s SF for multiple aeration may only be applied to irrigated rice fields where surface water level is controllable for a substantial period. This study underscores the importance of practical feasibility and appropriate timing of water management in successful GHG reductions by AWD.
1. Introduction
Rice is the only crop grown in predominantly flooded fields, and the subsequent anaerobic soil conditions stimulate the production of methane (CH4), a potent greenhouse gas (GHG) (Conen et al. Citation2010; Hou et al. Citation2000; Wang et al. Citation1993; Wassmann and Dobermann Citation2006). CH4 emissions from rice cultivation contribute substantially to the national GHG budgets of Asian countries (Wassmann et al. Citation2000a, Citation2000b). The two major GHGs, carbon dioxide (CO2) and nitrous oxide (N2O), are also exchanged between rice fields and the atmosphere. Global and regional estimates of GHG emissions from rice fields vary greatly depending on the assumptions made on the relative importance of different factors affecting the emissions. Studies have shown spatial variations in CH4 emissions from continuously flooded rice fields with varying soil properties including sand and clay contents, aeration, compaction, moisture, pH, organic matter, available N, C/N ratio, and also with changes in soil management, crop rotation, and climates (Adhya et al. Citation1994; Gogoi et al. Citation2008; Inubushi et al. Citation1997; Kimura et al. Citation1991; Kumar and Viyol Citation2009; Minami and Neue Citation1994; Wassmann et al. Citation2000a, Citation2000b; Yang and Chang Citation1998; Yagi and Minami Citation1990; Yao et al. Citation1999). The Intergovernmental Panel on Climate Change (IPCC Citation2006) has given a baseline emission factor for CH4 (EFCH4) of 1.3 kg CH4 ha−1 d−1 (with error range of 0.8–2.2), estimated by statistical analysis of available data (Yan et al. Citation2005) from continuously flooded rice fields without organic amendments. This baseline EFCH4 can be adjusted using scaling factors (SFs) to account for various conditions, e.g., water regime, organic amendments, and rice cropping practices.
Alternate wetting and drying (AWD) is a water management practice that was developed and being extended by the International Rice Research Institute (IRRI) and its partners to many rice-producing countries, to reduce the consumption of irrigation water (Lampayan et al. Citation2004). Water management practices such as AWD (Bouman et al. Citation2007), mid-season drainage, and intermittent irrigation (Minamikawa et al. Citation2014) mitigate CH4 emissions by periodic aeration that inhibits the activity of CH4-producing archaea. Several studies have demonstrated the effective mitigation of CH4 emissions from rice fields through soil and water management (Ahmad et al. Citation2009; Harada et al. Citation2007; Ishibashi et al. Citation2009; Itoh et al. Citation2011; Jiao et al. Citation2007; Ko et al. Citation2002; Yagi et al. Citation1996). Sander et al. (Citation2015) carried out a literature survey of 24 independent studies on GHG mitigation by water management in China, India, Japan, South Korea, Indonesia, and Philippines, and showed a mean CH4 reduction of 1.26 kg CH4 ha−1 d−1 resulting from multiple aeration or multiple drainage, and 1.15 kg CH4 ha−1 d−1 from single aeration or single drainage, as compared to continuous flooding (CF). They also reported a SF, the ratio of CH4 emission under target practice to that under baseline (CF) practice, of 0.57 (range: 0.19–0.86) and 0.63 (0.18–1.52) under multiple aeration and single aeration, respectively.
The N2O emissions from rice fields mainly occur just after soil flooding for rice cultivation, during temporal drainage events, and during fallow periods, and thus are generally higher under water management practices as compared to CF. Akiyama et al. (Citation2005) compiled available data in the literature on N2O emissions from fertilized rice fields and reported that the fertilizer-induced N2O emission factors for CF, mid-season drainage, and all water regimes were 0.22, 0.37, and 0.31%, respectively. The last value has been adopted as the IPCC’s default N2O emission factor (EFN2O) for flooded rice (0.3%) though with a large error range (0.0–0.6%) (IPCC Citation2006).
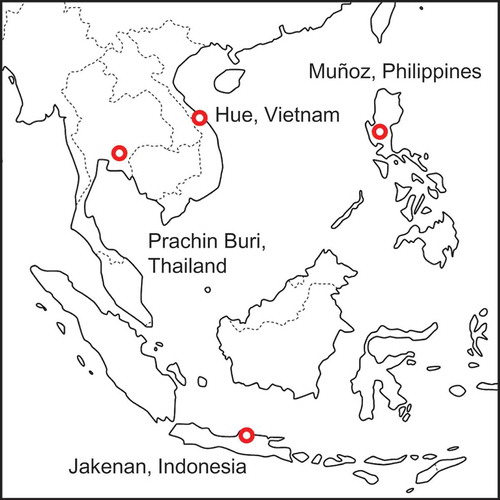
A field monitoring campaign was conducted under a joint international research project at four sites: 1) Hue, Vietnam, 2) Jakenan, Indonesia, 3) Prachin Buri, Thailand, and 4) Muñoz, Philippines (). They represent diversified paddy environments in Southeast Asia. Results from each site were reported in separate papers of this issue (Tran et al. Citation2018; Setyanto et al. Citation2018; Chidthaisong et al. Citation2018; Sibayan et al. Citation2018). They monitored the changes in soil carbon (C) content, which may be lost by intensive drainage events, in addition to CH4 and N2O emissions under AWD and CF. Here, we present a synthesis and integration of the results from the four sites to assess the generalities and site-specificities of AWD as a mitigation option for GHG emissions from irrigated rice fields in Southeast Asia. This study (1) analyzed the effects of environment and soil properties on the extent of GHG mitigation by AWD, (2) examined the potential trade-offs and co-benefits in terms of rice grain yield and water savings from AWD, and (3) compared the obtained EFCH4, the ratio of N2O-N emission to applied N as inorganic fertilizer, and SF for CH4 under AWD (SFCH4-AWD) with the IPCC’s default values (IPCC Citation2006).
Figure 1. Locations of the four experimental sites.
2. Materials and methods
2.1. Data source
The data set analyzed in this study was generated from field experiments conducted under the international research project known as MIRSA-2. The project covered six rice seasons including both dry and wet ones (DS and WS) in 2013–2016 at four sites, namely Hue, Vietnam; Jakenan, Indonesia; Prachin Buri, Thailand; and Muñoz, the Philippines (). The detailed information on site locations, basic soil properties, cropping seasons, weather conditions, and field management are summarized in . Photographs of soil profile at the four sites are shown in .
Table 1. Location, soil properties, season, weather, and field management of the four experimental sites.
Figure 2. Comparison of the soil profiles in the four experimental sites. The soil profiles are arranged according to the apparent soil redox condition with showing the USDA and FAO classifications.
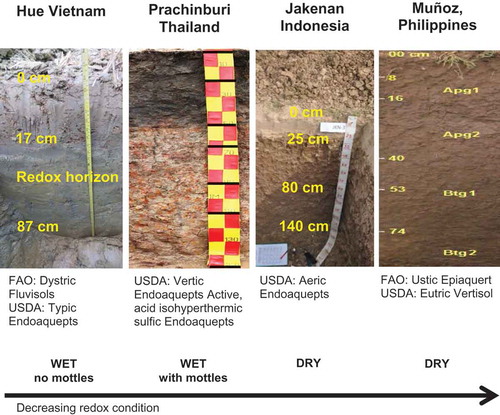
Figure 3. Relationships between (A) predicted SFCH4-AWD and observed SFCH4-AWD and (B) observed SFCH4-AWD and NNFD for the data in Hue and Jakenan (n = 24; 2 sites × 6 seasons × 2 practices (AWD and AWDS)). In A panel, dotted line indicates the linear regression between predicted and observed SFCH4-AWD. In B panel, solid and dotted lines indicate the multiple regression line with MinWL of −15 cm and the linear regression between observed SF and NNFD, respectively.
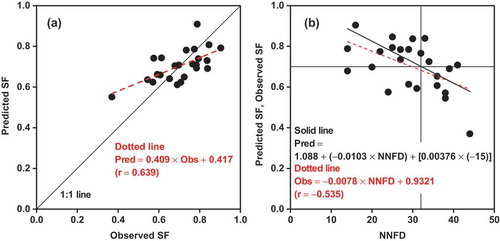
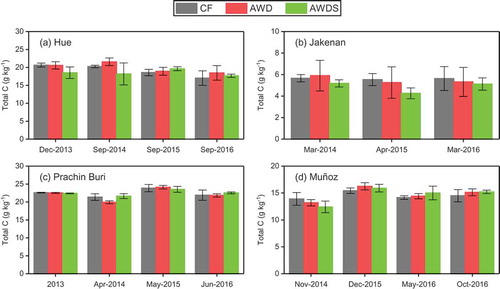
Figure 4. Interannual variations in total carbon content at a soil depth of 0–20 cm among three water management practices in (A) Hue, (B) Jakenan, (C) Muñoz, and (D) Prachin Buri. Vertical bars indicate the standard deviation (n = 3–4).
The experimental plots in each site were laid out in a randomized complete block design with three treatments and three blocks except for Muñoz with four blocks. The treatments were (1) CF, (2) AWD, and (3) site-specific AWD (AWDS). In AWD, the water management followed what is called safe-AWD. The field was irrigated when the surface water level reached 15 cm below the soil surface after which the field was re-flooded to around 5-cm level above the soil surface throughout the cropping season except for the flowering stage (Sander et al. Citation2015). The method of implementing AWDS varied among sites, as briefly summarized below. In Hue, the threshold of re-flooding changed depending on rice growth stage. That is, the plots were irrigated when the water level dropped to 5 cm, 10 cm, and 15 cm below the soil surface at early tillering stage, late tillering stage, and grain filling and ripening stage, respectively (Tran et al. Citation2018). In Jakenan, multiple aeration 7 days before the 1st and 2nd N fertilizer topdressing was implemented as AWDS in the first two seasons, and in the succeeding seasons, the threshold of re-flooding changed to 25 cm below the soil surface (Setyanto et al. Citation2018). In Prachin Buri, the plots were re-flooded to 10-cm level under AWDS as compared to 5-cm level under AWD (Chidthaisong et al. Citation2018). In Muñoz, AWDS was implemented as a 7–10-day-long single aeration (i.e., mid-season drainage) in the first two seasons. In the succeeding seasons, it was implemented as the AWD with the threshold of 25 cm below the soil surface. The starting timing of AWD and AWDS was changed from 21 days after transplanting (DAT) to 10 DAT from the 5th season to achieve drier soil conditions (Sibayan et al. Citation2018).
Water use expressed as m3 ha−1 () is the amount of irrigation water used at each site that was estimated using a flow meter connected to the irrigation pump, plus the total amount of rainfall recorded for each season. Water productivity expressed as kg grain m−3 () was estimated from the grain yield divided by the total amount of irrigation water including rainfall.
Table 2. Comparison of alternate wetting and drying (AWD) implementation among the four experimental sitesa.
Table 3. Comparisons of the effects of AWD on greenhouse gas emissions, rice productivity, and water use among the four experimental sites.
2.2. Gas measurement and soil analyses
The CH4 and N2O emissions were measured by a manual closed chamber method. Standardized protocols were commonly used to ensure precise and accurate gas flux measurements based on the guidelines given by Minamikawa et al. (Citation2015). Gas sampling was done between 9 and 11 AM, once a week and 5 consecutive days after N fertilization. The total number of samplings conducted per season was 16–20 in Hue, 22–29 in Jakenan, 16–28 in Prachin Buri, and 15–21 in Muñoz. Gas samples were taken 5 times, at 1, 6, 12, 20, and 30 mins after chamber deployment and stored in evacuated glass vials until analysis using gas chromatography. Hourly gas flux was calculated using linear regression and the seasonal emission was computed as the sum of daily fluxes. Daily fluxes in between measurements were estimated from a linear interpolation of two consecutive measurements.
Soil (0–20 cm depth) samples were collected annually from the three treatments in each of the three replicate blocks at each site except in Muñoz with four replicate blocks. Air-dried samples were sent to IRRI in the Philippines after the 3-year experiment for analyses of pH in 1:1 soil:water suspension, pH after oxidation with 30% hydrogen peroxide (H2O2) (Ahern et al. Citation1998), total C and N, active iron (Fe), and active manganese (Mn), to eliminate the interlaboratory variability in accuracy and precision. Total C and N were analyzed by a dry combustion method. Active Fe and Mn were analyzed by sodium dithionite extraction and inductively coupled plasma optical emission spectrometry (Asami and Kumada Citation1959).
2.3. Calculation of emission-related parameters
The parameters included EFCH4 under CF and AWD (EFCH4-CF and EFCH4-AWD), SFCH4-AWD, the ratios of N2O-N emission to applied N as inorganic fertilizer under CF and AWD, and GWPs under CF and AWD (GWPCF and GWPAWD). It is noted that EFCH4-CF and EFCH4-AWD calculated here are not exactly the same as the IPCC’s Tier-1 EFs (IPCC Citation2006). Rather, these are site-specific and management-specific EFs (e.g., in Jakenan, CF and AWD with the application of farmyard manure), and thus can be considered as the Tier-2 approach that is suitable for country-specific estimations.
Data from AWD and AWDS from each block were combined as AWD in calculating all the parameters as mentioned in the subsection 3.2. The EFCH4-CF and EFCH4-AWD (kg CH4 ha−1 d−1) were calculated by dividing the seasonal (cumulative) emission by the growth duration. The ratios of N2O-N emission to applied N as inorganic fertilizer under CF and AWD (%) were calculated by dividing the seasonal (cumulative) N2O-N emission by the amount of inorganic fertilizer N applied. Site means across seasons were weighted against the variances obtained from three or four replicate (block) measurements in each season. For estimating weighted means and 95% bootstrapped confidence interval (CI) of SFCH4-AWD, the LN (natural log or log base-e) response ratio (LN (EFCH4-AWD/EFCH4-CF) for each site and combined for all sites was calculated using MetaWin (ver.2.1; Rosenberg et al. Citation2000). Treatment effects were considered to be significantly different from one another if their 95% CIs did not overlap and were considered significant if the 95% CI did not overlap with zero.
The weighted means for Hue and Jakenan were based on six-season data, but for Muñoz, separate means were calculated for WS and DS due to the significant differences in emissions between them. In Prachin Buri, no data were generated in the 4th season as planting was canceled due to flooding. The data for AWD in the 6th season from Prachin Buri and Muñoz were excluded from analyses since soil drainage under AWD (i.e., surface water level below 0 cm) was not achieved during this season. In Hue, the N2O data from the 5th and 6th seasons were excluded from the analyses due to the malfunction of gas chromatograph. For the same reason, N2O data from the 2nd season in Prachin Buri were excluded from analyses.
The GWPCF and GWPAWD of CH4 and N2O emissions were calculated using the IPCC’s factors with inclusion of climate-carbon feedbacks (34 for CH4 and 298 for N2O; Myhre et al. Citation2013).
2.4. Quantitative assessment of soil drying under AWD and statistical analyses
We set the following five criteria to quantitatively assess the degree of soil drying under AWD: (1) minimum water level below the soil surface (MinWL), (2) number of non-flooded days (NNFD), (3) ratio of NNFD to total number of rice cropping days, (4) average surface water level during rice cropping period, and (5) soil drainability. The soil drainability was the apparent decline rate of surface water level that included plant evapotranspiration. Target period of the five criteria was from planting day until the last day before final drainage prior to harvest. Multiple linear regression analysis with stepwise selection was done using SAS software ver. 9.4 (SAS Institute Inc., Cary, NC, USA) to determine if any of the five measured criteria could be used to predict SFCH4-AWD.
Analysis of variance (ANOVA) of data from the four sites was performed with a mixed model (‘proc mixed’) in the SAS software to assess the main effects of site (the four experimental sites), DS or WS (DW in ), water management (WM in ), and their interactions. A split-plot model was applied in which experimental site was treated as the whole-plot factor, DW as the split-plot factor, and WM as the split-split-factor. Variance components were estimated by the restricted maximum-likelihood method with the ‘nobound’ option, and the denominator degrees of freedom were estimated by the Kenward–Roger approximation (Kenward and Roger Citation1997; Littell et al. Citation2006). Because emissions of CH4 and N2O showed highly skewed distributions and violated normality and homoscedasticity assumptions, the Box-Cox transformation was conducted for CH4, N2O, GWP, and yield-scaled GWP using the powerTransform function in the car package of R (Box and Cox Citation1964; Fox and Weisberg Citation2011).
3. Results
3.1. Inter-site variations in soil properties, weather conditions, and field management practices
Soil texture differed from loam in Hue and Jakenan to heavy clay in Prachin Buri (). The total C and N contents ranged from 5.3–19.2 g kg−1 and 0.47–1.9 g kg−1, respectively, with the lowest values in Jakenan and the highest in Prachin Buri. The C:N mole ratio was comparable among Jakenan, Muñoz, and Prachin Buri, but that in Hue was relatively low. The active Fe content of Jakenan soil was the lowest among sites. Active Mn content was the highest in Muñoz.
The soil profiles at the four sites are shown in . Hue and Prachin Buri soils were wet and had reduced conditions as indicated by the bluish black color compared to Jakenan and Muñoz soils with relatively dry and more oxidized conditions revealed by the brown color. Prachin Buri soil differed from Hue soil in that the former had distinct dark yellowish brown mottles in the subsurface horizons indicating seasonal oxidation in the soil pores. Thus, among the sites, Hue soil was considered as having the most reduced condition followed by Prachin Buri. Prachin Buri soil was classified as acid, sulfic Endoaquepts originating from the deposition of seawater or brackish water sediment. Prachin Buri soil collected at the time of the experiment had an average pH(H2O) of <4 (), which confirms that it is an actual acid sulfate soil (Ahern et al. Citation1998). Further, an average pH(H2O2) of <3 confirms the presence of sulfides that have not been oxidized. On the other hand, Hue soil with pH(H2O) of >4 and pH(H2O2) of <3 indicates that it has the potential to become an actual acid sulfate soil. However, at the time of soil sampling, Hue soil may not be considered as acid sulfate. Muñoz soil exhibited vigorous reaction with H2O2 but the resulting pH(H2O2) was >4. The vigorous reaction may have been due to reactions of H2O2 with manganese, which had the highest concentration in Muñoz soil ().
Between Jakenan and Muñoz soils, the latter was thought to be under more oxidized conditions. Muñoz soil was classified as Ustic Epiaquert derived from Alluvium parent material and was poorly drained, while Jakenan soil, Aeric Endoaquepts, was a wet soil influenced by groundwater. But its relatively high chroma indicated either a shorter period of saturation of the whole soil profile with water or somewhat deeper groundwater than that in the soils of the Typic subgroup.
Cropping calendar differed among sites depending mainly on irrigation water availability and rainfall pattern (). In Hue and Prachin Buri, the fallow period coincided with months of continuous rainfall when inundation usually occurs. On the other hand, the fallow period in Jakenan coincided with dry months when irrigation water is scarce. In Muñoz, a 2- to 3-month dry or wet fallow period follows each crop of rice ().
Crop and fertilizer management practices also differed among sites (). Farmyard manure and an organic microbial fertilizer were applied in Jakenan and Hue, respectively, which are common in these areas. The amounts of inorganic N applied were the lowest in Prachin Buri. In Jakenan, a rice variety with relatively long growth duration was planted. In all sites, harvested rice straw was removed from the field while the rice stubbles were incorporated during soil puddling for the succeeding rice crop. In Muñoz, only in the 5th season, an earlier incorporation of rice stubbles was done under dry soil conditions (Sibayan et al. Citation2018).
3.2. Inter-site variation in soil drying under AWD
shows the calculated averages, with ranges and standard deviations, of the five criteria of soil drying under AWD and AWDS in the four sites. The water level threshold of −15 cm for safe AWD was not always achieved (i.e., water level did not decline to −15 cm), but was often exceeded in Hue and Jakenan due to the drier weather conditions and soil properties. There were no substantial differences in the five criteria between DS and WS in Jakenan, and between winter-spring season and summer-autumn season in Hue, so the overall site means are shown for these sites. In Prachin Buri and Muñoz, AWD was not achieved during WS (data not shown for Prachin Buri). In Muñoz, remarkable differences between DS and WS were observed in the NNFD and the average surface water level. Thus, data for both DS and WS are shown. The NNFD covered 28–39% of the cropping period in Muñoz DS, Hue, and Jakenan whereas it covered only 13–26% in Muñoz WS and Prachin Buri. The highest soil drainability was observed in Jakenan.
The NNFD and MinWL were identified as the sole significant (p < 0.05) predictors of SFCH4-AWD by stepwise selection and multiple regression analysis of data from the loamy soils of Hue and Jakenan (Tables S1 and S2). The two predictors explained 41% of the variability in SFCH4-AWD in the loamy soils as indicated by the model R2. Consequently, the following regression equation was derived from the multiple linear regression analysis for the loamy soils:
A significant linear relationship was obtained between the predicted and the observed SFCH4-AWD (). Solid line calculated using Eq. 1 shows the predicted SF at varying NNFDs when MinWL was fixed at −15 cm, which is the threshold set for safe AWD (Lampayan et al. Citation2004) (). We did not obtain a significant multiple regression equation to predict SFCH4-AWD for the clay soils and for the combined clay and loam soils.
Based on the calculated five criteria, there was no clear distinction between soil drying by AWD and AWDS at each site as indicated by the overlapping error ranges (). We therefore combined the data from AWD and AWDS in the following sections to represent AWD in general.
3.3. GHG emission, soil C and N contents, grain yield, and water use
The results of ANOVA showed significant (p < 0.05) effects of site, season (DW; DS vs. WS), and water management (WM) on the seasonal CH4 emissions (). The highest CH4 emission under CF was observed in Hue, while the emissions in Muñoz DS and Prachin Buri were much lower. The CH4 emission reduction by AWD, which includes AWDS as mentioned above, relative to CF was observed in all the sites except for Muñoz WS, as indicated by the significant site × DW interaction. In absolute amounts, the emission reduction during DS in Hue, Jakenan, Prachin Buri, and Muñoz were 148, 190, 9, and 22 kg CH4 ha−1 season−1, respectively, and those during WS in Hue, Jakenan, and Prachin Buri were 154, 141, and 8 kg CH4 ha−1 season−1, respectively. In Muñoz WS, no CH4 emission reduction was achieved through AWD due to the continuous heavy rainfall (Sibayan et al. Citation2018). The CH4 emissions under CF were generally higher during WS than DS.
There was no significant effect of WM on the seasonal N2O emission, but an emission increase under AWD was observed in Muñoz, Jakenan, and Prachin Buri (). The season effect (DS vs. WS) on N2O emission was not significant but a significant site × season interaction was observed (). Significant differences in N2O emissions during DS and WS were observed in Prachin Buri and Muñoz but not in Hue and Jakenan.
There were significant effects of WM and site on the GWP of CH4 and N2O with significant WM × site interaction (). The fraction of N2O to the GWP under CF was much higher in Muñoz DS and Prachin Buri with clayey soils than in Hue and Jakenan with loamy soils. AWD increased the N2O fraction in all the sites, except for Hue DS. Moreover, 32% CH4 reduction through AWD in Muñoz DS was partially offset by 96% increase in N2O emissions, resulting in lower GWP reduction by AWD (11.4%) as compared to the CH4 reduction (32.1%) ().
The total C and N contents in the topsoil (0–20 cm) did not significantly differ among WM on each sampling date at each site ( for total C; data not shown for total N). Further, AWD showed no significant effect on rice grain yield and yield-scaled GWP (). Water use and water productivity, the ratio of grain yield to water use, were significantly affected by WM with the significant WM × site interaction (). The reduction in water use through AWD relative to CF was remarkably higher in Muñoz DS and Prachin Buri than in Hue and Jakenan. Water productivity was improved through AWD from 3.3% in Jakenan WS to 69.0% in Muñoz DS.
3.4. Site-specific EFs and SFs
The EFCH4-CF and EFCH4-AWD are shown in . Data from DS and WS in Muñoz are separately presented to reflect the season-specific responses of CH4 emission to AWD. The EFCH4-CF and EFCH4-AWD in Hue and Jakenan were significantly higher than those in Prachin Buri and Muñoz DS. The highest EFCH4-CF was obtained in Hue followed by Jakenan and Muñoz WS. Lower EFCH4-AWD than EFCH4-CF was obtained in all the sites except Muñoz during WS. The weighted-mean EFCH4-CF across sites and seasons including Muñoz WS (2.46 ± 0.56 kg ha−1 d−1) was slightly higher but not significantly different from the IPCC’s default EF for flooded rice (1.30 kg ha−1 d−1 with error range of 0.80–2.20; IPCC Citation2006). However, it should be noted that the EFsCH4 reported here were estimated under site-specific management practices (e.g., the application of farmyard manure in Jakenan), while the IPCC’s default EF was derived from measurements without organic amendments. The baseline EFCH4 in Jakenan that was measured under CF without organic amendments in a neighboring field (2.7 kg ha−1 d−1; Pramono and Setyanto Citation2015) was 34% lower than that reported with farmyard manure in this study.
Figure 5. CH4 emission-related parameters in the four experimental sites. (A) Emission factors (EF) for CF and AWD. (B) AWD scaling factors (SF). Data in dry season are shown for Prachin Buri. Data in dry and wet seasons are shown separately for Muñoz. Mean data in dry and wet seasons are shown for Hue and Jakenan. Means overall sites and seasons with and without Muñoz wet season are separately shown. The horizontal bars for each site indicate the 95% confidence intervals. Bars for IPCC (Citation2006) indicate the error range given in the IPCC (Citation2006) guidelines. In A panel, the values for Prachin Buri CF and AWD are 0.024 ± 0.027 and 0.031 ± 0.041, respectively.
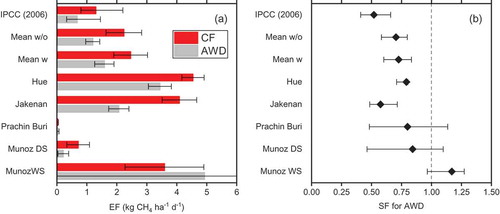
The SFCH4-AWD ranged from 0.57 to 0.84 (excluding Muñoz WS) and did not significantly differ among sites (). The weighted-mean SFCH4-AWD of 0.69 (95% bootstrapped CI: 0.61–0.77) was estimated for across sites and seasons excluding Muñoz WS. This value was within the range of multiple aeration by Sander et al. (Citation2015) (mean: 0.57; error range 0.19–0.86), but slightly higher (i.e., weaker mitigation effect) than the IPCC’s SF for multiple aeration of 0.52 (error range: 0.41–0.66; IPCC Citation2006).
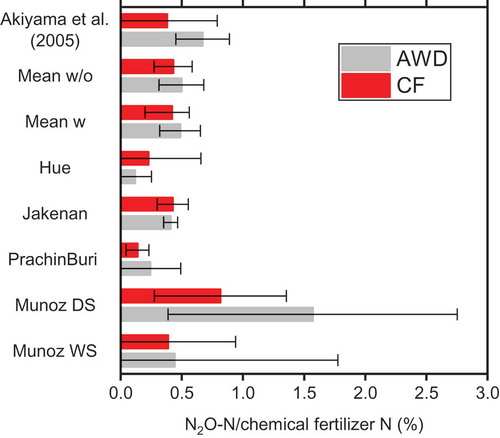
The mean ratio of seasonal N2O-N emission to inorganic fertilizer N applied across sites was 0.42% under CF and 0.49% under AWD including Muñoz WS (). These were comparable to those derived from the original data in Akiyama et al. (Citation2005) (0.38 ± 0.41% under CF and 0.67 ± 0.22% under mid-season drainage; the error range expressed as 95% CIs recalculated from the original data). However, as indicated by the overlap of the 95% CIs, the ratio under AWD did not differ from that under CF in all sites. This agrees with the results of ANOVA that showed no significant effect of WM on N2O emissions ().
Figure 6. The ratio of seasonal N2O-N emissions to the total amount of chemical fertilizer N applied. Data for dry season and wet season are shown separately for Muñoz. Mean data in dry and wet seasons are shown for Hue, Jakenan, and Prachin Buri. Means overall sites and seasons with and without Muñoz wet season are separately shown. The horizontal bars indicate the 95% confidence intervals.
4. Discussion
4.1. Generalities and site-specificities of soil drying under AWD
This study used the five criteria to quantitatively describe site-specificities in AWD implementation (). AWD successfully reduced the seasonal CH4 emission at varying levels, except for Muñoz WS and Prachin Buri WS (). In Prachin Buri and Muñoz, AWD was unsuitable during WS due to the frequent rainfall and the slow drainability of clayey soils. On the other hand, AWD was effective during WS as well as DS in Hue and Jakenan, both of which had a loamy soil.
Using the derived multiple regression equation for Hue and Jakenan data (Eq. 1), it was extrapolated that a 30% reduction in CH4 emission (i.e., SFCH4-AWD = 0.70) is more likely to be achieved with the safe AWD water level threshold of −15cm when NNFD is >32 (solid line in ). However, this relationship held only to the loamy soils in this study. Although large variabilities in CH4 emission reduction through AWD or multiple aeration have been reported elsewhere (Sander et al. Citation2015), the corresponding data on surface water level were not often documented, making it difficult to explain the variability. Our results demonstrated, for the loamy soils of Hue and Jakenan, that the observation of surface water level and NNFD can improve the precision in SFCH4-AWD estimation.
4.2. Environmental and soil properties affecting the extent of GHG mitigation by AWD
The loamy soils of Hue and Jakenan exhibited faster drainability of surface water than the clayey soils of Muñoz and Prachin Buri (), thereby enabling frequent short-term drainage events. For this reason, loamy soils may be regarded more suitable for CH4 emission reduction by AWD implementation. Yagi et al. (Citation1996) demonstrated that short-term (i.e., the period from disappearance of floodwater to re-flooding was short—only about a week) drainage practices strongly reduced CH4 emissions from Japanese rice paddy fields and that CH4 emission rates significantly decreased with an increase in the percolation rates (Yagi et al. Citation1998). On the other hand, the clayey soils of Prachin Buri and Muñoz DS achieved more water savings (17–47%) than the loamy soils of Jakenan and Hue (6–15%) through AWD (). Water use was the highest among the four sites in Muñoz DS under CF, but was the lowest under AWD. Thus, water saving efficiency under AWD was higher in the clayey soils than in the loamy soils.
Higher soil C content, organic fertilizer amendment, and lower C:N mole ratio that allows faster decomposition of soil organic matter are the major contributing factors to the highest CH4 emission observed in Hue among sites. Moreover, Hue soil had the most reduced soil condition (). Although Prachin Buri soil had the highest soil C content, the observed CH4 emission was the lowest (13.4 kg CH4 ha−1). The soil pH(H2O) and pH(H2O2) measurements () confirmed that it is an acid sulfate soil (Ahern et al. Citation1998). The soil active Fe content in Prachin Buri was also the highest among sites (). The presence of sulfate and active Fe slows down soil reduction and CH4 production, by acting as oxidizing agents in paddy soils (Takai et al. Citation1963; Inubushi et al. Citation1997; Yagi et al. Citation1997). In Thai paddy fields, CH4 emission during a rice growing period ranged from 53 to 787 kg CH4 ha−1 in freshwater alluvial soils whereas only 8–227 kg CH4 ha−1 in an acid sulfate soil (Jermsawatdipong et al. Citation1994). Jugsuhinda et al. (Citation1996) suggested that CH4 and CO2 productions in flooded acid sulfate soils of Thailand were primarily governed by soil oxidation-reduction potential (Eh) and pH, and reported that the critical Eh and pH levels at which CH4 emission occurred were −150 mV and 6.1, respectively. Therefore, low soil pH, which limits soil reduction and the subsequent CH4 production, was the possible factor for the low CH4 emission in Prachin Buri.
Jakenan soil had the lowest soil total C content among sites () but the EFCH4-CF was the second largest after Hue () due mainly to the application of farmyard manure. Without the manure application, EFCH4-CF was 2.7 kg ha−1 d−1 in the same site (Pramono and Setyanto Citation2015). Muñoz soil had higher total C and active Fe and Mn contents than Jakenan soil (). Although higher soil organic C can increase CH4 production and emission, higher active Fe and Mn contents, on the other hand, can reduce CH4 emission (Ali et al. Citation2009; Smakgahn et al. Citation2009). Thus, in Muñoz DS, the high Fe and Mn contents would have primarily contributed to the low EFCH4-CF. On the other hand, reasons for the high CH4 emissions in Muñoz WS were provided by Sibayan et al. (Citation2018) as follows: (1) higher mean air temperature in WS than in DS enhanced the release of rice root exudates (i.e., C substrates for CH4 production) into the soil; (2) greater amount of rice residues (i.e., C substrates) coming from the previous DS crop was incorporated during WS; and (3) considerable amount of rainfall in WS resulted in higher surface water levels both under CF and AWD. In the same Muñoz site, Corton et al. (Citation2000) reported 2–3 times higher CH4 emissions during WS compared to DS.
Production of N2O in the soil results primarily from microbial nitrification and denitrification processes. Major drivers of these processes are carbon and nitrogen substrate availability, temperature, pH, and moisture content (Mosier et al. Citation1998; Bouwman et al. Citation2002; Linquist et al. Citation2012; Rochette et al. Citation2008). A laboratory study showed that N2O emission occurred at a redox value of 0 mV (Kralova et al. Citation1992) while Granli and Bøckman (Citation1994) reported that the soil water content associated with maximum N2O emission was close to the field capacity, suggesting that AWD implementation may stimulate N2O emissions. Increased N2O emissions under AWD were observed in Jakenan WS, Muñoz, and Prachin Buri but which were not enough to completely offset the reductions in CH4 emission; while no increase in N2O emission was observed in Hue even with AWD. Yagi et al. (Citation1996) also reported very low N2O emissions from a Japanese paddy field under intermittent irrigation similar to that in Jakenan. It has been reported that clayey soils tend to exhibit greater N2O emissions than sandy soils (Brentrup et al. Citation2000). This agrees with the higher N2O emissions observed in the clayey soils of Muñoz and Prachin Buri than in the loamy soils of Hue and Jakenan.
The contributions of N2O to the total GWP of CH4+N2O under AWD were only 0.8 and 3.5% in the loamy soils of Hue and Jakenan, respectively, but were much higher in the clayey soils of Prachin Buri and Muñoz during DS (44 and 40%, respectively). The oxygen and moisture status in agricultural soils depends on soil texture and drainage. Fine textured soils have more capillary pores within aggregates holding water more tightly than do coarse soils. As a result, anaerobic conditions may be easily developed and maintained for longer periods within the aggregates, thereby creating more suitable conditions for denitrification than in coarse textured soils (Bouwman et al. Citation2002). In Muñoz, a large increase in N2O emissions under AWD during DS occurred just after N fertilization, especially when the soil was not irrigated (Sibayan et al. Citation2018). In the loamy soils of Hue and Jakenan, the N2O emissions were minimized by keeping soil flooded after N fertilizer application as shown in a study by Furukawa et al. (Citation2007).
4.3. Trade-offs and co-benefits from AWD
The trade-off between CH4 and N2O emissions under AWD (i.e., increase in N2O contribution to GWP) was observed in all the four sites, but the degree of which was not enough to offset the CH4 emission reduction (). However, N2O contribution to GWP was considerably high in Muñoz DS and Prachin Buri because the magnitude of CH4 emissions was relatively low among sites and as compared to IPCC’s default EFs (). This study also found that total C content in the topsoil was not significantly decreased by AWD implementation in all the sites after the 3-year field trials (). The dynamics in soil C is often overlooked in a field study, especially in tropical region; however, this field campaign demonstrated that multiple soil aerated conditions developed by AWD have no negative impact on the total C content in the topsoil at least for 3 years.
It should be noted that the AWD implementation did not significantly reduce rice grain yield (). Lampayan et al. (Citation2004) argued that safe AWD with the threshold of −15 cm would not cause any yield reduction because rice roots would still be able to uptake water from the saturated soil. Our results therefore confirmed the findings of Lampayan et al. (Citation2004). In addition, AWDS that modified to a greater or lesser extent from AWD also exhibited no significant yield penalty.
AWD successfully achieved the water saving and improved the water productivity in all the sites, especially in Muñoz DS (). This result supports the original purpose of implementing (safe-)AWD (Bouman et al. Citation2007). However, the degree of water saving differed between soil types (clayey vs. loamy). Furthermore, this study found that the degree of water saving was not always consistent with that of CH4 emission reduction in the absolute value. That is, high water savings through AWD do not always translate to high CH4 emission reduction due to a greater influence of soil properties. This raises a question that what benefits we expect for implementing AWD. Because AWD is known as a mitigation option for paddy GHG emissions so far, the primary role of AWD is now being questioned.
4.4. Implications to GHG inventories
The emission-related parameters estimated in this study represent practical ones since they were obtained in the 3-year field trial with varying weather conditions. These parameters can be applied to estimate CH4 emissions in GHG inventories, when the emissions are calculated for a category of paddy fields in which AWD or similar intermittent flooding management were conducted, especially in tropical regions. Also, those parameters are expected to apply for evaluating the effects of alternative water management in rice cultivation as a GHG mitigation option in various GHG mitigation schemes, such as UNFCCC Clean Development Mechanisms, national appropriate mitigation actions, and other emission trading approaches.
The EFsCH4 obtained in this study greatly varied against the IPCC’s default values () partly because they were obtained under site-specific management practices. This result also indicates that the effect of soil type (clayey or sandy, and acid sulfate soil) should be carefully reflected into the national GHG inventory in the relevant country.
The higher SFCH4-AWD (i.e., lower CH4 mitigation effect) than the IPCC’s default SF for multiple aeration partly resulted from varying weather conditions during the field experiment in four sites (). Minamikawa et al. (Citation2014) conducted a long-term (20 years) model simulation to estimate the effect of prolonged mid-season drainage on CH4 emission reduction across nine sites in Japan and found that the simulated mean effect (20.1% reduction compared to normal mid-season drainage) was lower than the observed effect in the 2-year field experiment (30.5%; Itoh et al. Citation2011). The results of this study and Minamikawa et al. raise a question that the IPCC’s default SFs for water regime may be an overestimation of the actual CH4 emission reduction. It is necessary to distinguish between the best-effort SF (as IPCC’s) and the practically feasible SF (as this study’s) for accurate GHG inventory.
Supplement.docx
Download MS Word (14.9 KB)Acknowledgments
This study was funded by the Ministry of Agriculture Forestry and Fisheries (MAFF) of Japan through the International Research Project ‘Technology development for circulatory food production systems responsive to climate change: Development of mitigation option for greenhouse gases emissions from agricultural lands in Asia (MIRSA-2).’ We thank the project members, Dr. Hoa Tran Dang from Hue University of Agriculture and Forestry, Vietnam; Dr. Prihasto Setyanto from Central Java Assessment Institute for Agricultural Technology, Indonesia; Dr. Amnat Chidthaisong from Joint Graduate School of Energy and Environment, King Mongkut’s University of Technology Thonburi, Thailand; and Engr. Evangeline Sibayan from Philippine Rice Research Institute for providing the data from the field experiments. We also thank Dr. Yusuke Takata (NARO, Japan) for evaluating the soil profiles from each study site. The SAS analyses were run on the supercomputer of Agriculture, Forestry and Fisheries Research Information Technology Center (AFFRIT), MAFF, Japan.
Supplemental data
Supplemental data can be accessed here.
Additional information
Funding
Related Research Data
References
- Adhya TK, Rath AK, Gupta PK, Rao VK, Das SK, Parida KM, Parashar DC, Sethunathan N 1994: Methane emission from flooded rice fields under irrigated conditions. Biol. Fertil. Soils, 18, 245–248. doi:10.1007/BF00647675
- Ahern CR, Stone Y, Blunden B 1998: Acid sulfate soils assessment guidelines. In Acid Sulfate Soil Management Advisory Committee, Ed. Acid Sulfate Soil Management Advisory Committee, pp. 56–58. Wollongbar, NSW.
- Ahmad S, Chengfang L, Guangzhao D, Zhan M, Wang J 2009: Greenhouse gas emission from direct seeding paddy field under different rice tillage systems in central China. Soil Tillage Res., 106, 54–61. doi:10.1016/j.still.2009.09.005
- Akiyama H, Yagi K, Yan X 2005: Direct N2O emission from rice paddy fields: summary of available data. Glob. Biogeochem. Cycles, 19(1), GB1005. doi:10.1029/2004GB002378
- Ali MA, Lee CH, Kim SY, Kim PJ 2009: Effect of industrial by-products containing electron acceptors on mitigating methane emission during rice cultivation. Waste Manag., 29, 2759–2764. doi:10.1016/j.wasman.2009.05.018
- Asami T, Kumada K 1959: A new method for determining free iron in paddy soils. Soil Plant Food, 5, 141–146. doi:10.1080/00380768.1959.10430907
- Bouman BAM, Lampayan RM, Tuong TP 2007: Water Management in Irrigated Rice: Coping with Water Scarcity, 54 p. International Rice Research Institute, Los Baños, Philippine.
- Bouwman AF, Boumans LJM, Batjes NH 2002: Modeling global annual N2O emissions from fertilized fields. Global Biogeochem. Cycles, 16(4), 1080. doi:10.1029/2001GB001812
- Box GEP, Cox DR 1964: An analysis of transformations. J. Roy. Stat. Soc. B, 26, 211–252.
- Brentrup F, Küsters J, Lammel J, Kuhlmann H 2000: Methods to estimate on-field nitrogen emissions from crop production as an input to LCA studies in the agricultural sector. Int. J. LCA, 5, 349–357. doi:10.1007/BF02978670
- Chidthaisong A, Cha-Un N, Rossopa B, Buddaboon C, Kunuthai C, Sriphirom P, Towprayoon S, Tokida T, Padre A, Minamikawa K 2018: Evaluating the effects of alternate wetting and drying (AWD) on methane (CH4) and nitrous oxide (N2O) emissions from a paddy field in Thailand. Soil Sci. Plant Nutr, doi:10.1080/00380768.2017.1399044
- Conen F, Smith KA, Yagi K 2010: Rice cultivation. In Methane and Climate Change, Eds. Reay D, Smith P, van Amstel A, pp. 115–135. Earthscan Ltd., London.
- Corton TM, Bajita JB, Grospe FS, Pamplona RR, Asis CA Jr, Wassmann R, Lantin RS, Buendia LV 2000: Methane emissions from irrigated and intensively managed rice fields in Central Luzon (Philippines). Nutr. Cycl. Agroecosyst., 58, 37–53. doi:10.1023/A:1009826131741
- Fox J, Weisberg S 2011: An R Companion to Applied Regression. Sage, Thousand Oaks, CA.
- Furukawa Y, Hosen Y, Rodriquez R, Agbisit R 2007: Effect of timing of N topdressing and irrigation on CH4 and N2O emissions under the AWD management. In Annual Review and Planning Meeting. IRRI-Japan Project, Eds. Hosen Y, pp. 94–106. International Rice Research Institute, Los Baños, Philippines.
- Gogoi N, Baruah A, Gogoi B, Gupta PK 2008: Methane emission from two different rice ecosystems (Ahu and Sali) at lower brahmaputra valley zone of north east India. Appl. Ecol. Environ. Res., 6, 99–112. doi:10.15666/aeer/0603_099112
- Granli T, Bøckman OC 1994: Nitrous oxide from agriculture. Norwegian J. Agri. Sci. Supp., 12, 1–128.
- Harada H, Kobayashi H, Shindo H 2007: Reduction in greenhouse gas emissions by no-tilling rice cultivation in Hachirogata polder, northern Japan: life-cycle inventory analysis. Soil Sci. Plant Nutr., 53, 668–677. doi:10.1111/j.1747-0765.2007.00174.x
- Hou AX, Chen GX, Wang ZP, Cleemput VO, Patrick WH Jr 2000: Methane and nitrous oxide emissions from a rice field in relation to soil redox and microbiological processes. Soil Sci. Soc. Am. J., 64, 2180–2186. doi:10.2136/sssaj2000.6462180x
- Inubushi K, Hori K, Matsumoto S, Wada H 1997: Anaerobic decomposition of organic carbon in paddy soil in relation to methane emission to the atmosphere. Water Sci. Tech., 36, 523–530.
- IPCC 2006: 2006 IPCC Guidelines for National Greenhouse Gas Inventories Volume 4: agriculture, Forestry and Other Land Use. Eds. Eggleston S, Buendia L, Miwa K, Ngara T, Tanabe K. Institute for Global Environmental Studies (IGES), Hayama, Japan.
- Ishibashi E, Yamamoto S, Akai N, Tsuruta H 2009: The influence of no-till direct seeding cultivation on greenhouse gas emissions from rice paddy fields in Okayama, western Japan 5: annual emission of CH4, N2O and CO2 from rice paddy fields under different cultivation methods and carbon sequestration into paddy soils. Jpn. J. Soil Sci. Plant Nutr., 80, 123–135. (in Japanese with English summary).
- Itoh M, Sudo S, Mori S et al. 2011: Mitigation of methane emissions from paddy fields by prolonging midseason drainage. Agric. Ecosyst. Environ., 141, 359–372. doi:10.1016/j.agee.2011.03.019
- Jermsawatdipong P, Murase J, Prabuddham P, Hasathon Y, Khomthong N, Naklang K, Watanabe A, Haraguchi H, Kimura M 1994: Methane emission from plots with differences in fertilizer application in thai paddy fields. Soil Sci. Plant Nutr., 40, 63–71. doi:10.1080/00380768.1994.10414279
- Jiao Z, Hou A, Shi Y, Huang G, Wang Y, Chen X 2007: Water management influencing methane and nitrous oxide emissions from rice field in relation to soil redox and microbial community. Comm. Soil Sci. Plant Anal., 37, 1889–1903. doi:10.1080/00103620600767124
- Jugsuhinda A, Delaune RD, Lindau CW, Sulaeman E, Pezeshki SR 1996: Factors controlling carbon dioxide and methane production in acid sulfate soils. Water Air Soil Pollut., 87, 345–355. doi:10.1007/BF00696846
- Kenward MG, Roger JH 1997: An improved approximation to the precision of fixed effects from restricted maximum likelihood. Comput. Stat. Data Anal., 53, 2583–2595. doi:10.1016/j.csda.2008.12.013
- Kimura M, Ando H, Haraguchi H 1991: Estimation of potential CO2 and CH4 production in Japanese paddy fields. Environ Sci., 4, 15–25.
- Ko YK, Lee JS, Kim MT, Kang HW, Kang UG, Lee DC, Shin YG, Kim KY, Lee KB 2002: Effects of cultural practices on methane emission in tillage and no-tillage practices from rice paddy fields. Korean J. Sci. Fertil., 35, 216–222.
- Kralova M, Masscheleyn PH, Lindau CW, Patrick WH Jr 1992: Production of dinitrogen and nitrous oxide in soil suspensions as affected by redox potential. Water Air Soil Poll., 61, 31–47. doi:10.1007/BF00478364
- Kumar J, Viyol SV 2009: Short-term diurnal and temporal measurement of methane emission in relation to organic carbon, phosphate and sulphate content of two rice fields of central Gujarat, India. Paddy Water Environ., 7, 1116.
- Lampayan RM, Bouman BAM, de Dios JL et al. 2004: Adoption of water saving technologies in rice production in the Philippines. Food and Fertilizer Technology Center Extension Bulletin 548, 15pp. FFTC, Republic of China on Taiwan.
- Linquist BA, Adviento-Borbe MA, Pittelkow CM, Kessel C, Groenigen KJ 2012: Ferilizer management practices and greenhouse gas emissions from rice systems: a quantitative review and analysis. Field Crops Res., 135, 10–21. doi:10.1016/j.fcr.2012.06.007
- Littell RC, Stroup WW, Milliken GA, Wolfinger RD, Schabenberger O 2006: SAS for Mixed Models, 2nd Edition. SAS Institute, Cary, NC.
- Minami K, Neue HU 1994: Rice paddies as a methane source. Clim. Change, 27, 13–26. doi:10.1007/BF01098470
- Minamikawa K, Fumoto T, Itoh M, Hayano M, Sudo S, Yagi K 2014: Potential of prolonged midseason drainage for reducing methane emission from rice paddies in Japan: a long-term simulation using the DNDC-Rice model. Biol. Fertil. Soils, 50, 879–880. doi:10.1007/s00374-014-0909-8
- Minamikawa K, Tokida T, Sudo S, Padre A, Yagi K 2015: Guidelines for Measuring CH4 and N2O Emissions from Rice Paddies by a Manually Operated Closed Chamber Method. National Institute for Agro-Environmental Sciences, Tsukuba, Japan.
- Mosier AR, Kroeze C, Nevison C, Oenema O, Seitzinger S, Van Cleemput O 1998: Closing the global N2O budget: nitrous oxide emissions through the agricultural nitrogen cycle. OECD/IPCC/IEA phase II development of IPCC guidelines for national greenhouse inventory methodology. Nutr. Cycl. Agroecosys., 52, 225–248. doi:10.1023/A:1009740530221
- Myhre G, Shindell D, Breon FM et al. 2013: Anthropogenic and natural radiative forcing. In Climate Change 2013: the Physical Science Basis. Contribution of Working Group I to the Fifth Assessment Report of the of the Intergovernmental Panel on Climate Change, Eds. Stocker TF, Qin D, Plattner GK, Tignor M, Allen SK, Boschung J, Nauels A, Xia Y, Bex V, Midgeley PM. Cambridge University Press, Cambridge, UK and New York, NY.
- Pramono A, Setyanto P 2015: CH4 emission on integrated crop and livestock system. Proceedings of National Seminar on Information and Mapping of Land Resources System Supporting to Self Food Sufficiency, 29–30 July 2015, IAARD, Indonesian Ministry of Agriculture, Bogor, pp.283–290.
- Rochette P, Angers DA, Chantigny MH, Gagnon B, Bertrand N 2008: N2O fluxes in soils of contrasting textures fertilized with liquid and solid dairy cattle manures. Can J. Soil Sci., 88, 175–187. doi:10.4141/CJSS06016
- Rosenberg M, Adams DC, Gurevitch J 2000: Statistical Software for Meta-Analysis, Version 2.1 Release 5.1. Sinauer Associates Inc., Sunderland, MA.
- Sander BO, Wassmann R, Siopongco JDLC 2015: Mitigating greenhouse gas emissions from rice production through water-saving techniques: potential, adoption and empirical evidence. In Climate Change and Agricultural Water Management in Developing Countries, Eds. Hoanh CT, Smakhtin V, Johnston T, pp. 193–207, CABI, Oxford.
- Setyanto P, Pramono A, Adriany TA, Susilawati HL, Tokida T, Padre A, Minamikawa K 2018: Alternate wetting and drying reduces methane emission from a rice paddy in Central Java, Indonesia without yield loss. Soil Sci. Plant Nutr. doi:10.1080/00380768.2017.1409600
- Sibayan E, Pascual K, Grospe F, Casil ME, Tokida T, Padre A, Minamikawa K 2018: Effects of alternate wetting and drying technique on greenhouse gas emissions from irrigated rice paddy in Central Luzon Philippines. Soil Sci. Plant Nutr.doi:10.1080/00380768.2017.1401906
- Smakgahn K, Fumoto T, Yagi K 2009: Validation of revised DNDC model for methane emissions from irrigated rice fields in Thailand and sensitivity analysis of key factors. J. Geophys. Res., 114, G02017. doi:10.1029/2008JG000775
- Takai Y, Koyama T, Kamura T 1963: Microbial metabolism in reduction process of paddy soils (Part 2) Effect of iron and organic matter on the reduction process (1). Soil Sci. Plant Nutr., 9, 10–14. doi:10.1080/00380768.1963.10431049
- Tran DH, Hoang TN, Tokida T, Padre A, Minamikawa K 2018: Impacts of alternate wetting and drying on greenhouse gas emission from paddy field in Central Vietnam. Soil Sci. Plant Nutr.doi:10.1080/00380768.2017.1409601
- Wang Z, Delaune RD, Masscheleyn PH, Patrick WH Jr 1993: Soil redox and pH effects on methane production in a flooded rice soil. Soil Sci. Soc. Am. J., 57, 382–385. doi:10.2136/sssaj1993.03615995005700020016x
- Wassmann R, Dobermann A 2006: Greenhouse gas emission from rice fields: what do we know and where should we head for? The 2nd Joint International Conference on Sustainable Energy and Environment (SEE 2006), 21–23 November 2006, Bangkok, Thailand.
- Wassmann R, Neue HU, Lantin RS, Buendia LV, Rennenberg H 2000a: Characterization of methane emissions from rice fields in Asia. I. Comparison among field sites in five countries. Nutr. Cycl. Agroecosyst., 58, 1–12. doi:10.1023/A:1009848813994
- Wassmann R, Neue HU, Lantin RS, Makarim K, Chareonsilp N, Buendia LV, Rennenberg H 2000b: Characterization of methane emissions from rice fields in Asia. II. Differences among irrigated, rainfed, and deepwater rice. Nutr. Cycl. Agroecosyst., 58, 13–22. doi:10.1023/A:1009822030832
- Yagi K, Minami K 1990: Effect of organic matter application on methane emission from some Japanese rice fields. Soil Sci. Plant. Nutr., 36, 599–610. doi:10.1080/00380768.1990.10416797
- Yagi K, Minami K, Ogawa Y 1998: Effects of water percolation on methane emission from rice paddies: a lysimeter experiment. Plant Soil, 198, 193–200. doi:10.1023/A:1004379914540
- Yagi K, Tsuruta H, Kanda K, Minami K 1996: Effect of water management on methane emission from a Japanese paddy field: automated methane monitoring. Global Biogeochem. Cycles, 10, 255–267. doi:10.1029/96GB00517
- Yagi K, Tsuruta H, Minami K 1997: Possible options for mitigating methane emission from rice cultivation. Nutr. Cycl. Agroecosys., 49, 213–220. doi:10.1023/A:1009743909716
- Yan X, Yagi K, Akiyama H, Akimoto H 2005: Statistical analysis of the major variables controlling methane emissions from rice fields. Global Change Biol., 11, 1131–1141. doi:10.1111/j.1365-2486.2005.00976.x
- Yang SS, Chang S 1998: Effect of environmental conditions on methane production and emission from paddy soil. Agric. Ecosyst. Environ., 69, 69–80. doi:10.1016/S0167-8809(98)00098-X
- Yao H, Conrad R, Wassmann R, Neue HU 1999: Effects of soil characteristics on sequential reduction and methane production in sixteen rice paddy soils from China, Philippines and Italy. Biogeochemistry, 47, 269–295. doi:10.1007/BF00992910