
ABSTRACT
Soil chemical properties are closely related to crop production levels. Understanding the relationships between soil nutrients and different yield levels is important for improving the efficiency of fertilization management programs. The objectives of this study were to understand the key soil nutrient requirements for different crop yield levels using 10 experimental wheat-maize rotation sites and to optimize fertilization applications in North China. The results found significant differences between the soil chemical properties among the study sites, with average contents in the range of 10.07–14.72 g/kg for soil organic carbon (SOC), 0.38–1.29 g/kg for total nitrogen (TN), 56.43–89.77 mg/kg for available nitrogen (AN), 17.36–48.54 mg/kg for available phosphorus (AP), 79.4–184.5 mg/kg for available potassium (AK), 0.78–5.97 mg/kg for soil Cu, and 0.75–2.20 mg/kg for soil Zn. The soil pH values were 6.46–8.19. Significant correlations (p < 0.05) were found between high-level yields and higher contents of SOC, TN, AN, and AP when a suitable soil pH were present. The higher levels of soil SOC and TN were important for maintaining high-level yields in these regions. Soil AN and pH are two key limitations that could significantly (p < 0.05) improve medium-level yields. Although some soil indicators, including SOC, TN, AN, AP, soil pH, soil Zn, and Cu could significantly influence low-level yields, soil amendments with C, N, and available P and having a suitable soil pH were especially important for improving low-level yields. These results could be used to improve conventional methods of fertilization management and increase the efficiency of fertilizer use in North China.
1. Introduction
Nutrient imbalances in agricultural soils and excessive inputs of chemical fertilizers are severe problems in Chinese that have led to soil degradation, decreased fertilizer efficiency, reduced soil carbon sequestration, and increased environmental pollution (Vitousek et al. Citation2009; Zeng et al. Citation2014; Godfray et al. Citation2010). Soil nutrient tests and formulated fertilizers are effective methods for increasing fertilization efficiency (Hou et al. Citation2010), which will help reduce the use of fertilizers and improve their application (Shaw et al. Citation2016), especially in China (Gao Citation2008). Increasing crop production continues to remains an urgent and high priority issue. Developing sustainable agriculture programs in China will require simultaneously improving crop yield and soil fertility while reducing environmental risks (Ju et al. Citation2009).
Previous studies have demonstrated that regional differences of soil chemical properties significantly impact crop production at a local scale (Bogunovic et al. Citation2014; Neugschwandtner et al. Citation2014; Zhang et al. Citation2016). Understanding the relationships between yield levels and soil nutrients in different regions can optimize fertilization management and reduce unnecessary fertilizer inputs. Additionally, such knowledge could be used for establishing fertilization standards (Cui et al. Citation2008). The levels of soil C, N, other available nutrients, and soil pH can affect crop yield levels, especially in lower level yield areas (Zhang et al. Citation2016). Therefore, the objectives of this study were to evaluate the relationships between soil chemical properties and different yield levels, and to understand the key soil nutrients requirement for different yield levels to optimize fertilizer application in the North China Plain.
2. Material and methods
2.1. Study sites
Data on different soil properties and annual total yield were collected at 10 study sites: Juye, Donggang, Linyi, Lijin, Laiyang, Daiyue, Huimin, Longkou, Pingyuan and Caoxian. These sites are representative regions with different crop yield levels for Shandong Province in the North China Plain. Each site is part of an experiment studying a long-term crop rotation system of winter wheat (Triticum turgidum L.) and summer maize (Zea mays L.). lists the soil, climate, and crop rotation information at each site. Every year, each site has been fertilized with 525 kg N/ha, 300 kg P2O5/ha, and 180 kg K2O/ha, and irrigated with 180 mm water during the growing season. The wheat and maize residues were returned to the soils.
Table 1. Soil, climate, and crop details at the different study sites
2.2. Sample collection and analysis of soil and crop yield
During 2015 and 2016, 565 samples were collected from the 10 study sites that had been in the crop rotation experiment for more than 5 years plus representative plots that had significant differences in crop yield. Soil samples were collected from the top 30 cm after the maize was harvested. Soil organic carbon (SOC), total nitrogen (TN), available nitrogen (AN), available phosphorus (AP), available potassium (AK), soil pH, soil Zn, and soil Cu were analyzed using the methods of Bao (Citation2000). The total annual crop yield for all samples were used to partitioned the 10 study sites into 3 levels: high-level yield (H-level: annual yield greater than 15.75 t/ha), medium-level yield (M-level: annual yield of 12.00–15.75 t/ha) and low-level yield (L-level: annual yield less than 12.00 t/ha). These groupings were based on a previous study of wheat and maize cropping system yield levels in this region (Chen et al. Citation2015). H-level, M-level and L-level represent 56.0%, 29.0% and 15.0%, respectively, of the sample points ().
Table 2. Number of samples collected at each study site
2.3. Statistical analyses
An analysis of variance using SPSS software (SPSS Inc., Chicago, IL, USA) was used to analyze the data. Differences between sampling sites in soil parameters and crop yields were considered significant at the p < 0.05 or p < 0.01 levels. A correlation analysis was conducted with the SPSS 22.0 procedure, with the data being mapped using Sigma Plot 10.0 (Systat Software, Inc., Chicago, IL, USA). The key soil chemical properties associated with the different yield levels were confirmed using principal components analysis (PCA).
3. Results
3.1. Differences in soil chemical properties
The highest SOC and TN contents, 2–46.1% and 27.7 ~ 239.5%, respectively, were observed at Longkou, where both contents were higher than those in the other nine sites (). There were 1.6 ~ 2.8 times differences in the contents of soil AN, AP and AK between the highest and the lowest sites. The average content of AN at Caoxian, Longkou, Pingyuan and Juye were significantly higher than that in the other sites (). Soil Zn and Cu content at all sites ranged from 0.44 to 5.97 mg/kg and 0.75 to 2.20 mg/kg, respectively. Additionally, soil pH values ranged from 6.4 to 6.9 at Donggang, Laiyang, Daiyue and Longkou, with values between 7.8 and 8.2 being observed at Juye, Linyi, Lijin, Huimin and Caoxian.
Table 3. Soil chemical properties at each study site
3.2. Differences in annual total yield
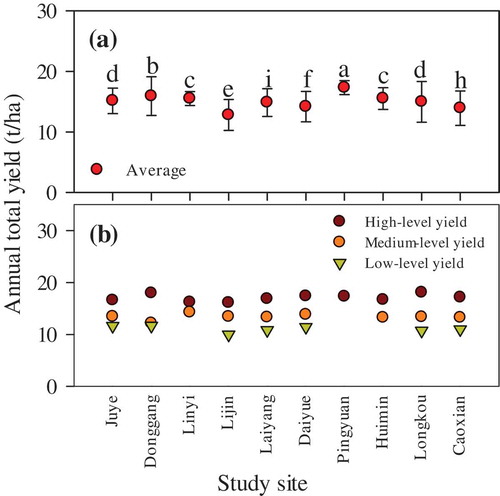
The average of annual total yields (AY) for all study sites were 12.8 ~ 17.3 t/ha ()). The highest yield was measured at Pingyuan, which was 9–35% higher than that in the other sites. A comparison of the three AY at the 10 sites indicated that the average H-level, M-level and L-level AY were in the range 16.1–18.1 t/ha, 12.17–14.26 t/ha and 9.98–11.66 t/ha, respectively ()). The highest and lowest AY were observed at Longkou (18.1 t/ha) and Lijin (9.98 t/ha).
Figure 1. Average annual total yields at the different sample sites
3.3. Correlation between soil chemical properties and annual total yield
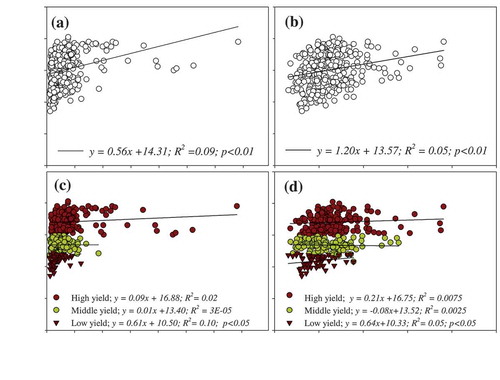
Significant positive correlations were observed between AY and SOC contents (), p < 0.05), especially for the H-level and L-level sites (), p < 0.05). However, there was no significant correlation between the M-level AY and SOC (R2 = 0.02). Similar correlation results were found between AY and soil TN (). Significantly positive correlations were found between AY, and soil AN and AP contents (, p < 0.05). This was especially significant for soil AN, which had a positive impact on M-level yields (), p < 0.05). The H-level yields were significantly related to the contents of soil AN and AP (, p < 0.05). A significant correlation was also observed between soil pH and AY (, p < 0.05). Soil pH values between 6.8 and 7.8 was best correlated with AY for the H-level group, whereas for the L-level group AY were best correlated with soil pH values of 5.0–6.8 and 7.9–8.5. Soil Zn (), p < 0.01) and Cu (), p < 0.01) contents significantly influenced the AY. Although the soil Zn and Cu contents did not significantly affect H-level or M-level AY, they significantly affected the L-level AY at same sites (, p < 0.05).
Figure 2. Correlations between total annual yield and SOC
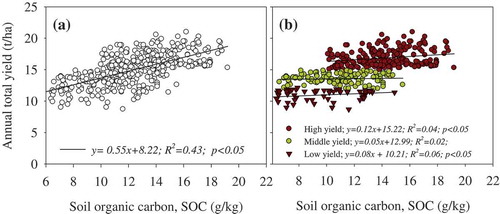
Figure 3. Correlations between total annual yield and soil total N
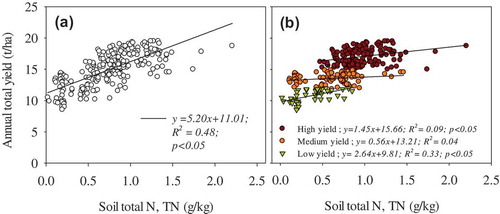
Figure 4. Correlations between total annual yield and soil available N, P, and K
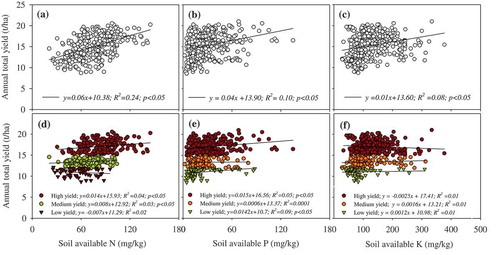
Figure 5. Correlation between total annual yield and soil pH
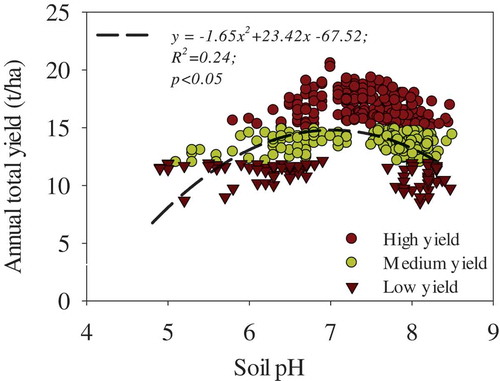
Figure 6. Correlations between total annual yield and soil Zn and Cu
3.4. Principal component analysis
The effects of key soil properties on the different yield levels were analyzed by principal components analysis (). The principal components under the different yield levels were selected using eigenvalues and contributing ratios, and these components explained 87.88%-91.54% of the variation in the data. The first two components in the H-level yields were significantly correlated with SOC, soil TN, and soil AN contents according the factor loading matrix. Soil AN and soil pH contributed 58.53% and 33.01% in PC1 and PC2 under the M-level yield, respectively. The L-level yield was correlated with SOC, soil AN, soil TN, and soil pH, indicating these properties as key factors that could increase yield.
Table 4. Loading matrix, eigenvalues, and contributing ratios of the principal components
4. Discussion
Although the same crop rotation system, residue management, and fertilization rates were used in this study, there were significant differences in SOC and TN contents between the 10 study sites (). These differences had significant positive impacts on H-level and L-level AY ( and ), and are similar to the results of Lenka and Lal (Citation2013) and Tian et al. (Citation2016). Although soil SOC and TN contents have been shown as key factors for crop yields in previous studies (Feng et al. Citation2014; Kaur and Singh Citation2014), there was no significant correlation between the M-level AY and SOC ()). Thus, changes in crop yield may be caused by other soil determinants (Neugschwandtner et al. Citation2014), such as soil AN and pH ( and ). Soil AN, AP and AK contents had significant positive effects on AY in this study (), which H-level AY being significantly correlated with soil AN and AP (). Some previous studies indicated that the supply for soil N and P were determined in the short term by soil AN and AP contents, which significantly influenced crop yield (Li et al. Citation2013b; Kremper et al. Citation2015). Although soil AK was closely related with AY in this study, it was not identified as a limitation factor that impacted the different yield levels ()). This is probably due to soil K contents being considered adequate for maize and wheat production in these regions, resulting in different locations using fertilizers with different K concentrations. The different K inputs would create soils with different rates of soil AK supply and uptake (Tan et al. Citation2012). The significant differences in available soil nutrients between the different regions were probably related to localized input rates of chemical fertilizers plus the existing soil conditions (Gao et al. Citation2006; Jiang, Liang, and Zhang Citation2005; Guo et al. Citation2010). Therefore, the lack of an adequate quantitative fertilizer management program has led to various issues, such as excessive fertilizer inputs, soil nutrient imbalances, and soil degradation (Bogunovic et al. Citation2014). These factors increase the variability in soil chemical properties in different regions (Li Citation2012). The yield levels were correlated with soil pH in the different regions (). For example, H-level AY were only correlated with soil pH values ranging from 6.8–7.8, whereas some acidified soils (5.0–6.8) or moderately alkaline soils (7.9–8.5) were correlated with the M-level and L-level groups and was also found by Zeng et al. (Citation2014). Soil Zn and Cu are two essential micronutrients for plant development (Symanowicz et al. Citation2015). They significantly influenced AY in this study (), with soil Zn and Cu concentrations having significantly positive effects on L-level yield (). Previous studies indicated that soil Zn and Cu levels had positive influence on the crop yield (Gunkel, Roth, and Fabre Citation2003; Li et al. Citation2013a), especially in areas with the low soil Zn and Cu levels. In these soils crop yields increased after the applications of fertilizers with copper and zinc supplements (Gunkel, Roth, and Fabre Citation2003). Low soil Zn and Cu concentrations were measured at the L-level regions, which were likely responsible for the limited increases in AY (Gupta and Kalra Citation2006). Multiple soil properties such as soil pH, and SOC, as well as soil N fertilization, can play key roles for improving the lower yields areas with low soil Zn and Cu concentrations (Malhi and Karamanos Citation2006; Alloway Citation2009).
5. Conclusions
Significant differences in SOC, TN, AN, AP, AK, soil pH, Cu, and Zn were observed between the 10 study sites. These soil parameters significantly affected the wheat and maize yield levels. SOC, TN, AN, and AP contents, plus a suitable soil pH, were positively correlated with a high-level yield, with soil TN, AN and SOC contents having a significant influence H-level yield. Soil AN and soil pH were two crucial properties for yield at the M-level. At the L-level yield, there were significant correlations between yield and SOC, TN, AN, AP, soil pH, soil Zn and Cu. Amending soil C, N, and available P, plus adjusting soil pH, should be considered as possible methods for improving yield. Additionally, K inputs at the 10 study sites should be reduced because improving the soil AN content and soil pH were found to be more important for increasing yields in the M-level and L-level areas. These results can be used to improve conventional fertilization management, which would increase the efficiency of fertilizer use and reduce N inputs.
Disclosure statement
No potential conflict of interest was reported by the authors.
Additional information
Funding
References
- Alloway BJ 2009. “Soil factors associated with zinc deficiency in crops and humans.” Environmental Geochemistry Health 31: 537–548. doi:10.1007/s10653-009-9255-4
- Bao, S. D. 2000. Soil and Agricultural Chemistry Analysis, Bao SD. Beijing: China Agriculture Press.
- Bogunovic I, Mesic M, Zgorelec Z, Jurisic A, Bilandzija D 2014. “Spatial variation of soil nutrients on sandy-loam soil.” Soil and Tillage Research 144: 174–183. doi:10.1016/j.still.2014.07.020
- Chen, L., J. M. Hao, D. Ai, C. M. Zhu, M. Li, and L. B. Yuan. 2015. “Balanced Yield Increasing Potential of Grain and Its Spatial Differentiation in Huang-Huai-Hai Plain.” Transactions of the Chinese Society of Agricultural Engineering 31: 288–297.
- Cui ZL, Zhang FS, Chen XP, Miao YX, Li JL, Shi LW, Xu JF, Ye YL, Liu CS, Yang ZP, Zhang Q, Huang SM, Bao DJ 2008. “On-farm estimation of indigenous nitrogen supply for site-specific nitrogen management in the North China Plain.” Nutrient Cycling in Agroecosystems 81: 37–47. doi:10.1007/s10705-007-9149-8
- Feng Y, Ning T, Li Z, Han B, Han H, Li Y, Sun T, Zhang X 2014. “Effects of tillage practices and rate of nitrogen fertilization on crop yield and soil carbon and nitrogen.” Plant, Soil and Environment 60: 100–104. doi:10.17221/PSE
- Gao, X. Z. 2008. “Progress and Development for Fertilizing by Prescription Filled according to Soil Test Result in China.” Journal of Chinese Agricultural Research Regulation 29: 7–10.
- Gao, Y. M., Y. A. Tong, Z. Y. Hu, C. R. Wang, S. L. Zhang, and H. B. Zhao. 2006. “Spatial Variability of Soil Nutrients in Farmland of Loess Plateau.” Chinese Journal of Soil Science 37: 1–6.
- Godfray HCJ, Beddington JR, Crute IR, Haddad L, Lawrence D, Muir JF, Pretty J, Robinson S, Thomas SM, Toulmin C 2010. “Food security: the challenge of feeding 9 billion people.” Science 327: 812–818. doi:10.1126/science.1185383
- Gunkel P, Roth E, Fabre B 2003. “Copper distribution in chemical soil fractions and relationships with maize crop yield.” Environmental Chemistry Letters 1: 92–97. doi:10.1007/s10311-002-0003-6
- Guo JH, Liu XJ, Zhang Y, Shen JL, Han WX, Zhang WF, Christie P, Goulding KWT, Vitousek PM, Zhang FS 2010. “Significant acidification in major Chinese croplands.” Science 327: 1008–1010. doi:10.1126/science.1182570
- Gupta U, Kalra Y 2006. “Residual effect of copper and zinc from fertilizers on plant concentration, phytotoxicity, and crop yield response.” Communications in Soil Science and Plant Analysis 37: 2505–2511. doi:10.1080/00103620600822952
- Hou, Y. P., J. G. Xie, C. X. Yi, Y. B. Qin, L. L. Kong, L. Yu, K. Zhang, and X. F. Wang. 2010. “Effects of Soil Testing and Formula Fertilization on Maize Yield and Fertilizer Utilization Efficiency.” Journal of Anhui Agricultural 38: 9452–9454.
- Jiang, Y., W. J. Liang, and Y. G. Zhang. 2005. “Spatial Variability of Soil Phosphorus in Field Scale.” Chinese Journal of Applied Ecology 16: 2086–2091.
- Ju XT, Xing GX, Chen XP, Zhang SL, Zhang LJ, Liu XJ, Cui ZL, Yin B, Christie P, Zhu ZL, Zhang FS 2009. “Reducing environmental risk by improving n management in intensive Chinese agricultural systems.” Proceedings of the National Academy of Sciences 106: 3041–3046. doi:10.1073/pnas.0813417106
- Kaur J, Singh JP 2014. “Long-term effects of continuous cropping and different nutrient management practices on the distribution of organic nitrogen in soil under rice-wheat system.” Plant, Soil and Environment 60: 63–68. doi:10.17221/440/2013-PSE
- Kremper R, Zsigrai G, Kovács AB, Loch J 2015. “Long-term effect of high phosphorus doses on zinc status of maize on a non-calcareous loamy soil.” Plant, Soil and Environment 61: 1–5. doi:10.17221/509/2014-PSE
- Lenka N.K., Lal R 2013. “Soil aggregation and greenhouse gas flux after 15 years of wheat straw and fertilizer management in a no-till system.” Soil and Tillage Research 126: 78–89. doi:10.1016/j.still.2012.08.011
- Li, J. H. 2012. “Study on the Cause, Prevention and Control of Soil Acidification in China.” Journal of Agricultural Catastrophol 2: 42–45.
- Li, M. H., Z. H. Wang, Q. Li, J. Dai, Y. J. Gao, J. J. Jin, H. B. Cao, and S. Wang. 2013a. “Effects of Soil Zn Application on Grain Yield and Zn Utilization of Wheat in Zn-deficient Dryland Soils.” Journal of Agro-Environment Science 32: 2168–2174.
- Li, Y., Y. H. Feng, B. Wu, X. Y. Wang, H. T. Ji, and C. W. Li. 2013b. “Spatial Variability of Soil Nutrients and Their Relations with Rice Yield at Village Scale in Karst Mountainous Area of Guizhou Province, Southwest China.” Chinese Journal of Applied Ecology 24: 3169–3178.
- Malhi SS, Karamanos RE 2006. “A review of copper fertilizer management for optimum yield and quality of crops in the Canadian Prairie provinces.” Canadian Journal of Plant Science 86: 605–619. doi:10.4141/P05-148
- Neugschwandtner RW, Liebhard P, Kaul HP, Wagentristl H 2014. “Soil chemical properties as affected by tillage and crop rotation in a long-term field experiment.” Plant, Soil and Environment 60: 57–62. doi:10.17221/879/2013-PSE
- Shaw R, Lark RM, Williams AP, Chadwick DR, Jones DL 2016. “Characterising the within-field scale spatial variation of nitrogen in a grassland soil to inform the efficient design of in-situ nitrogen sensor networks for precision agriculture.” Agriculture, Ecosystems & Environment 230: 294–306. doi:10.1016/j.agee.2016.06.004
- Symanowicz B, Kalembasa S, Jaremko D, Niedbała M 2015. “Effect of nitrogen application and year on concentration of Cu, Zn, Ni, Cr, Pb and Cd in herbage of galega orientalis lam.” Plant, Soil and Environment 61: 11–16. doi:10.17221/558/2014-PSE
- Tan D, Jin J, Jiang L, Huang S, Liu Z 2012. “Potassium assessment of grain producing soils in North China.” Agriculture, Ecosystems & Environment 148: 65–71. doi:10.1016/j.agee.2011.11.016
- Tian SZ, Ning TY, Wang Y, Liu Z, Li G, Li ZJ, Lal R 2016. “Crop yield and soil carbon responses to tillage method changes in North China.” Soil and Tillage Research 163: 207–213. doi:10.1016/j.still.2016.06.005
- Vitousek PM, Naylor R, Crews T, David MB, Drinkwater LE, Holland EP, Johnes J, Katzenberger J, Martinelli LA, Matson PA, Nziguheba G, Ojima D, Palm CA, Robertson GP, Sanchez PA, Townsend AR, Zhang FS 2009. “Nutrient imbalances in agricultural development.” Science 324: 1519–1520. doi:10.1126/science.1170261
- Zeng YJ, Zhou QH, Lv WS, Tan XM, Pan XH, Shi QH 2014. “Effects of soil acidification on the yield of double season rice.” Acta Agronomica Sinica 40: 899–907. doi:10.3724/SP.J.1006.2014.00899
- Zhang, H. J., W. F. Chen, F. G. Song, X. Li, and H. Zhou. 2016. “Spatial Variability of Soil Nutrients and Salinity in Saline-alkali Land and Determination of Reasonable Sampling Density.” Journal of Agriculture and Environmental 33: 120–126.