
ABSTRACT
Alternative saturation and reduction are frequent in the Ultisols on aged alluvial terraces in Taiwan, which forms various redoximorphic features (RMFs) that depend on a seasonally high water table and geographic positions. The abundance and distribution of RMFs in the soil profile are criteria for the classification categories of Plinthite in Soil Taxonomy. Thus, we proposed an empirical relationship existed between regional hydrology and RMFs for soil interpretation and management on these terraces. The hydrological and pedological parameters included plinthite volume proportion (PVP, %), average annual saturated time of the year in soil (AAST, %), and average annual reduced time of the year (AART, %), which corresponded to the category levels in Soil Taxonomy of 14 reference pedons from the literatures and 14 additional pedons selected for this work in the study area. The analyses indicated that the PVP, AAST, and AART values all considerably decreased as elevation increased in the domain of <40 m above sea level (a.s.l.) in the reference pedons. The PVP generally decreased with increasing elevation in the domain of ≤50 m a.s.l. with the highest PVP was in 25–30 m a.s.l. where the AAST and AART were of medium duration. The Plinthite that meets the criteria for the great group was mainly distributed in the domain of ≤30 m a.s.l., while the Plinthite that meets the criteria for the subgroup was in the domain of 30–50 m a.s.l., according to this quantification of hydrogeomorphological information. The RMFs-based correction of the classifications for soil mapping matched the actual distribution of soil taxonomy categories. However, the fluctuations of the seasonally high water table and the soil texture were the additional factors controlling the variation of RMFs and distribution of category levels on the terraces.
1. Introduction
Soils on the terraces of quaternary aged fluvial materials in Yangmei in northwestern Taiwan are highly weathered and mainly classified as Ultisols in Soil Taxonomy. Most of the soils have been used for decades for growing lowland rice. Paddy soils have considerable potential to sequester carbon, improve water quality, and provide a habitat. Alternating soil wetness conditions controlled soil saturation and reduction conditions necessary for rice production on these terraces and caused various redoximorphic features (RMFs) in soil profiles (Hseu and Chen Citation1996, Citation2001; Jien, Hseu, and Chen Citation2004, Citation2010). RMFs formed due to alternating wet and dry cycles that occurred over a prolonged period; consequently, Fe and Mn were accumulated or depleted in soil profiles (Fanning and Fanning Citation1989; Vepraskas and Craft Citation2000; Vepraskas Citation2015).
Plinthite is an iron-rich, humus-poor mixture of clay with quartz and other minerals (Soil Survey Staff Citation2014) and is a type of RMF. Plinthite is commonly present in highly weathered soils in tropical or subtropical regions with stable land surfaces (Alexander and Cady, Citation1962; Sivarajasingham et al. Citation1962; Daniels, Gamble, and Cady Citation1971). Studies have confirmed that hydraulically restrictive horizons and slowly permeable horizons were related to or controlled plinthite formation because those horizons had perched water and induced lateral flow across the landscape (Daniels et al. Citation1978; Blume, Perkins, and Hubbard Citation1987; West et al. Citation1998). Hydraulically restrictive horizons and slowly permeable horizons resulted in a fluctuating water table, which led to alternating reduction and oxidation that concentrated Fe in plinthic zones (Perkins and Lawrence Citation1982; Miller Citation1983; McDaniel and Falen Citation1994). Therefore, plinthite was commonly formed in Ultisols on coastal plains (Daniels et al. Citation1978; Fanning and Fanning Citation1989) and the terraces of quaternary aged fluvial materials (Hseu and Chen Citation1996, Citation2001; Jien, Hseu, and Chen Citation2004, Citation2010). Additionally, soil horizons with plinthite were intermittently saturated with water (Guthrie and Hajek Citation1979; Vepraskas and Wilding Citation1983a, Citation1983b; Jacobs, West, and Shaw Citation2002). Schwertmann and Fanning (Citation1976) discovered that alternating oxidation and drying appeared to be essential conditions for plinthite formation; however, they found that the largest amount of plinthite occurred in the B horizon of relatively wetter soils but not the wettest soils. Hseu and Chen (Citation1996) documented that plinthite could even be present in a horizon that was saturated for a long period and reduced for a much shorter time (0–36% of a year). Although the studied soils were developed on Quaternary aged terrace, the RMFs occurred in these pedons are not relict because the boundaries between nodules and matrix of pedons on a similar elevation and area are diffuse, not distinct (Hseu and Chen Citation1996). Additionally, a relevant study in similar humid subtropical climate documented plinthites was formed in Pliocene and last to date in hilly area, but the geomorphic condition, in which elevation is more than 200 m a.s.l. and 65 km far away from the sea, is different from this study area (Costantini and Priori Citation2007).
Plinthite forms from the seasonal movement of water table and frequent saturation with water, and saturation and reduction results in Fe depletion – it has been accepted as a means to identify the aquic condition of soil (Soil Survey Staff Citation2014; Vepraskas Citation2015). Plinthite formation and Fe depletion occurred at various degrees of aquic condition, and sometimes plinthite and Fe depletion can be present in the same horizon (Hseu and Chen Citation1996, Citation2001; West et al. Citation1998). Plinthite and Fe depletion have been used to indicate the degree of saturation and reduction in various hydropedogenic environments (Daniels, Gamble, and Cady Citation1971; Simonson and Boersma Citation1972; Vepraskas and Wilding Citation1983a; Cox, Fritsch, and Fitzpatrick Citation1996; Jacobs, West, and Shaw Citation2002). Therefore, a more thorough understanding of how plinthite formation and Fe depletion occur is critical for predicting regional hydrology (Bouma et al. Citation1983; Aide et al. Citation2004; Vepraskas Citation2015). However, relevant studies have mostly focused on the relationship between aquic conditions and formation of plinthite or Fe depletion and have seldom discussed the relationship between plinthite and regional hydrology corresponding to soil classification. The morphology and volume of plinthite were listed as criteria for classification of the great group or subgroup in Soil Taxonomy (Soil Survey Staff Citation2014). The difference of definition for plinthite in the great group or subgroup was whether the soils have ≥50% or only ≥5% plinthite (by volume) in one or more horizons within 150 cm of the mineral soil surface. Some quantitative connection or relation may exist between plinthite and regional hydrology because the aquic condition can be inferred from the category levels of plinthite in Soil Taxonomy.
Because regional soil survey data are more easily accessible than local hydrological monitoring data in many countries, using soil survey data is effective in terms of cost and time for evaluating regional hydrology, especially for rice-growing soils in Taiwan. Some studies have discussed the relationship between regional hydrological conditions and RMFs on the Yangmei terraces in northwestern Taiwan (Hseu and Chen Citation1996, Citation2001; Jien, Hseu, and Chen Citation2004, Citation2010; Lin et al. Citation2007). Additionally, Lin et al. (Citation2007) documented the existence of toposequences of homogeneous-mottled-gley soils occurring in the lowlands of terraces from distal high-altitude areas to proximal coastal regions. These soil morphology toposequences were strongly related to groundwater governed by topography; the groundwater table was close to the surface in the middle of a terrace but deeper in the distal area. Jien, Hseu, and Chen (Citation2010) identified the presence of abundant ferromanganiferous nodules of various sizes in each soil horizon with plinthite. Smaller nodules (2–10 mm) were evident in pedon under the most reducing conditions, whereas larger nodules (>10 mm) were observed in pedons under moderate reducing conditions. Hseu and Chen (Citation1996, Citation2001) have determined that the size and content of plinthite were best expressed at a middle elevation and in the central parts of the argillic horizon with plinthite (Btv horizon) where the groundwater table mostly fluctuated, although generally the size and volume of Fe depletion both became larger, and the upper boundary of Btv horizons higher as elevation decreased. Thus, it is reasonable to expect that RMFs would be increasingly evident as one moved from a distal high elevation area to a coastal area, and the abundance of plinthite would be maximal in the middle elevation of a terrace. However, the scales of other studies were small and individualized, which made ascertaining the relationship among landscape positions, water table fluctuations, and RMFs on the entire Yangmei terrace difficult.
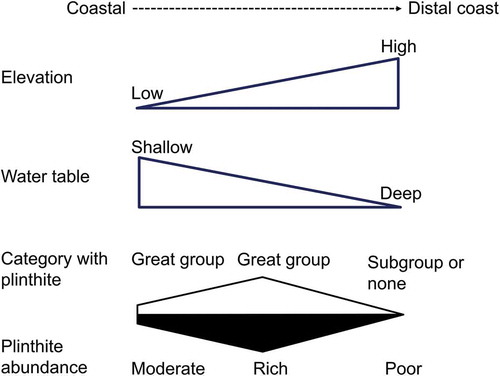
The objectives of this study were (1) to characterize RMFs in lowland rice-growing soils on various landscape positions of the Yangmei terrace, and (2) to quantify the plinthite related to the soil saturated and reduced time of the year. In the present study, we hypothesized that areas with a higher frequency of soil saturation and redox cycling during the year correspond to a higher amount of plinthite and that the plinthite is labeled in the great group for the soils at proximal coastal area or low elevation area, while the plinthitic soils at the high elevation area are classified into the subgroup of plinthite (). Establishing a quantitative relationship between regional hydrology and plinthite would be crucial for soil interpretation and management.
Figure 1. Relationships among the elevation, soil hydrological parameters and Soil Taxonomy of study area.
2. Materials and methods
2.1. Environmental information
The study site was located in a coastal area on the Yangmei terrace of northwestern Taiwan ()). The longitudinal and latitudinal distances of the study area were approximately 6.5 km and 13.0 km, respectively, and the total area was approximately 5,579 ha. The terrain of the study area increases in elevation from the northwest to southeast, ranging from 0 to 100 m above sea level (a.s.l.). Rivers flow to the Taiwan Strait where the terrain slopes downward. The Dajue, Guanyin, Xinwu, Shezi, and Dapo rivers are present from the southeast to the northwest part of the study area. The average winter and summer temperatures in the study area are 14°C and 29°C, respectively. The soil temperature regime is hyperthermic. The mean annual rainfall and evaporation have been 1,488 mm and 754 mm during the past decade (2006–2015), respectively (Central Weather Bureau of Taiwan, https://www.cwb.gov.tw/). The average monthly rainfall and evaporation peaks are both in July, and evaporation never exceeds rainfall. Moreover, monthly rainfall during the winter has been considerably lower than during other seasons over the past several decades. The soil moisture regimes are udic or aquic. The study soils of the Yangmei terrace developed from quaternary alluvial deposits (Ho Citation1988; Chen and Liu Citation1991) that were classified into Ultisols in Soil Taxonomy. Most of the soils have been used for agricultural production, especially for irrigated and drained double-cropping rice cultivation since the 1950s. Therefore, the soils have been influenced by the perched water table or regional water table, of which the absolute depth to the seasonal high water table has ranged from 0.5 to 3 m depending on the landscape position.
Figure 2. Location of study area (a) and sampling sites of reference pedons and additional pedons (b).
2.2. Aquic conditions and plinthite in Soil Taxonomy
Two prefixes representing plinthite content at great- and sub-group levels based on Soil Taxonomy were used in this study. It was coded as GG-Plinthite when Plinthite met the criteria in the great group category, and as SG-Plinthite when Plinthite did in the subgroup category. According to the past studies (Hseu and Chen Citation1996, Citation2001; Jien, Hseu, and Chen Citation2004, Citation2010; Lin et al. Citation2007), approximately 50% of the terrace soils was classified into GG-Plinthite and SG-Plinthite. The GG-Plinthite soils were mainly in the domains from 0 to 30 m a.s.l., and the SG-Plinthite soils were in the domains from 20 to 50 m a.s.l. (Hseu and Chen Citation1996, Citation2001; Jien, Hseu, and Chen Citation2004, Citation2010). The study area was divided into five domains at 10-m elevation intervals by using digital terrain mapping to assess the area and the corresponding area proportions of plinthite category levels in Soil Taxonomy to attain a precise grouping of soil classifications on the terraces. We confirmed the plinthic Ultisols are whether in GG-plinthite or SG-plinthite based on the relationship between elevation domain and abundance of plinthite.
Past studies have recorded RMFs and regional hydrology at selected landscape positions in the study area. Data concerning 14 soil pedons were published by Hseu and Chen (Citation1996, Citation2001) and Jien, Hseu, and Chen (Citation2004, Citation2010); they were classified into plinthic soils in Soil Taxonomy and were cited as reference pedons (coding as R1 to R14) in this work (). Data accounting for the annual saturated time (AST, %) and annual reduced time (ART, %) of soil in were obtained from long-term monitoring of water potential and redox potential by Hseu and Chen (Citation1996, Citation2001) and Jien, Hseu, and Chen (Citation2004, Citation2010). The AST and ART in reference pedons were defined as the percentage of days in which the soil was in the saturation and reduction regime for an entire year, respectively. Two belt transects, A–A’ and B–B’, were set up on the terrace and were based on the sampling sites of reference pedons ()). On the basis of variations of elevation and wetness conditions, this work sampled additional 14 pedons (coding as A1 to A14) from rice-growing fields in transect zone A and B in June to July 2016 ()). The transect zones were set to avoid the non-Ultisols which were developed from modern alluvium. Distances from the coast to reference pedons and additional pedons ranged from 1.7 to 4.3 km and 1.4 to 5.3 km, respectively (); ). The elevation of reference pedons ranged from 10 to 40 m a.s.l. The elevation of additional pedons ranged from 10 to 50 m a.s.l., and the additional pedons were grouped into four elevation domains at 10-m intervals ()). All soil horizon samples were collected from each pedon for texture analysis in the laboratory.
Table 1. Morphological characteristics of reference and additional pedons in the study area.
Table 2. Classification in Soil Taxonomy and hydrological parameters for all pedons.
Of the 28 pedons studied, pedons R4, R5, R6, R8, R13, and A9 were selected for verifying our hypothesis because of their occurrence of plinthite in Hseu and Chen (Citation1996, Citation2001) and Jien, Hseu, and Chen (Citation2004, Citation2010) ()). Pedons R5, R6, and R13 were near the seashore, and their water tables were high. They were classified into Plinthaquults and Plinthudult and were coded as GG-Plinthite. Furthermore, the abundance of plinthic horizon (argillic horizon with plinthite) exceeded 50% of the profile in volume. Pedons R4 and R8 were relatively high elevation compared with pedons R5, R6, and R13, and were classified into Plinthaquic Paleudults and were coded as SG-Plinthite. Pedon A9 was presented at a high elevation and was considerably distant from the seashore. It was classified into Plinthic Paleaquult and was typical SG-Plinthite.
2.3. Description of field morphology
Soil morphological characteristics were described according to the USDA Soil Survey Manual (Soil Survey Staff Citation2012), which emphasizes detailed characteristics such as the starting depth, ending depth, thickness, size, color, structure, contract, and abundance by volume of plinthite and Fe depletion (Soil Survey Staff Citation2014). We sampled all the additional profiles to 180 cm by soil auger, which fully affirmed the keys to Plinthite in Soil Taxonomy considering horizon within 150 cm. The 20-m cell size digital terrain model data were obtained from the government open data platform (https://data.gov.tw). Obtaining accurate measurements of the degree of reduction in a soil is difficult. In the context of Soil Taxonomy, however, only a degree of reduction that results in reduced iron is considered, because it produces the visible RMFs that are identified in the keys. A simple field test is available to determine if reduced iron ions are present. A freshly broken surface of a field-wet soil sample is treated with alpha, alpha-dipyridyl solution was recommended to qualify the presence of ferrous ion in the soil for the requirement of aquic condition (Soil Survey Staff Citation2014). Thus, we applied this solution to a freshly broken pedsurface in the field to confirm whether soil horizons were in the reduced state for additional pedons.
2.4. Relationship between RMFs and soil hydrological conditions
The RMFs data for reference pedons included feature volume, feature volume proportion, feature thickness, total area proportion of the feature, and average area proportion of the feature. Feature thickness was calculated according to the starting and ending depths of the feature. The feature volume proportion was the volume proportion of feature in a whole profile. The feature total area proportion is the feature’s area to whole area of soil profile, and the feature average area proportion is the average of proportions of feature’s area in each plinthic horizon of soil profile. The Pearson correlation coefficients of all the aforementioned RMFs data were examined using the SAS PROC CORR.
By using the relationship between RMFs and data of soil hydrological conditions for the proposed soil mapping of plinthite, the historical soil map was revised as follows. First step, we excluded area of non-Ultisols in the study area. Second step, the soil polygons in the historical soil map and soil survey report (Council of Agriculture Citation1969) were examined according to the study hypothesis of correlation between plinthite volume and elevation. We kept the category of plinthite (GG-plinthites or SG-plinthites) in the historical record of the soil map if the mapping polygon met the hypothesis. Third step, the soil classification of mapping polygons that did not meet the hypothesis was revised according to our additional field survey in this study. Fourth step, for those of mapping polygon without any additional survey data or reference reports in this study area, the mapping polygons were kept the original category based on the historical soil map and soil survey report.
3. Results and Discussion
3.1. Relationship between elevation and soil hydrological parameters of the reference pedons
The average annual reduced time (AART) of the plinthic horizon decreased with increasing pedon elevation from 100% to 10% (r = −0.819, p < 0.01), the average annual saturated time (AAST) of the plinthic horizon also exhibited a similar correlation as that between AART and elevation (r = −0.688, p < 0.01). Additionally, the AAST values were significantly correlated with distance (r = −0.680, p < 0.05) from the seashore in the domain of <30 m a.s.l. The Pearson correlation results indicated that elevation was significantly correlated with AAST, AART, and plinthite volume proportion (r = −0.573, p < 0.05). Because the plinthite volume proportion was more conveniently obtained than other soil hydrological monitoring parameters in the field, we further used plinthite volume proportion as a key indicator to determine relationships among elevation, RMFs, and profile hydrology conditions of plinthic horizon in the domains of various elevations.
With respect to reference pedons, the volume proportion of plinthite in a whole pedon (PVP, %) significantly (p < 0.05) decreased with increasing elevation ranging from 20 to 40 m a.s.l. ()). The pedon R13 with the highest PVP (%) was at 27 m a.s.l., which was near the middle elevation of all reference pedons’ positions. Soil saturation and reduction by water are favorable for forming plinthite (Vepraskas and Craft, Citation2000). Daugherty and Arnold (Citation1982) reported that the highest PVP corresponded to the medium AAST and AART values rather than their peak values, illustrating that the optimal formation of plinthite was caused by the long-term frequent fluctuation of the seasonal water table in the soil.
Figure 3. Relationships between elevation and soil hydrological parameters including (a) plinthite volume proportion (PVP, %), (b) average annual saturated time (AAST, %) at plinthic horizon, and (c) average annual reduced time (AART, %) at plinthic horizon for the reference pedons. The solid line is a linear regression line, and the dashed line is the range of the 95% confidence level.
3.2. Relationship between RMF abundance and elevation in all pedons
The matrix colors of all pedons were reddish brown to dark grayish brown, mostly ranging from 4 to 6 value in the Munsell color system (). Regarding soil texture, sand or silt was the dominant particle size in surface horizons, and the subsurface horizons contained considerable amounts of illuvial clays to meet the criteria for an argillic horizon with plinthite. For example, reference pedon R10 was saturated and reduced for a long time, of which the AAST and AART of plinthic horizon were 70–80% and 100%, respectively (), and corresponded to the abundant Fe depletions that appeared as gray redoximorphic depletions in the Btv horizon below approximately 70 cm (). Compared with pedon R10, the frequent fluctuation of the seasonal water table at pedon R14 caused the occurrence of more abundant, thicker, and brighter plinthite in the Btv horizon, which was associated with many light gray Fe depletions that occurred in the horizon below 40 cm, despite the shorter duration of saturation and reduction in pedon R14 (). The matrix color value was high and plinthite was few in pedon R8 where the water table was deep and the degrees of saturation and reduction were lower than those of pedons R10 and R14 (Jien, Hseu, and Chen Citation2004; ).
The PVP decreased as elevation increased from the coast to 50 m a.s.l. for both the reference pedons and additional pedons, and the correlation between elevation and PVP was negatively significant (P < 0.05) (). Additionally, the highest PVP values for both the reference and additional pedons were in the domain of 20–30 m a.s.l. () and were corresponded to the medium AAST and AART (40–60%; ,c)). These highest PVP values agreed with other studies that had determined that RMFs increased with an increasing number of saturation events (Vepraskas et al. Citation2004). Therefore, saturation and reduction conditions that persisted for a long duration induced the formation of RMFs in the soils at low elevations, but the soils at high elevations underwent too short duration of saturation and reduction to generate RMFs. The PVP was higher at medium elevations because of the higher frequency of saturated and reduced time, but it became lower at high elevations because of the inappropriate duration of saturation and reduction times.
Figure 4. Relationship between elevation and PVP (%) for all pedons. The solid line is a polynomial quadratic regression line, and the dashed line is the range of the 95% confidence level.
3.3. Category level in Soil Taxonomy
Soils in this study were classified into Ultisols in most cases. Most of the pedons in ≤30 m a.s.l. were classified into Plinthaquults or Plinthudults in great group (GG-Plinthite; ). However, the pedons R9, R10, A4, and A12 were classified into the SG-Plinthite category. In the cases of GG-Plinthite, their AAST were mostly ≥40% and AART was 50–100% of the year in their plinthic horizons. The AAST tended to be higher in lower elevation domains (<20 m a.s.l.) than in higher elevation domains.
Seventy-one percent pedons in 30–50 m a.s.l. were classified into Plinthic Paleudults, Plinthaquatic Paleudults or Plinthic Paleaqults at subgroup level (SG-Plinthite; ), of which the AAST and AART of the Plinthic horizon were approximately <40% and <30%, respectively. The AART significantly decreased with increasing elevation, but AAST was less correlated with elevation. These classification results demonstrated that the PVP of many pedons (R1, R2, R4, R7, and R8) in the domain of 30–50 m a.s.l. was lower than that in the domain of ≤30 m a.s.l. because of a lower AAST and AART in the domain of 30–50 m a.s.l. (). The low PVP values would be related to the deepwater table and the brief occurrence of a perched water table, leading to soils unable to cycle between the wetting and drying of the year and the unclear segregation of Fe with a short period.
3.4. Verification of the category levels of plinthic Ultisols
Seventy-one percent study pedons in the domain of ≤30 m a.s.l. were classified into Plinthaquults or Plinthudults (), which supported our hypothesis that the pedons containing higher AAST and AART values are classified into great group category of Plinthite; however, the other pedons R9 were not classified into these categories probably because of their lower AAST and AART values in this domain (,c); ). Our results indicated that the seasonal fluctuation of the water table was more evident in the domain of ≤30 m a.s.l. Two major reasons may account for why some pedons in this domain could not be classified into Plinthaquults or Plinthudults – first, the soil texture of pedons, and second, the frequency of redox cycling. The groundwater table was shallow in the sandy soil and the groundwater table fluctuated frequently under alternative wet and dry cycles, thus, the relative paucity of plinthites did not meet the requirements for categorization as plinthites in the great group of Aquults (A12). When the groundwater table was shallow, the soil texture was fine and surface water was drained slowly. Then, the soil pedons could not be classified into the GG-Plinthite category but were only classified into SG-Plinthite category (e.g., A4 and R10) because the excessive saturation and reduction inhibited the formation of plinthite (Hseu and Chen Citation2001; Jacobs, West, and Shaw Citation2002; Aide et al. Citation2004).
More than 71% study pedons in domain of 30–50 m a.s.l. were classified into plinthaquic or plinthic subgroup of Paleudults and Paleaquults (), which supported our hypothesis that Plinthite was labeled in the subgroup of soils at the high elevation. Furthermore, 29% soils in domain of 30–50 m a.s.l. were classified into Plinthudults. This classification result indicated that GG-Plinthite was interchanged with SG-Plinthite in this domain. The study area is on a multiple-level terrace, and thus the local hydrology along valley slopes may be one of the causes of the presence of mixture of GG-plinthite and SG-plinthite. However, more hydrological data mapping and profile sample analysis would be necessary to determine the reasons for the co-presence of different categorical units in Soil Taxonomy in the same domain. The correlation between elevation and PVP agreed with the correlation between elevation and the soil taxonomy categories of Plinthite. Therefore, when the PVP value of a soil pedon was 50% or more in a domain of ≤30 m a.s.l., the soil was more likely to be categorized into GG-Plinthite. When pedons were located in the domain of 30–50 m a.s.l., soils were more likely to be categorized into SG-Plinthite. We used this correction of RMFs based on the quantification of AAST and AART information and the study pedons to soil mapping ().
Figure 5. The proposed soil mapping of plinthite in the study area.
4. Conclusions
The PVP decreased with increasing elevation in the domain of ≤50 m a.s.l. which correlated with the variations of AAST and AART. The variation of soil taxonomic categories where Plinthite was downgraded with increasing elevation in the domain of ≤50 m a.s.l. matched our hypothesis. Pedons were classified into GG-Plinthite categories in the domain of ≤30 m a.s.l. and pedons were classified into SG-Plinthite categories in the domain of 30–50 m a.s.l. After the calibration by RMFs, the plinthite mapping of the study area was set up, which made it possible to interpret the actual distribution of plinthic soils in terms of different categorical levels. However, more field monitoring data of regional soil hydrogeomorphology are necessary to correct these empirical relationships in the future.
Acknowledgments
This study was supported by Science and Technology Innovation of Water Resource Department of Guangdong Province (2016-17), National Natural Science Foundation of China (No.41501203, No.41701250), and GDAS’s project of Science and Technology Development (2019GDASYL-0401003). The authors thank Dr. C.C. Tsui (National Taiwan University) for advice on running SAS programs; and C.C. Tsui, C.H. Lee, C.C. Tsui, J.Y. Hsu, C.Y. Lin, T.L. Fu, Y.Y. Tan, H.Y. Chen, S.S. Dai (Soil Survey and Remediation Lab, National Taiwan University) for the field sampling.
Disclosure statement
No potential conflict of interest was reported by the authors.
Additional information
Funding
References
- Aide, M., Z. Pavich, M. E. Lilly, R. Thornton, and W. Kingery. 2004. “Plinthite Formation in the Coastal Plain Region of Mississippi.” Soil Science 169 (9): 613–623. doi:10.1097/01.ss.0000142636.77482.e0.
- Alexander, L. T., and J. G. Cady. 1962. Genesis and Hardening of Laterite in Soils. Vol. 1281. Washington, DC: US Department of Agriculture.
- Blume, L. J., H. F. Perkins, and R. K. Hubbard. 1987. “Subsurface Water Movement in an Upland Coastal Plain Soil as Influenced by Plinthite.” Soil Science Society of America Journal 51 (3): 774–779. doi:10.2136/sssaj1987.03615995005100030036x.
- Bouma, J. 1983. “Hydrology and Soil Genesis of Soils with Aquic Moisture Regime.” In Pedogenesis and Soil Taxonomy: Concepts and Interactions, edited by L. P. Wilding, 253–281. Amsterdam: Elsevier. doi:10.1016/s0166-2481(08)70604-4.
- Chen, Y. G., and T. K. Liu. 1991. “Radiocarbon Dates of River Terraces along the Lower Tahanchi, Northern Taiwan: Their Tectonic and Geomorphic Implications [In Chinese.].” Proceedings of the Geological Society of China 34 (4): 337–347.
- Costantini, E. A., and S. Priori. 2007. “Pedogenesis of Plinthite during Early Pliocene in the Mediterranean Environment: Case Study of a Buried Paleosol at Podere Renieri, Central Italy.” Catena 71 (3): 425–443. doi:10.1016/j.catena.2007.03.015.
- Council of Agriculture. 1969. Soil Survey Report for Agricultural Lands in Taoyuan. Taipei, Taiwan, ROC: Council of Agriculture.
- Cox, J. W., E. Fritsch, and R. W. Fitzpatrick. 1996. “Interpretation of Soil Features Produced by Ancient and Modern Processes in Degraded Landscapes. VII. Water Duration.” Soil Research 34 (6): 803–824. doi:10.1071/sr9960803.
- Daniels, R. B., E. E. Gamble, and J. G. Cady. 1971. “The Relation between Geomorphology and Soil Morphology and Genesis.” In Advances in Agronomy, edited by N. C. Brady, Vol. 23, 51–88. New York: Academic Press. doi:10.1016/s0065-2113(08)60150-9.
- Daniels, R. B., H. F. Perkins, B. F. Hajek, and E. E. Gamble. 1978. “Morphology of Discontinuous Phase Plinthite and Criteria for Its Field Identification in the Southeastern United States.” Soil Science Society of America Journal 42 (6): 944–949. doi:10.2136/sssaj1978.03615995004200060024x.
- Daugherty, L. A., and R. W. Arnold. 1982. “Mineralogy and Iron Characterization of Plinthitic Soils on Alluvial Landforms in Venezuela.” Soil Science Society of America Journal 46 (6): 1244–1252. doi:10.2136/sssaj1982.03615995004600060025x.
- Fanning, D. S., and M. C. B. Fanning. 1989. “Gleization.” In Soil Morphology, Genesis, and Classification, edited by D. S. Fanning, and M. C. B. Fanning, 110–125. New York: John Wiley & Sons.
- Guthrie, R. L., and B. F. Hajek. 1979. “Morphology and Water Regime of a Dothan Soil.” Soil Science Society of America Journal 43 (1): 142–144. doi:10.2136/sssaj1979.03615995004300010027x.
- Ho, C. S. 1988. An Introduction to the Geology of Taiwan: Explanatory Text of the Geological Map of Taiwan. 2nd ed. Taipei, Taiwan, ROC: Ministry of Economic Affairs.
- Hseu, Z. Y., and Z. S. Chen. 1996. “Saturation, Reduction, and Redox Morphology of Seasonally Flooded Alfisols in Taiwan.” Soil Science Society of America Journal 60 (3): 941–949. doi:10.2136/sssaj1996.03615995006000030037x.
- Hseu, Z. Y., and Z. S. Chen. 2001. “Quantifying Soil Hydromorphology of a Rice-growing Ultisol Toposequence in Taiwan.” Soil Science Society of America Journal 65 (1): 270–278. doi:10.2136/sssaj2001.651270x.
- Jacobs, P. M., L. T. West, and J. N. Shaw. 2002. “Redoximorphic Features as Indicators of Seasonal Saturation, Lowndes County, Georgia.” Soil Science Society of America Journal 66 (1): 315–323. doi:10.2136/sssaj2002.3150.
- Jien, S. H., Z. Y. Hseu, and Z. S. Chen. 2004. “Relations between Morphological Color Index and Soil Wetness Condition of Anthraquic Soils in Taiwan.” Soil Science 169 (12): 871–882. doi:10.1097/00010694-200412000-00006.
- Jien, S. H., Z. Y. Hseu, and Z. S. Chen. 2010. “Hydropedological Implications of Ferromanganiferous Nodules in Rice-growing Plinthic Ultisols under Different Moisture Regimes.” Soil Science Society of America Journal 74 (3): 880–891. doi:10.2136/sssaj2009.0020.
- Lin, Y. S., Y. W. Lin, Y. Wang, Y. G. Chen, M. L. Hsu, S. H. Chiang, and Z. S. Chen. 2007. “Relationships between Topography and Spatial Variations in Groundwater and Soil Morphology within the Taoyuan-Hukou Tableland, Northwestern Taiwan.” Geomorphology 90 (1): 36–54. doi:10.1016/j.geomorph.2007.01.013.
- McDaniel, P. A., and A. L. Falen. 1994. “Temporal and Spatial Patterns of Episaturation in a Fragixeralf Landscape.” Soil Science Society of America Journal 58 (5): 1451–1457. doi:10.2136/sssaj1994.03615995005800050025x.
- Miller, B. J. 1983. “Ultisols.” In Pedogenesis and Soil Taxonomy II: The Soil Orders, edited by L. P. Wilding, N.E. Smeck and G.F. Hall, 283–323. New York: Elsevier.
- Perkins, H. P., and B. Lawrence. 1982. “Sesquioxide Segregation in Plinthic and Nonplinthic Counterpart Soils.” Soil Science 133 (5): 314–318. doi:10.1097/00010694-198205000-00008.
- Schwertmann, U., and D. S. Fanning. 1976. “Iron-manganese Concretions in Hydro Sequences of Soils in Loess in Bavaria.” Soil Science Society of America Journal 40 (5): 731–738. doi:10.2136/sssaj1976.03615995004000050054x.
- Simonson, G. H., and L. Boersma. 1972. “Soil Morphology and Water Table Relations: II. Correlation between Annual Water Table Fluctuations and Profile Features.” Soil Science Society of America Journal 36 (4): 649–653. doi:10.2136/sssaj1972.03615995003600040041x.
- Sivarajasingham, S., L. T. Alexander, J. G. Cady, and M. G. Cline. 1962. “Laterite.” In Advances in Agronomy, edited by A. G. Norman, 1–60. Vol. 14. New York: Academic Press.
- Soil Survey Staff. 2012. Soil Survey Manual (Handbook No.18). Lincoln, Nebraska: USDA-Soil Conservation Service.
- Soil Survey Staff. 2014. Keys to Soil Taxonomy. 12th ed. Washington, DC: USDA-Natural Resources Conservation Service.
- Vepraskas, M. J. 2015. Redoximorphic Features for Identifying Aquic Conditions. Technical Bulletin 301. Raleigh, North Carolina: North Carolina Agricultural Research Service. North Carolina State University.
- Vepraskas, M. J., and C. B. Craft. 2000. Wetland Soils: Genesis, Hydrology, Landscapes, and Classification. New York: CRC Press.
- Vepraskas, M. J., X. He, D. L. Lindbo, and R. W. Skaggs. 2004. “Calibrating Hydric Soil Field Indicators to Long-term Wetland Hydrology.” Soil Science Society of America Journal 68 (4): 1461–1469. doi:10.2136/sssaj2004.1461.
- Vepraskas, M. J., and L. P. Wilding. 1983a. “Aquic Moisture Regimes in Soils with and without Low Chroma Colors.” Soil Science Society of America Journal 47 (2): 280–285. doi:10.2136/sssaj1983.03615995004700020040x.
- Vepraskas, M. J., and L. P. Wilding. 1983b. “Albic Neoskeletans in Argillic Horizons as Indices of Seasonal Saturation and Iron Reduction.” Soil Science Society of America Journal 47 (6): 1202–1208. doi:10.2136/sssaj1983.03615995004700060028x.
- West, L. T., J. N. Shaw, E. R. Blood, and L. K. Kirkman. 1998. “Correlation of Water Tables to Redoximorphic Features in the Dougherty Plain, Southwest Georgia.” In Quantifying Soil Hydromorphology, 247–258. Madison, WI: SSSA Special Publication 54. SSSA. doi:10.2136/sssaspecpub54.c14.