
 ?Mathematical formulae have been encoded as MathML and are displayed in this HTML version using MathJax in order to improve their display. Uncheck the box to turn MathJax off. This feature requires Javascript. Click on a formula to zoom.
ABSTRACT
Estimation of the soil organic carbon (SOC) stock based on the monitoring data is important to validate the carbon model estimates and provide the initial values of SOC stock to the model. The Japanese National Greenhouse Gas Inventory Report (NIR) has applied the RothC model since 2015 to report changes in SOC in agricultural land. This study estimated soil carbon and nitrogen stocks and C:N ratio of top 30 cm arable land in Japan using the 2015–2018 database of the national soil monitoring project. Estimates based on the stationary monitoring data from the top 30 cm of the soil layer arethe first public release. We modified categorization of the soil temperature regime and soil-type classification for estimation, expecting to mitigate the underestimation and overestimation of SOC stock in the areas of soil temperature 15–17°C and more than 17°C, respectively, and to optimize the soil classification to 16 fewer types to allow an appropriate estimation even in the current situation of decreasing number of survey sites. Statistical analysis to see the effects of land use and soil temperature on SOC stock, TN stock, and C:N ratio showed that soil types other than Andosols had an inverse temperature-dependent trend for all variables, while Andosols had an unclear trend in soil temperature, supporting existing studies. Also, when Lowland soils (Fluvisols or Anthrosols in the World Reference Base) were surrounded by Andosols, redeposition of volcanic ash could affect the temperature trend in SOC stock for Lowland soils. The distribution map of the SOC stock and C:N ratio across Japan visually showed a high value in the Andosols distribution areas and a temperature-dependent trend at the distribution areas of the other soil types. The total SOC stock estimated in this study was 176±12.8 TgC in paddy field, 100±8.6 TgC in upland field, 25±1.7 TgC in orchard, 78±8.9 TgC in grassland, and 379±17.9 TgC in total, the standard deviations of which were much smaller than those of the mean values for each land use calculated by the simple average method.
1. Introduction
Long–term stable storage of soil organic carbon (SOC) has been proposed as one of the measures to mitigate global warming (Intergovernmental Panel on Climate Change (IPCC) Citation2003). Soil is a huge carbon pool in terrestrial ecosystems (Lal Citation2004; Scharlemann et al. Citation2014), and, therefore, increasing and maintaining carbon in soil through proper soil management in agricultural lands is a global challenge. For this purpose, many studies have been conducted to clarify the effects of soil types and climatic factors on SOC stock, and the relationship between carbon and nitrogen in soil, which affect the decomposition rate of soil organic matter (Guo and Gifford Citation2002; Post and Kwon Citation2000).
Batjes (Citation1996) comprehensively reported the distribution of carbon and nitrogen contents of terrestrial soils in the world, where the mean values of SOC, total nitrogen (TN) and carbon-to-nitrogen ratio (C:N) varied in soil types. Although they targeted typical soils around the world, including soil types that are also distributed in Japan, such as Andosols, Fluvisols, Histosols, Cambisols and Acrisols (see ), the global-scale estimate did not reflect the microclimate, parent material or land use at the regional level. The national-scale estimates that reflect these factors at the regional level need to be developed by each country.
Table 1. Soil type classification
The national soil monitoring project (stationary monitoring survey) has been carried out since 1979 on agricultural land in Japan, aiming to clarify appropriate soil management practices based on a comprehensive assessment of soil changes over time. Until 2007, however, the database was mainly maintained for the plowed layer. Not all subsoil information was, therefore, available at all survey sites. Tataka et al. (Citation2013) reported SOC and TN stocks of plowed layer using these soil databases. They evaluated spatial-temporal variation of soil carbon and nitrogen content during 1979‒1998, suggesting that besides the variation in agricultural land area, the total stock of soil carbon and nitrogen might be affected by soil management. Since the national soil monitoring has changed to focus on soil carbon stock reporting in 2008, soil data of the upper 30 cm has been obtained at all survey sites and compiled into a database. This is in order to build a soil database that complies with the international standards recommended by the IPCC. The results of this study are based on a database that has been developed in this process, and this paper is the first public release of data from the top 30 cm of the agricultural soil layer across Japan.
Estimates based on monitoring data could also provide important information for initial inputs to the soil carbon model and for model validation. Among many soil carbon models, the Rothamsted Carbon Model (RothC) was found to well perform when evaluated by the measured data (Coleman and Jenkinson Citation1996; Smith et al. Citation1997). For the Japanese farmland soils, modified versions of RothC have been developed to simulate carbon change in soils with characteristic management and mineralogical backgrounds, such as paddy fields and Andosols in upland fields (Shirato, Hakamata, and Taniyama Citation2004; Shirato and Yokozawa Citation2005; Yokozawa et al. Citation2010; Takata et al. Citation2011a). While the land–use-based SOC stock has been reported annually for the Green House Gas Inventory Report of Japan (NIR) (URL: http://www.nies.go.jp/gio/aboutghg/index.html); since 2015, RothC has been used to report the carbon change in agricultural soils according to the Intergovernmental Panel on Climate Change (IPCC) Guideline Tier 3 (Intergovernmental Panel on Climate Change (IPCC) Citation2003).
This study applies the modified soil classification system and soil temperature regimes to estimate SOC stock and C:N ratio of different land uses at the national scale aiming at finding an appropriate estimation of the average SOC stock of agricultural area in Japan with the international standards recommended by the IPCC. This study deals with the agricultural soils across Japan, which are classified into eight great groups (22 soil groups) in the Japanese Soil Classification System: Organic soils (Histosols), Andosols, Dark–Red soils (Cambisols/Luvisols/Alisols/Acrisols), Lowland soils (Fluvisols/Anthrosols), Red–Yellow soils (Acrisols /Alisols/Cambisols), Aquic Stagnic soils (Stagnosols/Gleysols/Anthrosols), Brown Forest soils (Cambisols) and Regosols (Regosols/Arenosols/Leptisols) (in the parentheses, reference soil groups based on the World Reference Base for Soil Resources; WRB). Andosols, a soil derived from volcanic ash, are rare in the world with a land distribution of less than 1%, but it is one of the major soil types in Japan, accounting for about 31% of the land area. This soil type is rich in humus and has a high phosphate fixing capacity, which is mainly attributed to a large amount of reactive Al. Lowland soils are mainly composed of sediments from river floods and account for 70% of the paddy fields in Japan. Red–Yellow soils are generally low in organic matter, and are characterized by the accumulation of clay moved from the surface by weathering over a long period of time, and intense leaching of base cations. Aquic Stagnant soils are poorly drained soils that are affected by stagnant water and groundwater, and are found on plateaus and hillsides. Brown Forest soils have a dark surface layer rich in organic matter in woodlands, but often have low organic matter content in orchards and fields. The national soil classification map and the WRB-based soil map can be parallelly browsed by the Japanese Soil Inventory (https://soil-inventory.dc.affrc.go.jp/). The reconstruction of the soil type classification in this study is carried out by focusing on some higher and subclass criteria items in the Japanese soil classification system that affect SOC variation such as volcanic ash mineralogy (Nanzyo, Dahlgren, and Shoji Citation1993; Matsui et al. Citation2021), degree of humification, and soil texture.
The large geothermal range of the Japanese land should be considered in the national-scale analysis. Matsui et al. (Citation2021) conducted a statistical analysis of factors affecting SOC content at cropping layer in Lowland soils and Andosols, using a database of stationary monitoring surveys from 1979 to 1983. They found that the annual mean soil temperature significantly affected the SOC content in both soil types, and that the SOC content in Andosols varied independently of the soil temperature. In this study, in addition to the estimation of SOC stock by modified method, we statistically analyze dataset to see whether the top 30 cm agricultural soils show these trends.
2. Materials and method
2.1. Data source
The dataset is based on the 2015–2018 databases maintained by the Agricultural Land Soil Carbon Stock Basic Survey Project (Ministry of Agriculture, Forestry, and Fisheries Citation2021), where a stationary monitoring has been conducted since 2008. The number of survey sites has been decreasing from about 20,000 sites until the year 1998 to 3,500 sites in present. The database includes the information of soil types, land use, SOC and TN stocks in the top 30 cm soil profile, and the positional information by Global Navigation Satellite Systems (GNSS) for each site.
2.2. Soil collection
Soil samples were collected and analyzed by the staffs of prefectural agricultural experiment station at each prefecture. A soil profile survey or a simplified method was used depending on the site condition. In the soil profile survey, soil samples for carbon and nitrogen contents and the soil core samples (100 ml) for bulk density were collected in triplicate at each horizon. In the simplified method, the 30 cm-long core samples were taken in triplicate by using a T-shaped handle auger.
2.3. Soil organic carbon and total nitrogen analysis
SOC and TN were analyzed by dry combustion method. For the soils high in calcium carbonate (CaCO3), however, one of the following three methods was used: the chromic acid wet oxidation method (Walkley Citation1947), a combinational method of dry combustion and acid neutralization (Van Reewijk Citation1986), or the dry combustion method following phosphoric acid treatment (Robertson et al. Citation1999).
2.4. Soil temperature regimes
The raster data of annual mean soil temperature (hereinafter called soil temperature) map (at 1 km spatial resolution) was prepared according to Takata et al. (Citation2011b) which determined the soil temperature based on meteo-geographical factors (e.g., air temperature and altitude). The soil temperature data set was obtained by extracting the raster cell values at the locations specified by the sampling site points, the GNSS information in the database. The three categories of soil temperature were used for the current estimation in NIR: below 12°C, 12–15°C, and more than 15°C. This study, on the other hand, applied the soil temperature categories used by Matsui et al. (Citation2021), who categorized soil temperature into four regimes by separating the areas of soil temperature higher than 15°C: Cold (C; below 12°C), Moderately Cold (MC; 12–15°C), Moderately Warm (MW; 15–17°C), and Warm (W; more than 17°C) soil temperature regimes. The soil temperature map can be browsed by the Japanese Soil Inventory (https://soil-inventory.dc.affrc.go.jp/).
2.5. Land use classification
Land use includes paddy field, upland field, orchard, and grassland. In paddy fields, the soils are in the annual cycle of waterlogged and non–waterlogged conditions. Paddy field includes continuous rice cultivation field and rice-upland rotation field. Upland field indicates a non–waterlogged field that is usually cultivated with herbaceous crops or seedlings but does not include grassland. Orchard is a field for fruit trees or tea trees. Grassland indicates a field for pasture or serving as a hayfield in this study. Paddy and upland rotation field was categorized as paddy field.
2.6. Soil type classification
Based on the Classification of Cultivated Soils in Japan–Third Approximation (Cultivated soil Classification Committee Citation1995) applied for the database, we modified the soil classification that focus more on SOC stock.
In the Japanese Soil Classification System, the eight soil great groups are further classified into subgroups according to the degree of development of soil formation, mineralogy, and moisture environment (Obara et al. Citation2011). In this study, we reorganized the soil classification by picking up the characteristics of the subgroups that affect SOC variation, such as the amount of humus, Andic characteristic, and soil texture, in order to examine the estimation method for SOC stock of agricultural soils in Japan. We finally arranged into 15 soil types under four higher groups: Andosols and Non-Andosols in High carbon group, Medium carbon group and Low carbon group, for the statistical analysis in this study. For the estimation of the national SOC stock and C:N ratio, 15 plus Regosols (i.e., 16 types) were provided.
The classification process and the attribution of the soils are shown in and , respectively. To avoid confusion with the terms of the original soil classification system, the arranged soil types and the higher groups are described as ‘carbon subgroup’ and ‘carbon group,’ respectively.
Figure 1. Classification flow for soil type grouping.
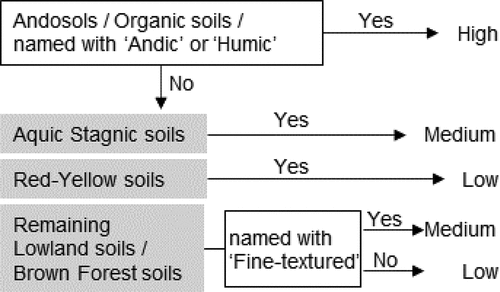
Firstly, the Andosols, the Organic soils, and other soils named with ‘Andic’ and ‘Humic’ at suborder level were selected out and defined as High carbon group composed of the Andosols and the Non–Andosols (High–humic Andosols, Humic Andosols, Low–humic Andosols, Organic soils, Humic Andic Brown Forest soils, and Humic Lowland soils). Secondly, the Aquic Stagnic soils and the other soil great groups named with ‘Fine–textured’ at suborder level were defined as Medium carbon group (Aquic Stagnic soils, Fine–textured Lowland soils, and Fine–textured Brown Forest soils). The Red–Yellow soils, however, classified as Low carbon group whatever suborder they had (Fine–textured Red–Yellow soils and Other Red–Yellow soils). The other remaining Lowland soils and Brown Forest soils (Medium-textured Lowland soils, Coarse–textured Lowland soils, and Other Brown Forest soil) were categorized into the Low carbon group.
2.7. Andosols coverage
Andosols coverage (%) (AC) was defined as the percentage of Andosols in cultivated area within a specific grid area.
AC (%) = [Distribution area of Andosols (ha)/Distribution area of agricultural land (ha)]*100
The main grid square statistics compiled by the Statistics Bureau of the Ministry of Internal Affairs and Communications in Japan was used to calculate AC on the agricultural soil map at scale 1: 50,000 (Kanda et al. Citation2017). The agricultural soil map can be downloaded from the Japanese Soil Inventory web site (https://soil-inventory.dc.affrc.go.jp/). To set up the grid, we used the secondary area partition of regional mesh, which divide the country area into grid squares of about 10 km on a side (https://www.stat.go.jp/english/data/mesh/05.html). Cultivated areas were extracted for each grid and then AC was obtained as the area percentage of Andosols in the cultivated area to give attributes of AC to the sampling point. Fine–textured Lowland soils were further divided at AC 5% (i: more than 5% AC and ii: less than 5% AC in ).
2.8. Data process
The Kruskal–Wallis test was used to assess for significant difference between the carbon large groups and between the soil temperature regimes in SOC stock, TN stock and C:N. The Steel–Dwass test was used for a multiple comparison procedure, where the significance level was 0.001. To assess the effect of parameters (e.g., land use, soil temperature, etc.) on the SOC stock and the C:N, two-way ANOVA test was used. A statistical software JMP® 14 (SAS Institute Inc., Cary, NC, USA) was used for statistical analysis. Mapping and calculation of the AC were performed using the ArcGIS 10.6 (ESRI) software.
The attributes of the soil map polygons include four land use types, four soil temperature ranges, and 16 carbon subgroups. The SOC stock values of these 256 (4*4*16) kinds of combinatorial attributes (hereafter referred to as CoA) are the mean (± standard deviation) of the measured values at stationary monitoring survey points. To match the area of the CoA based on the polygons on the map with the land use area in the MAFF agricultural statistics (FY2018), the total area of agricultural land in each municipality in the agricultural statistics was divided proportionally by the distribution ratio of each land use area based on polygons, and the area occupied by each CoA was adjusted.
For any CoA, when the most probable value of SOC stock (mean of SOC per ha) is
, its standard deviation is
, and the area of the adjusted CoA is
(constant), then the total SOC,
, and its standard deviation,
, are as follows:
The total SOC by land use, is the sum of the most probable values of
with the same land use attribute, so it can be obtained as follows:
And if the standard deviation of is
it is obtained as follows:
Note that to
are CoAs with the same land use attributes. Propagated errors were calculated for the standard deviations of the mean and total SOC stock by land use (formula (2) and (4)).
3. Results
3.1. Modified soil temperature category and soil classification
According to the Steel–Dwass test, significant difference among four soil temperature regimes was detected in the SOC stock and the C:N (p < 0.001 for both) (; Soil temperature regime). Although for the TN stock, there was no significant difference between the Moderately Warm and the Warm, inverse trend between soil temperature and variables of SOC, TN and C:N was generally found.
Table 2. Averages of SOC, TN and C:N ratio by soil temperature and carbon group
For carbon group, significant differences in SOC and TN stocks and C:N were mostly detected between the groups (p < 0.001), although the C:N was not significant between the Andosols and the Non–Andosols (p = 0.93) (; Carbon group).
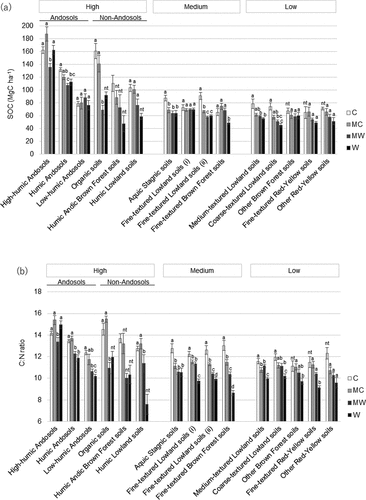
shows the averages of SOC stock () and C:N () by soil temperature regime in each soil carbon subgroup. High carbon subgroups were generally high in both SOC stock and C:N. Variation of SOC stock and C:N was large among the Andosols carbon subgroups. Also, most carbon subgroups had a temperature-dependent trend while the Andosols carbon subgroups the trend became unclear (). The highest SOC stock in the Moderately Cold temperature regime in the High–humic Andosols caused by a remarkable amount of SOC in the grassland (212 ± 86.9 (MgC ha−1)).
Figure 2. SOC stock (a) and C:N ratio (b) among soil temperature regimes by carbon group the results of the steel-dwass test are shown by lowercase letters, which represent a comparison among soil temperature regimes in each soil type. different character means a significant difference (p < 0.05). The categories less than 10 samples were not tested (nt). Error Bar is standard error. C: Cold, MC: Moderately Cold, MW: Moderately Warm, W: Warm.
3.2. Factors affecting the SOC stock and C:N
According to the two-way ANOVA test to assess the effect of soil temperature and land use on SOC stock, soil temperature regime was significant (p < 0.001) with the highest effect size among the factors in all carbon groups except for the Andosols (). For the Andosols, the interaction was significant (p < 0.001), indicating that the effects of these main factors on SOC stock were not simple. The C:N of other carbon groups except for the Andosols showed the same trend as in the SOC stock, where soil temperature main effect had a significant influence, while the land use main effect was not significant. On the other hand, the C:N for the Andosols was significantly affected by soil temperature while land use was not significant, unlike the case of SOC where land use was significant. The interaction for the Andosols for both variables was significant, which meant that we could not simply determine the influence of soil temperature and land use.
Table 3. Effect of Land use and Soil temperature on SOC and C:N ratio
3.3. Effect of the andosols coverage to the lowland soils
We found that the AC affected SOC stock of the Lowland soils and that the Lowland soils had a similar SOC trend to the Andosols when the AC was large. The effects of AC and soil temperature on SOC stock were analyzed for soils except Andosols, and AC was a significant influencing factor as well as soil temperature for only the Lowland soils (). In addition, shows that for Fine–textured Lowland soils with AC more than 5% (i), the temperature-dependent trend in SOC stock was less clear than for those with AC less than 5% (ii).
Table 4. Effect of Soil temperature and Andosols coverage on SOC stock
3.4. SOC stock and C:N distribution in Japan
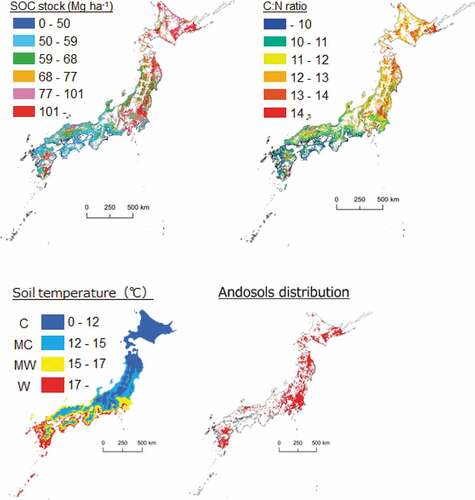
shows the distributions of the estimated SOC stock and C:N for the top 30 cm soils across Japan. The area of a high SOC stock and C:N generally corresponded to the area of the Andosols, and of the cooler soil temperature.
Figure 3. Distributions of the SOC stock and C:N ratio Distributions of soil temperature regimes (C: cold, MC: moderately cold, MW: moderately warm, and W: warm) and Andosols are shown in the right. These factors contribute to the distribution patterns of SOC stock and C:N ratio.
SOC stock for each land use weighted by the average depending on soil temperature and soil carbon group was 73.2 ± 5.3 MgC ha−1 for paddy field, 92.1 ± 7.9 MgC ha−1 for upland field, 128 ± 14.6 MgC ha−1 for grassland and 79.2 ± 5.5 MgC ha−1 for orchard. The SOC stocks multiplied by the farmland area were then 176 ± 12.8 TgC for paddy fields, 100 ± 8.6 TgC for upland fields, 78 ± 8.9 TgC for grasslands, and 25 ± 1.7 TgC for orchards, resulting in a total of 379 ± 17.9 TgC.
On the other hand, when simply averaged by the attributes of land use in the database, the SOC stock was 70.3 ± 33.7 MgC ha−1 for paddy field, 90.9 ± 51.7 MgC ha−1 for upland field, 128.9 ± 70.3 MgC ha−1 for grassland, and 80.6 ± 49.0 MgC ha−1 for orchard. In this case, the total SOC stock of the Japanese farmland multiplied by the farmland area is 372 ± 108.7 TgC.
4. Discussion
There are two trends in the spatial distribution of SOC stock and C:N ratio in agricultural soils across Japan. The first is that the SOC stock and C:N ratios vary inversely along the trend of soil temperature (). The trend along the soil temperature seems to be common among different soil types, except for Andosols (). However, the temperature sensitivity of decomposing organic matter in soil is not yet fully understood due to the complex interactions between soil organic matter quality and soil microbiota (Li et al. Citation2021; Davidson and Janssens Citation2006; Giardina and Ryan Citation2000). According to the results of the statistical analysis in this study, soil temperature is one of the valid indicators for SOC storage estimation for soil types other than Andosols, but it is not a valid indicator for Andosols ( and ).
The second trend in the spatial distribution of SOC stock and C:N ratio is that the distribution area of Andosols coincides with the areas with high values of SOC stock and C:N ratio, no matter which soil temperature regime it is in (). Although the Andosols is a minor soil group, accounting for less than 1% of the world’s terrestrial land, it occupies 31% of the area of Japan (Kanda et al. Citation2018). The SOC stock of the Andosols in High soil carbon group was 127 ± 55.5 MgC ha−1, which is significantly larger than any other category.
The C:N ratio is high for both Andosols and Non–Andosols in the High soil carbon group. It was reported that the high C:N ratio in the Ap layer of the Japanese Andosols was 14, while that of Non–Andosols was as low as 11 (Nanzyo, Dahlgren, and Shoji Citation1993). Velásquez et al. (Citation2016) focused on the relationship between phosphorus fertilization and SOC stock in Andosols (0–40 cm soil layer) in New Zealand. They reported the C:N ratio as a range of 11.7–14.0 for different treatments without significant difference. Rumpel et al. (Citation2012) studied the chemical composition of SOC in different horizons of Andosols in the Mediterranean sub-humid climate, and reported that the C:N ratio in the upper 30 cm ranged from 12 to 16. In this study, the C:N ratio of Andosols was 13.2 ± 2.64, which is in the range of values reported in existing studies. And the C:N ratios of soils belonging to the Medium and Low soil carbon groups were lower at 10.9 ± 2.2 and 10.6 ± 1.9, respectively (). However, the C:N ratios of Non–Andosols in the High soil carbon group are comparable to those of Andosols. According to Batjes (Citation1996), the C:N were 13.3 for Andosols, 11.5 for Cambisols and 11.2 for Fluvisols, which support our results in High carbon group. In addition, the C:N of Histosols by Batjes (Citation1996) is 25.8, which is much higher than that of Organic soils in this study (). This means that a relatively large C:N ratio is one of the characteristics of Andosols, and other high humic soil types can have similar or higher C:N ratios.
Unlike other soils, no significant effect of soil temperature on soil carbon stock was detected in Andosols, suggesting that other factors more strongly controlled SOC stock and C:N ratio. One of the diagnostic criteria in the Japanese soil classification system for Andosols is that ‘the upper 50 cm of the soil contains at least 25 cm of a layer with PAC ≥ 1500’ (Obara et al. Citation2011), and the phosphate adsorption coefficient (PAC) in Andosols is highly correlated with reactive aluminum concentration (Nanzyo, Dahlgren, and Shoji Citation1993; Takata et al. Citation2011a). Therefore, at least for Andosols, it is the organo-mineral complex that contributes to the substantial SOC stock. As many studies have reported, on the other hand, the amount of reactive aluminum and iron phases in soil control the soil organic matter storage across different soil types in humid region (Oades Citation1988; Torn et al. Citation1997; Masiello et al. Citation2004; Bruun, Elberling, and Christensen Citation2010; Wagai et al. Citation2013; Kleber et al. Citation2015; McNally et al. Citation2017). In this study, due to data limitations, we could not analyze the relationship between the SOC stock and reactive aluminum concentration in the Non–Andosols of the High soil carbon group, but we cannot deny the possibility that reactive aluminum concentration in Non–Andosols is also highly correlated with SOC stock. The mineralogical feature of Non–Andosols is, however, different from that of Andosols in terms of the temperature-dependent trend of SOC variation (). The fact that the SOC variation in Andosols did not follow the soil temperature trend suggested that the formation process of the organo–metal complex may not be temperature dependent, or that some of its products are less sensitive to biological activity and thus may exhibit obscure trends in soil temperature. On the other hand, for soils with SOC variations along the soil temperature trend, biological involvement in SOC stock is likely to be a priority. The formation of the organo–metal complex and/or the biological pathways behind the stabilization of organic matter, however, are not completely clear. Some categories of the data set used in this study had too small sample sizes for statistical analysis (‘nt’ in ). It was difficult to examine the effect of soil temperature in more detail than the carbon group analysis shown in . Further analysis to clarify the relationship between soil temperature trends and contributing factors to SOC sequestration will be the subject of future research.
In Lowland soils, which are often influenced by soil sedimentation processes, the Andosols Coverage (AC) had a significant effect on SOC stock (). Furthermore, the effect of temperature may be obscured by the mineralogy of Andosols, which is contrary to the other soil types. Matsui et al. (Citation2021) used the PAC, one of the major items in the Japanese stationary monitoring statistics, as an alternative indicator of pyrophosphate-extractable aluminum concentration and found a positive correlation with SOC both in Lowland soils and Andosols. Temperature-independent trend in the SOC–PAC relationship for Andosols was also found. These results supported the positive involvement of reactive aluminum in organic carbon stabilization. This, however, does not deny the contribution of other factors like iron to the stabilization of soil organic matter. In Lowland soils, the AC value suggested that it may have a significant effect on the amount of SOC, although the effect size was small. AC, therefore, may also need to be considered in the estimation of SOC stock for Lowland soils in the distribution area of Andosols.
Considering the significant differences in SOC stock, TN stock, and C:N ratios among soil carbon groups (), the large variation in SOC and C:N ratios among subgroups of the High carbon group (), and the significant effect of soil temperature on SOC stock in the soils other than Andosols, it would be better to reflect the attributes of modified soil type and soil temperature regime to improve the SOC stock estimation. Since the standard deviation has not been reported in the NIR, we couldn’t compare the accuracy of the NIR estimates with the estimates of this study. Compared to the variability of the average and total SOC stocks calculated simply for each land use, however, the variability of those values calculated by the estimation method in this study was much smaller (cf. formula (3) and (4)), and therefore, we concluded that the estimation method examined in this study would be appropriate. As shown in (gray colored) and in (‘nt’), some categories with little sample size are hard to obtain the reliable estimates. The proposed 16 soil carbon categories, instead of 22 based on the Japanese soil classification system, are expected to alleviate a decline of accuracy in estimation caused by decreasing number of the stationary monitoring sites.
Table 5. Sample size of soil carbon subgroups by soil temperature regime
5. Conclusion
The results of this study are the first public release of data from the top 30 cm of the soil layer. We hope that the information of this paper and the website will be useful for future studies such as accuracy improvement in predicting SOC changes in the RothC model and meta–analysis on global and regional scale. The method introduced in this study for estimating and assessing soil carbon and nitrogen by GIS statistics using modified soil classification and soil temperature regime was appropriate in terms of the variability of the estimated values and the database scale of the stationary surveys. The statistical analysis in this study provided some suggestions: (1) the effect of soil temperature on the SOC stock and C:N of Andosols was unclear, (2) SOC stock and C:N of soils except Andosols were significantly affected by soil temperature, and (3) SOC stock and C:N of the Lowland soils with high Andosols Coverage might exhibit the Andosol–like property to soil temperature. To promote these land resource inventories, these maps will be uploaded on the ‘Japanese Soil Inventory (https://soil-inventory.dc.affrc.go.jp/),’ which is provided by the National Agriculture and Food Research Organization in Japan.
Acknowledgments
The Ministry of Agriculture Forestry and Fisheries of Japan (MAFF) provided access to the database from the Agricultural Land Soil Carbon Stock Basic Survey Project. The prefectural agricultural experiment stations (Hokkaido, Aomori, Iwate, Miyagi, Akita, Yamagata, Fukushima, Ibaraki, Tochigi, Gunma, Saitama, Chiba, Tokyo, Kanagawa, Yamanashi, Nagano, Shizuoka, Niigata, Toyama, Ishikawa, Fukui, Aichi, Mie, Shiga, Kyoto, Osaka, Hyogo, Nara, Wakayama, Tottori, Shimane, Okayama, Yamaguchi, Kagawa, Ehime, Saga, Nagasaki, Kumamoto, Oita, Miyazaki, Kagoshima, Okinawa) assisted with the collection of the data from farmers (2015-2018).
Disclosure statement
The authors have no financial conflicts of interest to disclose concerning the study.
References
- Batjes, N. H. 1996. “Total Carbon and Nitrogen in the Soils of the World.” European Journal of Soil Science 47 (2): 151–163. doi:10.1111/j.1365-2389.1996.tb01386.x.
- Bruun, T. B., B. Elberling, and B. T. Christensen. 2010. “Lability of Soil Organic Carbon in Tropical Soils with Different Clay Minerals.” Soil Biology and Biochemistry 42 (6): 888–895. doi:10.1016/j.soilbio.2010.01.009.
- Coleman, K., and D. S. Jenkinson. 1996. “RothC-26.3- A Model for the Turnover of Carbon in Soil.” D. S. Powlson, P. Smith, and J. U. Smith, edited by. Evaluation of Soil Organic Matter Models Using Existing, Long-Term Datasets, NATO ASI Series I. Vol. 38. Berlin, Heidelberg: Springer; 237–24634
- Cultivated soil Classification Committee. 1995. Classification of Cultivated Soils in Japan Third Approximation. Japan: Miscellaneous Publication of the National Institute of Agro-Environmental Sciences; Vol. 17. 1–79 In Japanese
- Davidson, E. A., and I. A. Janssens. 2006. “Temperature Sensitivity of Soil Carbon Decomposition and Feedbacks to Climate Change.” Nature 440 (7081): 165–173. doi:10.1038/nature04514.
- Giardina, C. P., and M. G. Ryan. 2000. “Evidence that Decomposition Rates of Organic Carbon in Mineral Soil Do Not Vary with Temperature.” Nature 404 (6780): 858–861. doi:10.1038/35009076.
- Guo, L. B., and R. M. Gifford. 2002. “Soil Carbon Stocks and Land Use Change: A Meta Analysis.” Global Change Biology 8 (4): 345–360. doi:10.1046/j.1354-1013.2002.00486.x.
- Intergovernmental Panel on Climate Change (IPCC). 2003. Good Practice Guidance for Land Use, Land Use Change and Forestry. J. Penman, M. Gytarsky, T. Hiraishi, T. Krug, D. Kruger, R. Pipatti, L. Buendia, et al.Eds. Hayama, Japan: IPCC/OECD/IEA/IGES.
- Kanda, T., Y. Takata, K. Kohyama, T. Ohkura, Y. Maejima, S. Wakabayashi, and H. Obara. 2018. “New Soil Maps of Japan Based on the Comprehensive Soil Classification System of Japan–first Approximation and Its Application to the World Reference Base for Soil Resources 2006.” Japan Agricultural Research Quarterly: JARQ 52 (4): 285–292. doi:10.6090/jarq.52.285.
- Kanda, T., Y. Takata, S. Wakabayashi, K. Kohyama, and H. Obara. 2017. “Development of the 1:50,000 Digital Soil Map of Cultivated Soil in Japan according to the Comprehensive Soil Classification System of Japan - First Approximation”. Japanese Journal of Soil Science and Plant Nutrition. 88. 29–34. In Japanese.
- Kleber, M., K. Eusterhues, M. Keiluweit, C. Mikutta, R. Mikutta, and P. S. Nico. 2015. ”Mineral–organic Associations: Formation, Properties, and Relevance in Soil Environments. ”Advances in Agronomy, Vol. 130, 1–140. doi:10.1016/bs.agron.2014.10.005.
- Lal, R. 2004. “Soil Carbon Sequestration to Mitigate Climate Change.” Geoderma 123 (1–2): 1–22. doi:10.1016/j.geoderma.2004.01.032.
- Li, H., S. Yang, M. V. Semenov, F. Yao, J. Ye, R. Bu, Ma, R., Lin, J., Kurganova, I., Wang, X., Deng, Y., Kravchenko, I., Jiang, Y., Kuzyakov, Y., et al. 2021. “Temperature Sensitivity of SOM Decomposition Is Linked with a K-selected Microbial Community.” Global Change Biology. doi:10.1111/gcb.15593.
- Masiello, C. A., O. A. Chadwick, J. Southon, M. S. Torn, and J. W. Harden. 2004. “Weathering Controls on Mechanisms of Carbon Storage in Grassland Soils.” Global Biogeochemical Cycles 18 (4): GB4023. doi:10.1029/2004gb002219.
- Matsui, K., Y. Takata, S. Matsuura, and R. Wagai. 2021. “Soil Organic Carbon Was More Strongly Linked with Soil Phosphate Fixing Capacity than with Clay Content across 20,000 Agricultural Soils in Japan: A Potential Role of Reactive Aluminum Revealed by Soil Database Approach.” Soil Science and Plant Nutrition 1–10. doi:10.1080/00380768.2021.1902750.
- McNally, S. R., M. H. Beare, D. Curtin, E. D. Meenken, F. M. Kelliher, R. C. Pereira, Q. Shen, et al. 2017. “Soil Carbon Sequestration Potential of Permanent Pasture and Continuous Cropping Soils in New Zealand.” Global Change Biology 23 (11): 4544–4555. doi:10.1111/gcb.13720.
- Ministry of Agriculture, Forestry, and Fisheries. 2021. “The Agricultural Land Soil Carbon Stock Basic Survey Project.” 23 April 2021. https://www.maff.go.jp/j/seisan/kankyo/tuti_chyosa.html
- Nanzyo, M., R. Dahlgren, and S. Shoji. 1993. “Chemical Characteristics of Volcanic Ash Soils.” In Volcanic Ash Soils – Genesis, Properties and Utilization, edited by S. Shoji, M. Nanzyo, and R. Dahlgren, 145–187. Netherlands: Elsevier.
- Oades, J. M. 1988. “The Retention of Organic Matter in Soils.” Biogeochemistry 5 (1): 35–70. doi:10.1007/BF02180317.
- Obara, H., T. Ohkura, Y. Takata, K. Kohyama, Y. Maejima, and T. Hamazaki. 2011. “Comprehensive Soil Classification System of Japan First Approximation.” Nogyo Kankyo Gijutsu Kenkyusho Hokoku Bulletin of National Institute for Agro-Environmental Sciences 29: 1–73.
- Post, W. M., and K. C. Kwon. 2000. “Soil Carbon Sequestration and Land-use Change: Processes and Potential.” Global Change Biology 6 (3): 317–327. doi:10.1046/j.1365-2486.2000.00308.x.
- Robertson, G. P., D. C. Coleman, P. Sollins, and C. S. Bledsoe, Eds. 1999. Standard Soil Methods for Long-term Ecological Research (Vol. 2), 94. Oxford, UK: Oxford University Press on Demand.
- Rumpel, C., A. Rodríguez-Rodríguez, J. A. González-Pérez, C. Arbelo, A. Chabbi, N. Nunan, and F. J. González-Vila. 2012. “Contrasting Composition of Free and Mineral-bound Organic Matter in Top-and Subsoil Horizons of Andosols.” Biology and Fertility of Soils 48 (4): 401–411. doi:10.1007/s00374-011-0635-4.
- Scharlemann, J. P., E. V. Tanner, R. Hiederer, and V. Kapos. 2014. “Global Soil Carbon: Understanding and Managing the Largest Terrestrial Carbon Pool.” Carbon Management 5 (1): 81–91. doi:10.4155/cmt.13.77.
- Shirato, Y., and M. Yokozawa. 2005. “Applying the Rothamsted Carbon Model for Long-term Experiments on Japanese Paddy Soils and Modifying It by Simple Tuning of the Decomposition Rate.” Soil Science and Plant Nutrition 51 (3): 405–415. doi:10.1111/j.1747-0765.2005.tb00046.x.
- Shirato, Y., T. Hakamata, and I. Taniyama. 2004. “Modified Rothamsted Carbon Model for Andosols and Its Validation: Changing Humus Decomposition Rate Constant with Pyrophosphate-extractable Al.” Soil Science and Plant Nutrition 50 (1): 149–158. doi:10.1080/00380768.2004.10408463.
- Smith, P., J. U. Smith, D. S. Powlson, W. B. McGill, J. R. M. Arah, O. G. Chertov, K. Coleman, et al. 1997. “A Comparison of the Performance of Nine Soil Organic Matter Models Using Datasets from Seven Long-term Experiments.” Geoderma 81 (1–2): 153–225. doi:10.1016/S0016-7061(97)00087-6.
- Takata, Y., T. Ito, T. Ohkura, H. Obara, K. Kohyama, and Y. Shirato. 2011a. “Phosphate Adsorption Coefficient Can Improve the Validity of RothC Model for Andosols.” Soil Science and Plant Nutrition 57 (3): 421–428. doi:10.1080/00380768.2011.584510.
- Takata, Y., T. Kuwagata, K. Kohyama, and H. Obara. 2011b. “Delineation of Japanese Soil Temperature Regime Map.” Soil Science and Plant Nutrition 57 (2): 294–302. doi:10.1080/00380768.2011.568372.
- Tataka, Y., A. Leon, M. Nakai, H. Obara, and K. Kohyama. 2013. Estimation of Carbon and Nitrogen Content in Surface Horizon Using “Soil Information Web Viewer, 117–124. Vol. 123. Tsu, Japan: Japanese society of Soil Physics.
- Torn, M. S., S. E. Trumbore, O. A. Chadwick, P. M. Vitousek, and D. M. Hendricks. 1997. “Mineral Control of Soil Organic Carbon Storage and Turnover.” Nature 389 (6647): 170. doi:10.1038/38260.
- Van Reewijk, L. P. 1986. “Procedures for Soil Analysis.” Technical Paper 9, International Soil Reference and Information Center (ISRIC), Wageningen, Netherlands.
- Velásquez, G., M. Calabi-Floody, P. Poblete-Grant, C. Rumpel, R. Demanet, L. Condron, and M. L. Mora. 2016. “Fertilizer Effects on Phosphorus Fractions and Organic Matter in Andisols.” Journal of Soil Science and Plant Nutrition 16 (2): 294–309. doi:10.4067/S0718-95162016005000024.
- Wagai, R., A. W. Kishimoto-Mo, S. Yonemura, Y. Shirato, S. Hiradate, and Y. Yagasaki. 2013. “Linking Temperature Sensitivity of Soil Organic Matter Decomposition to Its Molecular Structure, Accessibility, and Microbial Physiology.” Global Change Biology 19 (4): 1114–1125. doi:10.1111/gcb.12112.
- Walkley, A. 1947. “A Critical Examination of A Rapid Method for Determining Organic Carbon in Soils—effect of Variations in Digestion Conditions and of Inorganic Soil Constituents.” Soil Science 63 (4): 251–264. doi:10.1097/00010694-194704000-00001.
- Yokozawa, M., Y. Shirato, T. Sakamoto, S. Yonemura, M. Nakai, and T. Ohkura. 2010. “Use of the RothC Model to Estimate the Carbon Sequestration Potential of Organic Matter Application in Japanese Arable Soils.” Soil Science and Plant Nutrition 56 (1): 168–176. doi:10.1111/j.1747-0765.2009.00422.x.