
ABSTRACT
Phosphorus (P) is an essential element for crop production; however, availability tends to be low due to slow diffusion and high fixation in soils. To cope with phosphate deficiency, white lupines (Lupinus albus L.) form unique root structures called cluster roots. The objective of this study was to elucidate detailed spatial differences of the mechanisms under low-P condition in the root system using rhizoboxes. We cultivated plants in rhizoboxes with P-deficient soil for 33 days. We then harvested roots and the adjacent soil from 128 compartments by dividing 2 × 2 cm squares in the rhizoboxes. We investigated relative expression levels of several genes that encode proteins assumed to be involved in P solubilization or translocation. Additionally, we analyzed fractionated P, soluble metal cations (Fe, Al, and Mn), and enzyme activities in the soil of each compartment. We observed a significant positive correlation between one of the MATE (multidrug and toxic compound extrusion/detoxification) genes, LaMATE6, and soluble metal cations, suggesting the secretion of citric acid into the rhizosphere via MATE proteins increased soluble metal cation concentrations. Furthermore, we demonstrated that roots in the same developmental stages were likely to have different influences on the mobilization of fractionated P in the rhizosphere soil. Our findings highlight the importance of investigating the relationship between soil chemical properties and root functions at a high spatial resolution to elucidate the detailed mechanisms of P mobilization by plants.
1. Introduction
Phosphorus (P) is an essential plant nutrient, and P deficiency limits plant growth and crop yield. Low P availability in soils is often due to high fixation. Excessive application of P fertilizer in agricultural fields causes environmental problems such as eutrophication (Cordell, Drangert, and White Citation2009). Therefore, utilizing the unavailable P accumulated in the soil is necessary for achieving sustainable and stable food production and reducing the environmental burden of agriculture.
Many plants have developed root morphological and physiological strategies to adapt to P starvation, maximizing the efficiency of P mobilization and acquisition from the rhizosphere. Morphological, physiological, biochemical, and molecular biological responses to P deficiency vary among plant species (Wen et al. Citation2019; Dissanayaka et al. Citation2021). Typical examples of morphological strategies include developing more lateral roots and increasing root hair length and density to increase the root surface area (Shen et al. Citation2011). Roots may also produce compounds, such as organic acids and acid phosphatase (AcPase), to solubilize insoluble salts and organic P in the rhizosphere (Vance, Uhde-Stone, and Allan Citation2003). Transcriptional responses, such as the upregulation of genes that encode high-affinity phosphate transporters in roots, increase P uptake (O’Rourke et al. Citation2013; Secco et al. Citation2014; Wasaki et al. Citation2003). Plants can also acquire P indirectly via symbiosis with arbuscular mycorrhizal fungi and other P-solubilizing microorganisms (Van Der Heijden, Bardgett, and van Straalen Citation2008; Rodriguez and Fraga Citation1999; Richardson et al. Citation2009).
White lupine (Lupinus albus. L) adapts to low P environments by developing brush-like roots called cluster roots (Dinkelaker, Hengeler, and Marschner Citation1995; Shane and Lambers Citation2005). Cluster roots increase the root surface area, secrete organic acids and AcPase, and upregulate the expression of high-affinity phosphate transporters (Liu et al. Citation2001; Lambers et al. Citation2006). Furthermore, several studies have clarified the functions of cluster roots at different developmental stages. For example, reports have shown that AcPase activity varies depending on the root developmental stage, and some cluster roots are particularly active, increasing the phosphatase activity hotspot area after cluster root development (Tang et al. Citation2013; Ma et al. Citation2019). Moreover, Neumann et al. (Citation1999) demonstrated that the amount of citric acid and malic acid secreted at each root site varies regardless of the concentration of organic acids inside the cluster roots. In a study using a positron imaging system to investigate the dynamics of photosynthetic products in plants, localized translocation of white lupine roots and localized secretion of high concentrations of photosynthetic products in some soils were visualized, and different patterns of distribution and secretion were observed (Yin et al. Citation2020). It has also been shown that the expression of genes related to metabolic pathways, transporters, enzymes, and hormones differs among the developmental stages of cluster roots (Wang et al. Citation2014; Secco et al. Citation2014; Uhde-Stone et al. Citation2003). A previous study (Neumann et al. Citation2000) has examined differences in specific parts of root functions using plants grown in hydroponic or agar media; thus, the reported phenomena may differ in the soil environment. In addition, it is still unclear how changes in soil elements affect or are affected by responses to changes in the plant, i.e., soil-plant interactions. Furthermore, few studies have examined spatial differences in low P tolerance mechanism throughout the root system and the interaction between the mechanism and the soil in its vicinity.
The present study aims to clarify how soil P dynamics are related to roots P acquisition activity in different stages or characteristics of white lupine roots. We hypothesized that plant roots have different functions depending on their location and developmental stage, influencing the soil, and improving P availability and solubilization. In this study, we investigated the relative expression levels of several genes that encode proteins that may be involved in P mobilization and soil P fractions among specific locations. This research was expected to reveal new insights into the detailed relationship between roots and soil P and other elements dynamics, as well as new insights for dealing with P deficiency in the rhizosphere.
2. Materials and methods
2.1. Plant growth conditions
Soil sample was obtained from Hokkaido University long-term experimental fields established in 1914. The soil type was classified as Haplic Fluvisols. A layer was collected from -P (NK fertilized) plot. Soil physicochemical properties are shown in Table S1. Air-dried soil was passed through a 5-mm sieve, then mixed with perlite at a ratio of 1:1 (v:v). The soil was fertilized as follows: 100-mg N kg−1 soil as (NH₄)₂SO₄, 100-mg K2O kg−1 soil as K2SO4, and 20-mg MgO kg−1 soil as (Ca•Mg(CO3)2). P was not fertilized.
White lupine (Lupinus albus L. cv. Kievskij mutant) seeds were sterilized in 70% ethanol for 10 min, soaked in flowing tap water for 48 h, and sown on vermiculite. In this study, rhizoboxes (20 × 40 × 1.5 cm) were used to distinguish roots from the soil around the plant. After six days, one seedling was placed in 48-µm nylon mesh bags (20 × 40 cm; Clever Co., Ltd., Aichi, Japan). Each mesh bag was sandwiched with a pair of rhizoboxes filled with approximately 1.2 kg of air-dried fertilized soil (Figure S1). Each rhizobox was covered with fitted nylon mesh. To prevent root damage from the pressure of the rhizoboxes, six urethane sheets (2 × 2 × 0.2 cm) were placed between the corners of the rhizoboxes. Plant roots could contact the soil through the mesh to absorb water and nutrients. Plants sandwiched by rhizoboxes were placed vertically and cultured in a glasshouse for 27 days. A small amount of tap water was automatically supplied from the top of the rhizobox by a pump (Iwaki Magnet Pump, Iwaki Co. Ltd., Tokyo, Japan) for 5 min every 2 h from 6:00 to 16:00. Rhizoboxes were opened once when cultivation started and again 10 days before plant harvesting to take photos of the roots for morphology evaluations.
2.2. Plant and soil sampling
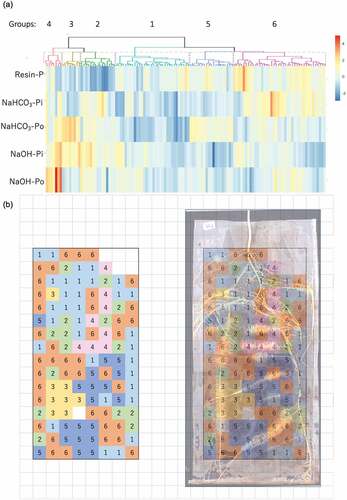
Water was not supplied on the sampling day. Plants in nylon mesh bags were gently separated from the rhizoboxes. Images of roots in the nylon mesh bag were obtained using a flatbed scanner (Sanwa Supply Inc., Okayama, Japan). Plant roots and soil in each square (2 × 2 cm) were collected. A total of 128 squares for roots and 128 squares for soil were collected (Figure S2). After harvesting, root samples were weighed to obtain fresh weights. All collected root samples and a portion of the soil samples from each compartment were immediately frozen with liquid nitrogen and were stored at −80°C for further experiments. The remaining soil samples in each compartment were divided into two; one was stored at 4°C, and the other was air-dried for further analysis. The aboveground plant was dried at 70°C for 48 h and weighed. The compartments were divided into seven types according to the root morphology (). Root morphological classifications were defined as follows: ‘N’ represents the compartments that contain non-cluster roots; ‘C1’ represents cluster roots formed 10 days before the sampling date, i.e., old cluster roots; ‘C2’ represents cluster roots with a tertiary root length of 5 mm or more that developed in the 10 days before sampling, including mature cluster roots; ‘C3’ includes cluster roots with tertiary roots less than 5 mm in length that developed in the 10 days before sampling, i.e., relatively young cluster roots. ‘A’ represents apical roots, which are less than 30 mg and the distance from root apex is less than 50 mm. The compartments which did not adjacent to roots are divided into two types; ‘B,’ which did not contain roots and the distance from the center of the compartment to the nearest root is 15 mm or more. ‘S,’ which did not contain roots, also the distance from the center of the compartment to the nearest root is less than 15 mm. Among three pairs of rhizoboxes, No. 2 was used for further analysis (Figure S3).
Figure 1. (a) Scanned image of root mats. (b) Compartment names, classified as follows: B, Compartments that do not contain roots, with a distance of at least 15 mm from the center of the compartment to the nearest root; N, non-cluster roots; C1, cluster roots formed 10 days prior to the sampling date; C2, cluster roots with a tertiary root length of 5 mm or more that developed in the 10 days prior to sampling; C3, cluster roots with tertiary roots less than 5 mm in length that developed in the 10 days prior to sampling; A, Compartments containing less than 30 mg of roots, with a less than 50 mm distance from the root apex; S, Compartments that do not contain roots, with a less than 15 mm distance from the center of the compartment to the nearest root.
2.3. Plant analysis and real-time quantitative reverse transcription PCR (RT-qPCR)
Dried plant material was weighed and finely ground. Approximately 40 mg of plant material or 20 mg of soil was digested with 1.25 mL of 96% H2SO4 in test tubes at 205°C in a heating block (Yamato Scientific Co. Ltd., Tokyo, Japan) for 6 h. At 20–30 min intervals, 0.5 mL of hydrogen peroxide was added as an oxidant. P concentrations were measured using the molybdenum blue method (Murphy and Riley Citation1962).
RT-qPCR was performed to evaluate differences in transcript levels among cluster root developmental stages or the locations. Five non-cluster root compartments (N), three C1 compartments, and ten C2 compartments were selected for the experiment. C1 and C2 compartments were obtained from three different cluster roots. Total RNA was extracted from root samples using a Maxwell RSC® Plant RNA Kit AS 1500 (Promega Corporation, Madison, WI, USA). First-strand cDNA was synthesized using ReverTra Ace qPCR RT Master Mix with gDNA Remover (Toyobo Co. Ltd., Osaka, Japan). The white lupine 40S gene was selected as an internal reference gene.
The RT-qPCR reactions were performed on a Light Cycler Nano Real-Time PCR Instrument (Roche Diagnostics, Mannheim, Germany) using THUNDERBIRDTM Next SYBR® qPCR Mix (Toyobo Co., Ltd.) with transcript-specific primers (Table S2). We used a 20-µL PCR system and a three-step amplification procedure. After initial denaturing at 95°C for 60s, the reaction was followed by 45 cycles at 95°C for 10s, 55–57°C for 10s, and 72°C for 30s. After the reaction was completed, the melting curve was analyzed. Light Cycler® Nano Software (Roche Diagnostics) and the 2−ΔΔCt method were used for the gene quantitative analysis. Three technical replicates of each sample were applied.
2.4. Soil analysis
Soil P fractionation in each compartment was determined using a modified Hedley fractionation method (Hedley, Stewart, and Chauhan Citation1982). To examine the adaptability of the modified small-scale method, soil samples were analyzed using both the small-scale and standard methods. In the small-scale method, 20 mg soil samples were placed in a 48-well plate and sequentially extracted with solutions as follows: (1) 0.8 mL of distilled water with two resin strips (anion exchange resins in the bicarbonate form; Resin-P); (2) 0.8 mL of 0.5-M NaHCO3 (NaHCO3-P); (3) 0.8 mL of 0.1-M NaOH (NaOH-P); and (4) 0.5 mL of 1-M HCl (HCl-P). Each extraction was performed using a horizontal shaker (EYELA multi-shaker MMS, Tokyo Rikakikai Co., Ltd., Tokyo, Japan) at 180 rpm for 16 h at room temperature. Extracts were then obtained by centrifugation at 2,380 × g for 20 min (multipurpose refrigerated centrifuge EX-125, Tomy Seiko Co., Ltd., Tokyo, Japan). The inorganic phosphate fraction (Pi) concentration in each extract was measured using the molybdenum blue method. The absorbance was determined at 880 nm. The total P in each NaHCO3 and NaOH extract was measured after digestion in ammonium persulfate in an autoclave at 120°C (1 h for the NaHCO3 extract; 2.5 h for the NaOH extract). The organic phosphate fraction (Po) was calculated as the difference between the total decomposed phosphate fraction (total P) and Pi. Residual P was determined by subtracting the concentration of other fractionated P from the total P.
It should be noted that the modified method yielded slightly different results than the standard method, although both measures were significantly correlated in all fractionated P concentrations (Figure S5). For instance, in the small-scale method, the Resin-P fraction tends to have a higher concentration than in the standard method. On the other hand, other fractions tend to show lower concentration in the small-scale method than in the standard one. Thus, the outcomes of the small-scale method should not be considered to be directly the same as that of the standard method. Nevertheless, the modified method can provide valid results under the limitations of comparing the results from each compartment of soil in this investigation. Therefore, the small-scale method can be used as an alternative methodology, if it is utilized to assess fractionated P acquired from the same measurement process.
We performed extractions using diethylenetriamine penta-acetic acid (DTPA) to measure soluble metal contents in the soil of each compartment. The reagent preparation and extraction methods were performed following Soon and Abboud (Citation1993), and the extraction was performed on a small scale due to the small amount of sample per compartment. The DTPA extraction solution contained 5-mM DTPA, 10-mM CaCl2, and 0.1-M triethanolamine. The pH of the extraction solution was adjusted to 7.3 with HCl. One milliliter of DTPA extraction solution was added to a 0.2 g sample of air-dried soil from each compartment, shaken at 120 rpm for 2 h at room temperature, and centrifuged at 4,000 rpm for 10 min. The supernatant was collected using a syringe then filtered through a 0.45-µm membrane filter (cellulose acetate type, Advantec Toyo Co. Ltd., Tokyo, Japan). The residue was extracted again. A 0.5 mL aliquot of each extract was weighed and digested with 2 mL of 61% nitric acid, followed by wet decomposition at 107°C. Al, Fe, and Mn concentrations were determined via inductively coupled plasma mass spectrometry (ICP-MS; Elan, DRC-e; PerkinElmer, Waltham, MA, USA).
AcPase, alkaline phosphatase (AlPase), and chitinase activities in soils were measured using fluorogenic substrates and a multi-label reader (2030 ARVOTM X One; PerkinElmer, Waltham, MA, USA), according to Wasaki et al. (Citation2005). Measurements were performed 1, 4, and 24 h after the start of the experiment. The results were calculated using data measured at 4 and 24 h. Also, pH (H2O) in each compartment soil was determined.
2.5. Data analysis
All statistical analyses were performed using R software (Version 1.3.1093, R Core Team 2020). For plant analysis and enzyme activity experiments, analyses were performed in three experimental replicates. For the total P and phosphate fraction, quantitative analyses were performed in four experimental replicates.
We investigated differences in the relative expression of several genes in N, C2, and C3 compartments. Pearson’s correlation coefficients were determined using soluble metal cation concentrations, fractionated P in soil, and logarithmically transformed relative gene expression.
Fractionated P concentrations were calculated among six types of compartments (N, C1, C2, C3, A, S). One-way analysis of variance (ANOVA) was used to analyze soil-related values in each Group (total P concentration, phosphate fraction concentrations). When a significant difference was indicated, Tukey’s honestly significant difference (HSD) test was performed using a multicomp package of R (p < 0.05).
To investigate fractionated soil data independent from plant root information, hierarchical clustering was performed. We assessed five soil phosphate fractions (Resin-P, NaHCO3-Pi, Po, NaOH-Pi, Po) using the ward.D2 method in cluster R package (Murtagh and Legendre Citation2014). Among 128 compartments, data from the bulk (B) compartments () were used to normalize the rest of the data. In each Group divided by hierarchical clustering, enrichment analysis was performed to analyze whether the proportions of each type of compartment (N, C1 C2, C3, A, S) were significantly different among Groups (p < 0.05). In addition, one-way ANOVA followed by Tukey’s HSD test was performed to assess differences in fractionated P concentrations among Groups.
3. Results
3.1. Plant growth and phosphorus uptake
The dry weight of plants grown in rhizoboxes ranged from 0.69 to 1.09 g and shoot P concentrations ranged from 0.64 to 0.73 mg P g−1 (Table S3). The number of cluster roots per plant ranged from 13 to 18 (Figure S3), observed in every plant during cultivation. As dry weight and P content were similar among all plants (Table S3), we investigated the plant and soil of rhizobox No. 2 as a representative.
3.2. Gene expression patterns in cluster roots
We assessed gene transcript expression among different cluster root developmental stages and locations. shows the relative expressions of six genes related to solubilization of sparingly soluble P and organic P in soil. In C2 roots, transcripts of all six genes were detected at relatively higher levels than in N or C3 (). LaMATE6 (Lalb_Chr02g0156391) and LaMATE7 (Lalb_Chr03g0034071) expressions were also relatively higher in C3 than N (). Similar results were observed in the hydroponic experiment, which showed higher expression of LaMATE, LaMATE6, and LaMATE7 in -P cluster roots (Figure S4). However, none of the differences in expression in N, C2, and C3 were significant ().
Figure 2. Relative expression of genes related to phosphate solubilization at three different developmental root stages (N, non-cluster roots; C2, cluster roots with a tertiary root length of 5 mm or more that developed in the 10 days prior to sampling; C3, cluster roots with tertiary roots less than 5 mm in length that developed in the 10 days prior to sampling.) Data represent relative expressions of (a) LaALMT1, (b) LaALMT2, (c) LaSAP2, (d) LaMATE, (e) LaMATE6, (f) LaMATE7. Error bars represent standard errors. Results from individual compartments are represented as dots on each figure.
We determined Pearson’s correlation coefficients among logarithmically transformed relative gene expression values (Table S4). Significant positive correlations between the expression levels of five genes (LaSAP2, LaALMT1, LaALMT2, LaMATE, and LaMATE6) were detected (p < 0.001; Table S4). LaMATE7 expression was not significantly correlated with the other genes.
3.3. Soil fractionated P in each compartment
To assess the impacts of cluster roots on P in the rhizosphere soil, fractionated P concentrations were calculated in each morphological classification (N, C1, C2, C3, A, and S; Table S5). We expected that the amount of fractionated P in the rhizosphere soil surrounding cluster roots would differ from that surrounding non-cluster roots (N) or apical roots (A). However, no significant differences were detected among compartments. One reason could be that the morphological classification does not reflect information such as the density or the number of roots in each compartment. C1, C2, and C3 were categorized as the soil compartments adjacent to cluster roots. The fresh weight of roots in each compartment, however, ranged from 1.5 mg to 183 mg (data not shown). Hence, compartments classified as C1, C2, or C3 could have diverse effects on rhizosphere soil.
We performed hierarchical clustering with soil data of five fractionated P concentrations that are considered to be labile (Resin-P, NaHCO3-Pi, and NaHCO3-Po) and moderately labile (NaOH-Pi and NaOH-Po) through interaction with plant roots (Negassa and Leinweber Citation2009). These classifications were defined as P dynamics classifications. The cluster analysis identified six clusters, which we defined as Groups 1, 2, 3, 4, 5, and 6 (). The proportions of each morphological classification (), except for bulk, in each Group are shown in . Enrichment analysis was performed to determine whether a particular morphological classification accounted for a significantly higher proportion of each P dynamics classification Group to determine the relationship between morphological classifications and P dynamics classifications. Groups 1, 2, 3, and 5 had significantly different dominant root morphological features (). Group 1 had a significantly higher percentage of N, which accounted for 62.5% of all compartments in the Group. Proportion of C1 was 46.7% in Group2 and C2 accounted for 46.7% of the total in Group 3. Group 4 contained N, C1, and C2, however, none of the morphological classifications were significantly high. In Group 5, the percentage of C3 was significantly higher, and N was significantly lower compared to other Groups. All morphologically classified types were present in Group 6.
Table 1. A number of compartments and proportions of each morphological classification in each group. Root morphological classifications were defined as follows: N, non-cluster roots; C1, cluster roots formed 10 days prior to the sampling date; C2, cluster roots with a tertiary root length of 5 mm or more that developed in the 10 days prior to sampling; C3, cluster roots with tertiary roots less than 5 mm in length that developed in the 10 days prior to sampling; A, Compartments containing less than 30 mg of roots, with a less than 50 mm distance from the root apex; S, Compartments that do not contain roots, with a less than 15 mm distance from the center of the compartment to the nearest root. Values followed by * are significantly different from other groups according to the enrichment analysis(P < 0.05).
Figure 3. Dendrogram and heatmap of hierarchical clustering results. Clustering results were obtained by subtracting the median of the data of compartment B (see ) from the normalized concentrations of five phosphorus fractions of each compartment. (a) Dendrogram. The letters above dendrogram indicate the Group numbers categorized by clustering analysis. Scanned image of root mats combined with the information of the Group location.
Total and fractionated P concentrations in each Group are shown in . Although the total P in the soil was not significantly different among Groups, differences in fractionated P contents were detected (). Resin-P was relatively lower in Groups 2 and 3, both of which had significantly higher ratios of C1 and C2 compartments (). The NaHCO3-Pi fraction was significantly higher in Groups 2, 3, and 4 than in the other Groups (), whereas the NaHCO3-Po fraction was significantly higher in Group 4 than in the other Groups (). In Groups 2 to 6, the NaOH-Pi fraction was significantly higher than that in Group 1, which had a significantly higher proportion of N compartments (). The NaOH-Po fraction was significantly higher in Groups 2, 4, and 6 than in the other Groups (). The concentration of HCl-P was slightly higher in Group 4 and lower in Group 3; however, these differences were not significant ().
Figure 4. Concentrations of (a) Total P, (b) Resin-P, (c) NaHCO3-Pi, (d) NaHCO3-Po, (e) NaOH-Pi, (f) NaOH-Po, (g) HCl-P, (h) the ratio of NaHCO3-Pi to NaHCO3-Po (NaHCO3-Pi/Po), and (i) the ratio of NaOH-Pi to NaOH-Po (NaOH-Pi/Po). The letters below each figure indicate the Group numbers categorized by clustering analysis. Error bars represent standard error. Different alphabets indicate significant differences among Groups according to Tukey’s test (p < 0.05).
To evaluate the effects of enzyme activities in the soil, we calculated the ratio between Pi and Po fractions (NaHCO3-Pi/Po and NaOH-Pi/Po; ). Group 3 had significantly higher ratios of both NaHCO3- and NaOH-Pi/Po. We also investigated AcPase, AlPase, and chitinase activities to determine the relationship between the Pi/Po ratio and enzyme activities. There were no significant differences in AcPase activity (Figure S6a); however, it was relatively higher in Group 3 than in the other Groups. AlPase and chitinase activities in the rhizosphere soil are shown in Figure S6b and S6c. Group 3 showed relatively higher activities of both enzymes, although significant differences were not observed. Group 5 also had relatively higher chitinase activity (Figure S6c). As shown in Figure S6d, soil pH in each group was slightly different. In particular, Groups 2,3,4, and 5 showed relatively low pH.
3.4. Relationship between relative gene expression and soil characteristics
We calculated Pearson’s correlation coefficients to evaluate the relationship between relative gene expression and soil elements, including fractionated P and soluble metal cations (). We detected positive correlations between LaALMT1 and NaHCO3-Po (p < 0.05), LaALMT2 and NaHCO3-Po (p < 0.01), LaMATE and NaOH-Po (p < 0.05), LaMATE6 and NaHCO3-Po as well as NaOH-Po (p < 0.05), and LaSAP2 and NaOH-Po (p < 0.05). We also observed significant positive correlations between relative gene expression and soluble metal cation concentrations (). We observed significant positive correlations between soluble Fe and the following five genes’ expression: LaSAP2, LaALMT1, LaALMT2, LaMATE, and LaMATE6. LaMATE7 expressions were also significantly positively correlated with soluble Al ().
Table 2. Pearson’s correlation coefficients for pairwise relative gene expressions with soluble metal cations concentration or fractionated P in soil.
4. Discussion
4.1. Expression of phosphate solubilization-related genes at specific root location
LaSAP2, LaALMT1, LaALMT2, and LaMATE are phosphate solubilization-related genes that secret AcPase or are induced specifically in cluster roots (Wasaki et al. Citation2000; Wang et al. Citation2014; Zhou et al. Citation2020). In accordance with these studies, relatively high expression of these genes was observed in C2 compartments, which contain mature cluster roots. In this study, LaMATE6 and LaMATE7 were selected as two of the MATE/DTX genes with citrate-exuding motifs, most of which are known as citrate exuders in several MATE proteins (Zhou et al. Citation2021; Upadhyay et al. Citation2019). LaMATE6 had similar expression patterns to other phosphate solubilization-related genes such as LaMATE. The result was consistent with previous analysis (Yamada, Nishida, and Wasaki Citation2022). Thus, the role of LaMATE6 in P acquisition might be similar to other phosphate solubilization-related genes.
Several MATE transporters and ALMT transporters are involved in citrate and malate exudations from roots (Furukawa et al. Citation2007; Sasaki et al. Citation2004). While many studies have shown MATE genes function when secreting citrate against aluminum stress, the role of these genes in addressing P deficiency in white lupine was previously unknown (Uhde-Stone et al. Citation2005). In the present study, we observed significant positive correlations between Fe concentration in soil and the following five genes’ expressions: LaSAP2, LaALMT1, LaALMT2, LaMATE, and LaMATE6. LaMATE7 expression was also significantly positively correlated with soluble Al concentration (). These results imply that the secretion of citric acid into the rhizosphere via MATE protein resulted in the solubilization of metals, increasing their soluble cation concentrations. This finding is compatible with reports that carboxylates increase Al and Fe solubility in soils (Oburger, Jones, and Wenzel Citation2011; Jauregui and Reisenauer Citation1982). Overall, these results suggest that LaMATE6 is more likely to be related to P acquisition and influences citrate exudation from mature cluster roots, although further experiments are required.
4.2. The interaction between root characteristics and soil P fraction
We could not detect a direct relationship between morphological classifications and dynamics of elements such as fractionated P (Table S5). To investigate the interaction between root characteristics and soil properties by applying a different approach, we performed cluster analysis without root morphology data. The hierarchical clustering and enrichment analysis revealed that Groups 1, 3, 4, and 5 had significantly different dominant root features. The cluster analysis did not include any differentiated compartment data, meaning that the result was independent of characteristic root information, such as a developmental stage. Nevertheless, the percentages of specific morphologically classified types in Groups 1, 2, 3, and 5 significantly differed from the other Groups, suggesting interactions between fractionated P in soils and partial root developmental stages (). While we did not observe significant differences in the analysis based on root morphology alone, the P dynamics classification showed that some Groups had significantly different ratios of specific developmental stages. Thus, all roots in the same developmental stage do not have a similar impact on the rhizosphere soil; however, some roots in the same developmental stage have similar effects.
Previous studies have shown that fractionated P in rhizosphere soil differs from that in bulk soil, indicating that white lupines absorb and/or solubilize P (Dissanayaka et al. Citation2015; Imai et al. Citation2019). The proportion of Resin-P was significantly lower in Groups 2 and 3 than in the other Groups. This result is consistent with previous studies reporting utilization of Resin-P by roots (Nuruzzaman et al. Citation2006; Imai et al. Citation2019). The present study also found that NaHCO3-Pi was higher in Groups 2, 3, and 4, which all contained higher ratios of C1 and/or C2 cluster roots. This result indicates that parts of relatively mature cluster roots were related to NaHCO3-Pi, which is relatively labile-P. On the contrary, Group 5, which contains high ratio of C3 cluster roots, showed lower concentration of NaHCO3-Pi. These results were consistent with previous studies that demonstrated citric acid is secreted via mature cluster roots, whereas exudation of citric acid via juvenile roots was not as high as mature roots (Neumann et al. Citation1999, Citation2000). Significantly higher concentrations of NaOH-Pi were observed in Group 3. In contrast, the fraction was lower in Group 1, indicating that some cluster roots functioned to solubilize insoluble organic P. The results were consistent with pH, which was relatively low in Group 3 comparing to Group 1, suggesting that cluster roots might contribute to acidification and solubilization of insoluble P in the rhizosphere. Similar results were obtained in the previous research, which demonstrated low pH around the cluster roots (Neumann et al. Citation2000; Weisskopf et al. Citation2005; Ma et al. Citation2019) These results support different functions of spatial roots and different impacts on the specific part of the soil.
4.3. Utilization of organic P at a specific root location
Previous reports showed that AcPase activity was significantly higher in the rhizosphere of white lupine than in bulk soil (Wasaki et al. Citation2003; Neumann and Martinoia Citation2002). In our study, NaHCO3-Pi/Po and NaOH-Pi/Po were significantly higher in Group 3, with a significantly higher proportion of mature cluster roots. Additionally, AcPase and AlPase activity was relatively higher in Group 3, suggesting that organic P was solubilized around a part of mature cluster roots. Although enzyme activities in the soil in this study were low compared with a previous study (Wasaki et al. Citation2018), we observed a trend of increasing activity near mature cluster roots. This phenomenon is consistent with a previous report that AcPase was secreted significantly more in mature and senescent cluster roots in experiments on agar medium (Tang et al. Citation2013). Also, the result was consonant with a previous study that AlPase activity was higher around mature cluster roots (Wasaki et al. Citation2018). Therefore, organic P solubilization in soil may occur near localized parts of mature cluster roots and then increase the ratio of NaHCO3-Pi/Po and NaOH-Pi/Po in soil.
Furthermore, the expression of LaSAP2, LaALMT1, LaALMT2, LaMATE, and LaMATE6 tended to be higher in areas with higher soil organic phosphate (NaHCO3-Po, NaOH-Po) concentrations (), suggesting that expression levels in roots were related to soil conditions. Although we cannot conclude whether organic P concentration directly affected the expression of phosphate solubilization-related genes in the partial roots. In addition, it should be considered that fractionated P dynamics changes and cannot be explained simply, further study of this potential interaction is warranted.
5. Conclusion
We discovered relationships between gene expression in the specific root zone and soil element dynamics. Our investigation of relative gene expression in root clusters identified new candidates for citrate-transporting MATEs that contribute to insoluble P solubilization. Our results also suggested that the functions of cluster roots developed simultaneously, and fractionated P and some other soil chemical properties differ depending on specific root location. This study clearly indicated the significance of evaluating the characteristic functions in a specific root location and their effects on soil.
Supplemental Material
Download PDF (1.3 MB)Acknowledgments
We are sincerely grateful to the following members at the Hokkaido University: Mr. Satoshi Asaeda, Ms. Hisae Fujimoto, Ms. Yuna Ukai, and Ms. Ayumi Shijyo for sample preparation, measurements of the experiments, and valuable discussions. We also would like to thank Enago (www.enago.jp) for the English language review.
Disclosure statement
No potential conflict of interest was reported by the author(s).
Supplementary material
Supplemental data for this article can be accessed online at https://doi.org/10.1080/00380768.2022.2104103
Additional information
Funding
References
- Cordell, D., J. O. Drangert, and S. White. 2009. “The Story of Phosphorus: Global Food Security and Food for Thought.” Global Environmental Change-Human and Policy Dimensions 19 (2): 292–305. doi:10.1016/j.gloenvcha.2008.10.009.
- Dinkelaker, B., C. Hengeler, and H. Marschner. 1995. “Distribution and Function of Proteoid Rests and Other Root Clusters.” Botanica Acta 108 (3): 183–200. doi:10.1111/j.1438-8677.1995.tb00850.x.
- Dissanayaka, D., H. Maruyama, G. Masuda, and J. Wasaki. 2015. “Interspecific Facilitation of P Acquisition in Intercropping of Maize with White Lupin in Two Contrasting Soils as Influenced by Different Rates and Forms of P Supply.” Plant and Soil 390 (1–2): 223–236. doi:10.1007/s11104-015-2392-x.
- Dissanayaka, D., M. Ghahremani, M. Siebers, J. Wasaki, W. C. Plaxton, and D. Ort. 2021. “Recent Insights into the Metabolic Adaptations of phosphorus-deprived Plants.” Journal of Experimental Botany 72 (2): 199–223. doi:10.1093/jxb/eraa482.
- Furukawa, J., N. Yamaji, H. Wang, N. Mitani, Y. Murata, K. Sato, M. Katsuhara, K. Takeda, and J. F. Ma. 2007. “An Aluminum-Activated Citrate Transporter Inbarley.” Plant & Cell Physiology 48 (8): 1081–1091. doi:10.1093/pcp/pcm091.
- Hedley, M. J., J. W. B. Stewart, and B. S. Chauhan. 1982. “Changes in Inorganic and Organic SOIL-PHOSPHORUS Fractions Induced by Cultivation Practices and by Laboratory Incubations.” Soil Science Society of America Journal 46 (5): 970–976. doi:10.2136/sssaj1982.03615995004600050017x.
- Imai, K., S. Sugihara, J. Wasaki, and H. Tanaka. 2019. “Effects of White Lupin and Groundnut on Fractionated Rhizosphere Soil P of Different P-Limited Soil Types in Japan.” Agronomy-Basel 9 (2). doi:10.3390/agronomy9020068.
- Jauregui, M. A., and H. M. Reisenauer. 1982. “Dissolution of Oxides of Manganese and Iron by Root Exudate Components.” Soil Science Society of America Journal 46 (2): 314–317. doi:10.2136/sssaj1982.03615995004600020020x.
- Lambers, H., M. W. Shane, M. D. Cramer, S. J. Pearse, and E. J. Veneklaas. 2006. “Root Structure and Functioning for Efficient Acquisition of Phosphorus: Matching Morphological and Physiological Traits.” Annals of Botany 98 (4): 693–713. doi:10.1093/aob/mcl114.
- Liu, J. Q., C. Uhde-Stone, A. Li, C. Vance, and D. Allan. 2001. “A Phosphate Transporter with Enhanced Expression in Proteoid Roots of White Lupin (Lupinus Albus L.).” Plant and Soil 237 (2): 257–266. doi:10.1023/a:1013396825577.
- Ma, X. M., K. Mason-Jones, Y. Liu, E. Blagodatskaya, Y. Kuzyakov, A. Guber, M. A. Dippold, and B. S. Razavi. 2019. “Coupling Zymography with pH Mapping Reveals a Shift in Lupine Phosphorus Acquisition Strategy Driven by Cluster Roots.” Soil Biology & Biochemistry 135: 420–428. doi:10.1016/j.soilbio.2019.06.001.
- Murphy, J., and J. P. Riley. 1962. “A Modified Single Solution Method for Determination of Phosphate in Natural Waters.” Analytica Chimica Acta 26 (1): 31–&. doi:10.1016/S0003-2670(00)88444-5.
- Murtagh, F., and P. Legendre. 2014. “Ward’s Hierarchical Agglomerative Clustering Method: Which Algorithms Implement Ward’s Criterion?” Journal of Classification 31 (3): 274–295. doi:10.1007/s00357-014-9161-z.
- Negassa, W., and P. Leinweber. 2009. “How Does the Hedley Sequential Phosphorus Fractionation Reflect Impacts of Land Use and Management on Soil Phosphorus: A Review.” Journal of Plant Nutrition and Soil Science 172 (3): 305–325. doi:10.1002/jpln.200800223.
- Neumann, G., A. Massonneau, E. Martinoia, and V. Romheld. 1999. “Physiological Adaptations to Phosphorus Deficiency during Proteoid Root Development in White Lupin.” Planta 208 (3): 373–382. doi:10.1007/s004250050572.
- Neumann, G., A. Massonneau, N. Langlade, B. Dinkelaker, C. Hengeler, V. Romheld, and E. Martinoia. 2000. “Physiological Aspects of Cluster Root Function and Development in phosphorus-deficient White Lupin (Lupinus Albus L.).” Annals of Botany 85 (6): 909–919. doi:10.1006/anbo.2000.1135.
- Neumann, G., and E. Martinoia. 2002. “Cluster Roots - an Underground Adaptation for Survival in Extreme Environments.” Trends in Plant Science 7 (4): 162–167. doi:10.1016/s1360-1385(02)02241-0.
- Nuruzzaman, M., H. Lambers, M. D. A. Bolland, and E. J. Veneklaas. 2006. “Distribution of Carboxylates and Acid Phosphatase and Depletion of Different Phosphorus Fractions in the Rhizosphere of a Cereal and Three Grain Legumes.” Plant and Soil 281 (1–2): 109–120. doi:10.1007/s11104-005-3936-2.
- O’Rourke, J. A., S. S. Yang, S. S. Miller, B. Bucciarelli, J. Q. Liu, A. Rydeen, Z. Bozsoki, et al. 2013. “An RNA-Seq Transcriptome Analysis of Orthophosphate-Deficient White Lupin Reveals Novel Insights into Phosphorus Acclimation in Plants.” Plant Physiology 161 (2): 705–724. doi:10.1104/pp.112.209254.
- Oburger, E., D. L. Jones, and W. W. Wenzel. 2011. “Phosphorus Saturation and pH Differentially Regulate the Efficiency of Organic Acid anion-mediated P Solubilization Mechanisms in Soil.” Plant and Soil 341 (1–2): 363–382. doi:10.1007/s11104-010-0650-5.
- Richardson, A. E., J. M. Barea, A. M. McNeill, and C. Prigent-Combaret. 2009. “Acquisition of Phosphorus and Nitrogen in the Rhizosphere and Plant Growth Promotion by Microorganisms.” Plant and Soil 321 (1–2): 305–339. doi:10.1007/s11104-009-9895-2.
- Rodriguez, H., and R. Fraga. 1999. “Phosphate Solubilizing Bacteria and Their Role in Plant Growth Promotion.” Biotechnology Advances 17 (4–5): 319–339. doi:10.1016/s0734-9750(99)00014-2.
- Sasaki, T., Y. Yamamoto, B. Ezaki, M. Katsuhara, S. J. Ahn, P. R. Ryan, E. Delhaize, and H. Matsumoto. 2004. “A Wheat Gene Encoding an Aluminum-Activated Malate Transporter.” Plant Journal 37 (5): 645–653. doi:10.1111/j.1365-313X.2003.01991.x.
- Secco, D., H. X. Shou, J. Whelan, and O. Berkowitz. 2014. “RNA-seq Analysis Identifies an Intricate Regulatory Network Controlling Cluster Root Development in White Lupin.” Bmc Genomics 15 (1). doi:10.1186/1471-2164-15-230.
- Shane, M. W., and H. Lambers. 2005. “Cluster Roots: A Curiosity in Context.” Plant and Soil 274 (1–2): 101–125. doi:10.1007/s11104-004-2725-7.
- Shen, J. B., L. X. Yuan, J. L. Zhang, H. G. Li, Z. H. Bai, X. P. Chen, W. F. Zhang, and F. S. Zhang. 2011. “Phosphorus Dynamics: From Soil to Plant.” Plant Physiology 156 (3): 997–1005. doi:10.1104/pp.111.175232.
- Soon, Y. K., and S. Abboud. 1993. “Cadmium, Chronium, Lead and Nickel” in Soil.” In Sampling and Methods of Analysis, edited by M. R. Carter, 101–108. Boca Raton, FL: Lewis Publishers.
- Tang, H. L., X. Q. Li, C. Zu, F. S. Zhang, and J. B. Shen. 2013. “Spatial Distribution and Expression of Intracellular and Extracellular Acid Phosphatases of Cluster Roots at Different Developmental Stages in White Lupin.” Journal of Plant Physiology 170 (14): 1243–1250. doi:10.1016/j.jplph.2013.04.015.
- Uhde-Stone, C., G. Gilbert, J. M. F. Johnson, R. Litjens, K. E. Zinn, S. J. Temple, C. P. Vance, and D. L. Allan. 2003. “Acclimation of White Lupin to Phosphorus Deficiency Involves Enhanced Expression of Genes Related to Organic Acid Metabolism.” Plant and Soil 248 (1–2): 99–116. doi:10.1023/a:1022335519879.
- Uhde-Stone, C., J. Q. Liu, K. E. Zinn, D. L. Allan, and C. P. Vance. 2005. “Transgenic Proteoid Roots of White Lupin: A Vehicle for Characterizing and Silencing Root Genes Involved in Adaptation to P Stress.” Plant Journal 44 (5): 840–853. doi:10.1111/j.1365-313X.2005.02573.x.
- Upadhyay, N., D. Kar, B. D. Mahajan, S. Nanda, R. Rahiman, N. Panchakshari, L. Bhagavatula, and S. Datta. 2019. “The Multitasking Abilities of MATE Transporters in Plants.” Journal of Experimental Botany 70 (18): 4643–4656. doi:10.1093/jxb/erz246.
- Van Der Heijden, M. G. A., R. D. Bardgett, and N. M. van Straalen. 2008. “The Unseen Majority: Soil Microbes as Drivers of Plant Diversity and Productivity in Terrestrial Ecosystems.” Ecology Letters 11 (3): 296–310. doi:10.1111/j.1461-0248.2007.01139.x.
- Vance, C. P., C. Uhde-Stone, and D. L. Allan. 2003. “Phosphorus Acquisition and Use: Critical Adaptations by Plants for Securing a Nonrenewable Resource.” New Phytologist 157 (3): 423–447. doi:10.1046/j.1469-8137.2003.00695.x.
- Wang, Z. R., D. Straub, H. Y. Yang, A. Kania, J. B. Shen, U. Ludewig, and G. Neumann. 2014. “The Regulatory Network of cluster-root Function and Development in phosphate-deficient White Lupin (Lupinus Albus) Identified by Transcriptome Sequencing.” Physiologia Plantarum 151 (3): 323–338. doi:10.1111/ppl.12187.
- Wasaki, J., M. Omura, M. Ando, H. Dateki, T. Shinano, M. Osaki, H. Ito, H. Matsui, and T. Tadano. 2000. “Molecular Cloning and Root Specific Expression of Secretory Acid Phosphatase from Phosphate Deficient Lupin (Lupinus Albus L.).” Soil Science and Plant Nutrition 46 (2): 427–437.
- Wasaki, J., T. Yamamura, T. Shinano, and M. Osaki. 2003. “Secreted Acid Phosphatase Is Expressed in Cluster Roots of Lupin in Response to Phosphorus Deficiency.” Plant and Soil 248 (1–2): 129–136. doi:10.1023/a:1022332320384.
- Wasaki, J., A. Rothe, A. Kania, G. Neumann, V. Romheld, T. Shinano, M. Osaki, and E. Kandeler. 2005. “Root Exudation, Phosphorus Acquisition, and Microbial Diversity in the Rhizosphere of White Lupine as Affected by Phosphorus Supply and Atmospheric Carbon Dioxide Concentration.” Journal of Environmental Quality 34 (6): 2157–2166. doi:10.2134/jeq2004.0423.
- Wasaki, J., J. Sakaguchi, T. Yamamura, S. Ito, T. Shinano, M. Osaki, and E. Kandeler. 2018. “P and N Deficiency Change the Relative Abundance and Function of Rhizosphere Microorganisms during Cluster Root Development of White Lupin (Lupinus Albus L.).” Soil Science and Plant Nutrition 64 (6): 686–696. doi:10.1080/00380768.2018.1536847.
- Weisskopf, L., N. Fromin, N. Tomasi, M. Aragno, and E. Martinoia. 2005. “Secretion Activity of White Lupin’s Cluster Roots Influences Bacterial Abundance, Function and Community Structure.” Plant and Soil 268 (1–2): 181–194. doi:10.1007/s11104-004-0264-x.
- Wen, Z. H., H. B. Li, Q. Shen, X. M. Tang, C. Y. Xiong, H. G. Li, J. Y. Pang, M. H. Ryan, H. Lambers, and J. B. Shen. 2019. “Tradeoffs among Root Morphology, Exudation and Mycorrhizal Symbioses for phosphorus-acquisition Strategies of 16 Crop Species.” New Phytologist 223 (2): 882–895. doi:10.1111/nph.15833.
- Yamada, H., S. Nishida, and J. Wasaki. 2022. “Ethylene Works as a Possible Regulator for the Rootlet Elongation and Transcription of Genes for Phosphorus Acquisition in Cluster Roots of Lupinus Albus L.” Soil Science and Plant Nutrition 68 (3): 383–392. doi:10.1080/00380768.2022.2050662.
- Yin, Y. G., N. Suzui, K. Kurita, Y. Miyoshi, Y. Unno, S. Fujimaki, T. Nakamura, T. Shinano, and N. Kawachi. 2020. “Visualising spatio-temporal Distributions of Assimilated Carbon Translocation and Release in Root Systems of Leguminous Plants.” Scientific Reports 10 (1). doi:10.1038/s41598-020-65668-9.
- Zhou, Y. P., B. Neuhauser, G. Neumann, and U. Ludewig. 2020. “LaALMT1 Mediates Malate Release from phosphorus-deficient White Lupin Root Tips and Metal Root to Shoot Translocation.” Plant Cell and Environment 43 (7): 1691–1706. doi:10.1111/pce.13762.
- Zhou, Y. P., P. Olt, B. Neuhauser, N. Moradtalab, W. Bautista, C. Uhde-Stone, G. Neumann, and U. Ludewig. 2021. “Loss of LaMATE Impairs Isoflavonoid Release from Cluster Roots of phosphorus-deficient White Lupin.” Physiologia Plantarum 173 (3): 1207–1220. doi:10.1111/ppl.13515.