
 ?Mathematical formulae have been encoded as MathML and are displayed in this HTML version using MathJax in order to improve their display. Uncheck the box to turn MathJax off. This feature requires Javascript. Click on a formula to zoom.
ABSTRACT
Traditional slash-and-burn agriculture has been practiced for centuries in Southeast Asia. Our past study has identified distinctly different soil profile characteristics over a very short distance within a sloping field. In order to accurately estimate the potential of the traditional slash and burn cropping system for soil C sequestration as well as the maintenance of soil fertility, the spatial variation of soil C stock, soil nutrient status, and soil reactions were studied in Sabah, Malaysia. A triangular grid was used to conduct intensive soil sampling with an interval of about 5.8 m and a total of 71 locations. Total C (TC) stock was high with a mean of 34.9 Mg ha−1 and the spatial variation was extreme with a CV of 57.3% within a field. The spatial range was also short at 14.3 m. All soil nutrients had high CVs especially for available phosphate at 90.2% and the lowest for exchangeable potassium at 44.0%. Available phosphate was the most limited major nutrient when referencing the Japanese fertilizer guidelines, and its spatial distribution was affected by soil acidity status, especially exchangeable Al. Potential improvements of the production systems can be made by the application of lime materials in locations where TC content was low. However, the introduction of any external inputs requires careful assessment of not just crop productivity but also its consequences for long-term sustainability of the system. Future studies are anticipated in order to understand the response of crop productivity by pH improvement as well as the use of fertilizers.
1. Introduction
Soil organic carbon (SOC) is a crucial part of environmental conservation both at the global and local scale (Bruun et al. Citation2009; Paustian et al. Citation2016). At the global scale, the pool of SOC is important as it is one of the major components of the global C cycle and may act both as a source and as a sink of atmospheric CO2. At the local scale, the maintenance of SOC is closely linked to various soil functions important both for long-term productivity of agricultural products as well as the soil ecosystem as a whole.
In Southeast Asia, slash-and-burn agriculture (i.e., shifting cultivation) is the traditional land use of the sloping uplands (Garrity Citation1993). The traditional slash and burn agriculture is generally considered an ecologically sound system because it is well-adapted to the local environment and climate (Tanaka Citation2012). This agricultural system tends to reuse fields by slashing and burning secondary vegetation and largely avoiding the disturbance of virgin lands (Padoch Citation1982). Myers (Citation1992) has described the difference between indigenous shifting cultivators and shifted cultivators, the latter of which is practiced by recent migrants who are unfamiliar with local environmental conditions (Kleinman, Pimentel, and Bryant Citation1995). Many countries now criticize slash-and-burn agriculture or ban it as the source of atmospheric CO2 and the cause of deforestation (Bruun et al. Citation2009; Fajrini Citation2022). On the contrary, many scholars and development experts have been showing evidence that some forms of slash-and-burn agriculture can be sustainable when land use pressure is low, and that it can be a viable option for local farmers (Cherrier, Maharjan, and Maharjan Citation2018).
Under traditional slash-and-burn systems, C and nutrients are primarily provided through the burning of existing biomass often without external inputs including inorganic fertilizers or agrochemicals. Part of the biomass is turned into charcoal or biochar as well as ash, which is composed of incomplete biomass combustion products. Both charcoal and biochar are defined as carbonaceous materials as a result of heating organic materials at high temperature under low oxygen supply (Wiedner and Glaser Citation2015). While charcoal is primarily produced as an energy carrier, biochar is produced particularly for a soil application and environmental management. Fearnside, Graça, and Rodrigues (Citation2001) have shown that only small fraction of the original forest biomass C was turned into charcoal (1.8%) when forest was cleared into cattle pasture near Manaus, Brazil. The quantity and quality of pyrogenic C created depends on the biomass conditions (type of biomass, quantity, and conditions) as well as burning conditions (burning temperature, oxygen concentration, and duration; Preston and Schmidt Citation2006) when they studied the importance of fire on forest ecosystems. Biochar materials do not support microbial activity and act as a recalcitrant component of soil C (Kuhlbusch Citation1998). Therefore, in traditional slash-and-burn agriculture that has been practiced for a long time, the accumulation of biochar in soils can be significant even if the fraction of biomass turned into biochar per slash and burn cycle is small.
Kinoshita et al. (Citation2021) conducted a multiple soil profile survey within a single field in the state of Sabah in Malaysia. They found soil total C (TC) concentration of 78.8 g kg−1 in the Ap horizon in one of the two profiles, which is extremely high for Luvisols of the humid tropics. This high C concentration affected the cation exchange capacity (CEC) to be extremely high at 41.8 cmolc kg−1 and also coincided with high contents of several macronutrients. However, in the other soil profile 15 m away within the same field, the TC concentration was much lower at 19.3 g kg−1 as were other soil characteristics. This large difference in the TC concentration as well as other soil properties hinder the assessment of the impacts of traditional slash and burn agriculture on soil C sequestration and the maintenance of soil fertility. Therefore, there is a need to conduct more intensive soil sampling to assess the spatial variation of soil TC stock, soil nutrient status, and soil reaction in a small sloping field under traditional slash-and-burn agriculture in Sabah, Malaysia. This paper presents both the magnitude and spatial variability of soil TC stock, soil nutrient status, and soil reaction important for crop production within a field and assesses the important soil forming factors that control this variation to assess the current soil conditions of the system and potential for improvement.
2. Materials and methods
2.1. Study site
This study was conducted in Tudan village which is located 1,130 m a.s.l. in the Crocker Range in the central Sabah state of Malaysia (5° 51‘N; 116° 19’ E; ; Suzuki et al. Citation2015). Geological features of the area are mainly sandstone and siltstone mixed with mudstone of Paleocene to Eocene epoch (Hutchison Citation2005). According to the Köppen-Geiger classification (Peel, Finlayson, and McMahon Citation2007), the climate is a tropical rainforest climate (Af); with the driest month having precipitation more than 60 mm.
Figure 1. Map of Tudan village in Sabah, Malaysia.
Upland rice is the main crop planted in the first year after slash-and-burn and a mixture of vegetables is cultivated for a few years after the upland rice. The field is then left as fallow for more than 10 years for the secondary vegetation to regrow. In general, no fertilizer and agrochemicals are used and the field has not been tilled. The field under study was burned in March 2015.
2.2. Field survey and soil sampling
The survey was conducted in October 2016 in the second year after burning. The field size was about 0.2 ha, 50 m from east to west and 35 m from north to south (). The elevation ranged from 1,169 to 1,190 m and the slope ranged from 3.65 to 36.5°. Based on the results of Kinoshita et al. (Citation2021), the spatial variation of soil properties was occurring at less than the 15 m in distance where they made two soil profiles. Therefore, there was a need to take soil samples at a closer interval than 15 m. A total of 71 points were selected every 5 m in the east-west direction and every 5.8 m in the north-south direction so that the points would form an equilateral triangle with a side of 5.8 m. It was assumed that the east-west direction would have higher spatial variation of soil properties due to the slope, so the survey points were located closer in that direction. The sampling points can be regarded as transects in the north-south direction, and there were 12 lines denoted from Transect A through L. Latitude, longitude, and altitude were recorded at each sampling location using a GPS device (eTrex 20×J; Garmin Ltd., Kansas, U.S.A).
Figure 2. Map of sampling locations within the study field. The sample name denotes the transect name from a through L and the sample number.
According to Kinoshita et al. (Citation2021), TC concentration of the A horizon was significantly different in each soil profile, but subsoil TC concentration did not vary much. Also, O horizon or root mat were absent in the field. Therefore, soil samples down to the lower limit of the A horizon were collected in this study. At each sampling location, a mini-soil profile was made to a depth of 30 cm, and the depth of the A horizon was measured. Soil samples were collected every 5 cm depth from the surface using a 100 ml stainless sampling tube. If the depth of the A horizon was 5 cm or less, the sample was collected up to 10 cm deep. To measure bulk density, two samples were collected from the 0-to-5 cm layer and one sample from 5 cm or deeper to minimize measurement error at the surface. A total of 197 soil samples were collected. A small fraction of each sample was dried at 105°C to estimate soil moisture content for dry bulk density measurement. The rest of soil samples were air-dried, passed through a 2-mm sieve followed by the removal of visible plant roots and used for further analysis.
2.3. Soil analysis
Soil bulk density was determined as the dry weight per unit volume of the soil sampling core. The following analyses were undertaken based on the methods presented in the Methods of Soil Environmental Analysis (Committee for Methods of Soil Environment Analysis Citation1997). TC concentration was measured using a dry combustion method with a CHN automated elemental analyzer (Vario EL III, Elementar Analysensysteme, Hanau, Germany). TC stock was calculated using TC concentration and bulk density for every 5 cm up to the depth of the A horizon. The pH (H2O) and pH (KCl) were measured using a 1:2.5 soil/water and soil/1 mol L1 KCl ratio, respectively. The extract of the pH (KCl) was also used for exchangeable Al (Ex-Al) measurement using an inductively coupled plasma emission spectrometer (ICPS-8100, Shimadzu Corporation, Kyoto, Japan). Both NO3–N and NH4–N were extracted using 2 mol L1 KCl and measured colorimetrically by a flow injection analyzer (FIAstar 5000, FOSS, Hilleroed, Denmark). The sum of NO3–N and NH4–N was reported as inorganic N. Exchangeable cations were measured using 1 mol L−1 ammonium acetate at pH 7.0. Extracted Ca2+, Mg2+, K+, and Na+ (Ex-Ca, Ex-Mg, Ex-K, and Ex-Na) were measured by an atomic absorption spectrophotometer (Z-5010, Hitachi High-Tech Corporation, Tokyo, Japan). Available phosphate (AVP) was determined by the Truog method, and the concentration of phosphate in the extract was measured using a molybdate blue method with a spectrophotometer (UV mini-1240; Shimadzu Corporation, Kyoto, Japan).
2.4. Statistical analysis
The gstat package (Pebesma Citation2004) in the R statistical computing environment was used for all geostatistical modeling. Note that the statistical analyses in this paper are principally for descriptive purposes. Semivariance (γ(h)) was calculated as eq. (1) at each lag (h), which is the distance between samples.
where γ(h) is the semivariance between two locations that are separated by a distance h, and m(h) is the number of pairs at distance h.
After calculation of the semivariance, a spherical model was fitted to describe the relationship between semivariance and lag. Frequently the semivariance increases with increasing lag, but often reaches a maximum at some distance. The semivariance at this maximum value is called the sill. The lag when the sill is reached is called the range, and this indicates the shortest distance of spatial dependence. The semivariance when the lag is 0 is called a nugget and may reflect measurement error, or spatial variation on a scale finer than the observed grid size. In order to consider the spatial dependence, we used the Q value (eq. 2) that represents the degree of spatial dependence.
The Q value takes a value in the range of 0 to 1, and when Q < 0.25, the spatial dependence is low, when 0.25≤Q ≤ 0.75, the spatial dependence is medium, and when Q > 0.75, spatial dependent is considered to be high (Cambardella et al. Citation1994).
3. Results
3.1. Total C stock and spatial variation
TC stock in the depth of the A horizon ranged from 4.01 to 116 Mg ha−1 with a mean of 34.9 Mg ha−1 (; ). There was an extreme variation in the TC stock with a CV of 57.3%. The depth of the A horizon was also variable, ranging from 2 to 25 cm with a mean of 11.6 cm.
Figure 3. Histogram of the total C stock in the depth of a horizon at 71 locations.
Table 1. Descriptive statistics of the measured soil properties.
A semivariogram and spherical model revealed a strong spatial dependence of TC stock with the Q value of 0.79 (). The range was very short at 14.3 m, indicating the presence of clear small patches of higher and lower TC stock within this field. The TC stock was large in the central part of the field ranging from 31.4 to 49.1 Mg ha−1, and tended to be lower from the southwest to the southeast ranging from 16.0 to 27.7 Mg ha−1 ().
Figure 4. Map of a) total carbon stock, b) inorganic nitrogen, c) available phosphate, d) exchangeable potassium, e) pH (H2O), and f) exchangeable aluminum.
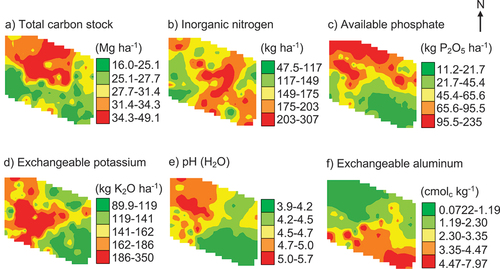
Table 2. Range and Q values of the soil properties from the spatial modeling.
3.2. Soil fertility status and spatial variation
The inorganic N in the depth range of 0–10 cm ranged from 40.8 to 312 kg ha−1 with a mean of 170 kg ha−1 (). Most of the inorganic N was in the form of NO3-N and the amount of NH4-N was only about 12% of the inorganic N. The CV was much higher for NH4-N at 99.5% compared to 32.5% for NO3-N. AVP ranged from 10.7 to 247 kg ha−1 with a mean of 59.1 kg ha−1, which had the second highest CV at 90.2% after NH4-N. Ex-K ranged from 79.1 to 375 kg ha−1 with a mean of 159 kg ha−1. The CV of Ex-K was the lowest among the base cations with 44.0% compared to Ex-Mg (50.7%) and Ex-Ca (64.9%; ).
The spatial dependence was strong for AVP, Ex-Mg, and Ex-Ca with the Q value of 0.88, 0.88, and 0.93, respectively. For inorganic N and Ex-K, the spatial dependence were medium with the Q value of 0.58 and 0.34, respectively. The ranges for inorganic N and AVP were about the same as for TC stock at around 14 m. On the other hand, Ex-K and Ex-Ca showed slightly longer ranges, and the range for Ex-Mg was the longest at 25.7 m (). Inorganic N showed a somewhat similar spatial distribution as TC stock but it was different in the southeastern part of the study region (). AVP showed a generally similar spatial distribution to that of TC stock where they were both low in the southern part of the study region () though the distribution on the northern side was somewhat different. Ex-K, Ex-Mg, and Ex-Ca showed similar spatial distributions with lower values toward the southeastern side; thus, only Ex-K is shown as a map (). In the southwestern part, Ex-K was very different from soil C stock.
3.3. Soil acidity status and spatial variation
The soils in the field were acidic with some locations showing strong acidity with a pH (H2O) less than 4.0. The range of pH (H2O) in the surface 10 cm varied from 3.8 to 5.9 with a mean of 4.5, and pH (KCl) showed slightly lower values from 3.5 to 5.3 with a mean of 3.9 (). Ex-Al varied from 0.001 to 8.45 cmolc kg−1 with a mean of 2.36 cmolc kg−1.
The spatial dependence was strong for pH (H2O) and moderate for pH (KCl) and Ex-Al (). The range was much longer than other soil parameters at 42.9 m for Ex-Al and 48.0 m for pH values. The spatial pattern was similar to soil nutrients where pH was higher in the northwest and lower in the southeast (). Accordingly, high Ex-Al values were concentrated in the southeastern part ().
3.4. Relationships among soil properties
TC stock showed strong correlation to various soil properties. The relationships were the strongest with Ex-Mg and Ex-Ca and a negative relationship to Ex-Al (). The relationships with AVP and inorganic N were lower and there was no relationship with Ex-K. For inorganic N, the relationship was stronger with NO3-N and no relationship with NH4-N was found. Interestingly, relationships between NO3-N and other soil nutrients were low but the relationships between NH4-N and other parameters were high especially with pH (H2O). The locations with NH4-N exceeding 20 kg ha−1 were only found where pH (H2O) was about 4.0 or lower. These very acidic locations were concentrated along the southeastern side () where base cations were also low. pH (H2O) and pH (KCl) showed negative relationships with Ex-Al.
Table 3. Pearson correlation among the measured soil properties at p < 0.01.
4. Discussion
4.1. Effects of slash-and-burn agriculture on total C stock
The soil in this field was classified into Acrisols and Luvisols (Kinoshita et al. Citation2021). A past report suggests that Acrisols contain an average of 51 Mg ha−1 (n = 309) and Luvisols contain an average of 31 Mg ha−1 TC (n = 604) in soil samples collected from uncultivated land across the world up to a depth of 30 cm (Batjes Citation1996). Out of the 71 locations sampled, the amount of TC stock exceeded 51 Mg ha−1 in 10 locations and 31 Mg ha−1 in 34 locations even though the average depth of the A horizon was 11.6 cm in this field. The maximum TC stock was 116 Mg ha−1, which was equivalent to the average TC stock of Andosols (114 Mg ha−1; Batjes Citation1996). In a study conducted in nine traditional slash-and-burn agricultural fields of Sarawak, Malaysia, SOC stock of 40.0 Mg ha−1 was found in the surface 20 cm soil surface (Bruun et al. Citation2013), which was similar to our finding.
The range and magnitude of the spatial variation of soil properties in this field were extreme compared to past studies. In the Brazilian Amazon where Ultisols and Entisols are distributed, the range of SOC stock up to a depth of 30 cm was from 15.4 to 64.4 Mg ha−1 with a CV of 32.5% (Ceddia et al. Citation2015). In our study, the CV of TC stock was 57.3%, which shows that the spatial variation of TC stock can be more significant in a sloping slash-and-burn field compared to other systems including forests.
There was a tendency of the TC stock to be larger where the slope gradient was lower. Soil sampling locations with a slope less than 25° had a mean TC stock of 36.2 Mg ha−1 but locations with a slope more than 25° had a mean value of 29.8 Mg ha−1 though the mean difference was not statistically significant using a t-test (p = 0.273). The range of spatial variation of TC stock was short at 14.3 m indicating patchy distributions. TC stock in each transect was assessed in detail: the Transect E showed a mean slope of 16.1° and the mean TC stock was 43.4 Mg ha−1 whereas Transect I had a mean slope of 15.3° and a mean TC stock of 22.7 Mg ha−1 (). Among the two transects, the slope angle was almost the same but there was a significant concave topography in Transect E indicating the importance of microtopography especially a concave topography in creating a zone of high TC stock (Kinoshita et al. Citation2021). When comparing Transects H and K, they both had some undulating topography but the slope was much steeper for Transect K and TC stock being much lower at 27.6 Mg ha−1 (). Also, the majority of Transect K was under a convex topography. The biochar supplied by slash-and-burn could have accumulated in depressions and they were not eroded away when the slope was gentle. Meanwhile, they were eroded away where the topography was convex or where the slope was steep. This undulating microtopography of the mountainous area seemed to be the cause of significant spatial variations of TC stock in this field. In addition to microtopography, parent materials may have impacted the vertical distribution of TC stock and its spatial variation. The parent materials of the study area are mainly sandstone and siltstone mixed with mudstone (Hutchison Citation2005). TC stock and A horizon depth were highly correlated in this study (p = 0.918; p < 0.001). Kinoshita et al. (Citation2021) showed the importance of subsurface soil texture on TC content and A horizon depth in the same field. Where the Bt1 horizon (27–50 cm depth) was light clay texture with clay content of 41.4%, the A horizon depth was 27 cm and TC content varied from 78.8 to 47.4 g kg−1. Where the Bt horizon (33–55 cm depth) was heavy clay with clay content of 73.9%, the A horizon depth was 12 cm and TC content was 19.3 g kg−1. Major et al. (Citation2010) showed a movement of black C through a soil profile in sandy clay loam texture. They identified the surface applied black C to infiltrate down to the depth of 30 cm. Other research has been conducted to study the effects of biochar particle size on the effects on their vertical movement through a soil column (Zhang et al. Citation2010). It can be speculated that coarser soil texture in subsurface horizon allows the biochar materials to infiltrate into a deeper soil making the A horizon to be thicker and that results in higher TC stock. However, some critical information on the spatial variation of 1) soil properties before burning, 2) biomass of secondary vegetation before burning, 3) the burning intensity, and 4) the supply of ash and biochar were not collected for this study, and these information will be necessary to gain conclusive information of the major factors affecting the spatial variation of TC stock.
Figure 5. A cross sectional transect of the field in the west-east direction with the depth of a horizon and total C stock (TC).
4.2. Effects of biochar and ash on soil properties
The positive relationships found among TC stock, Ex-Mg and Ex-Ca indicate that the majority of the negative charge sites provided by 2:1 to 2:1:1 clay minerals identified by Kinoshita et al. (Citation2021) and humic substances appear to be dominated by these cations. On the other hand, the relationship between TC stock and K was low. K contained in biochar is more readily available for plants compared to Ca and Mg when hardwoods and softwoods were used as feedstocks (Ippolito et al. Citation2015), and it might have been lost from the biochar. Also, ash produced during slash and burn was reported to contain on average 57% of K originally contained in the aboveground biomass, which is higher than Ca, P, and N due to lower volatilization and convective loss during burning (Giardina et al. Citation2000). Fine ash is known to be highly susceptible to loss by wind and water erosion and its inputs to the field are spatially very heterogeneous (Raison, Khanna, and Woods Citation1985). Therefore, the spatial distribution of ash and biochar input might have been very different, and this could have affected the spatial distribution of K. In slash and burn agriculture, soil heating during burning is known to cause high rates of microbial mortality and releases large amounts of N and P (Giardina et al. Citation2000; Serrasolsas and Khanna Citation1995). The spatial variation of heating temperature was not measured in this study, but the influence of its variation could be persisted for N and P even two years after burning.
Also, there was a negative relationship between total C concentration and bulk density (r = −0.830; ). From the soil profile survey in this field, a strong development of granular structure in A horizon was observed where the TC concentration was high (Kinoshita et al. Citation2021). Biochar is known to aid the formation of soil aggregates and helps to improve soil physical characteristics (Whitman, Singh, and Zimmerman Citation2015). Stronger formation of granular structures was also observed in this study where TC stock was large compared with areas where the TC stock was smaller, indicating biochar supply also changed soil physical properties.
Figure 6. Relationship between total C concentration and dry bulk density (n = 197).
4.3. Soil fertility conditions of slash-and-burn agriculture
In order to assess the state of soil nutrient conditions, there was a need to compare the soil test results against verified references. It was extremely difficult to find a comprehensive reference on soil nutrient status for Malaysian soils, and thus the Japanese guideline was applied just to understand the relative fertility (Department of Agriculture, Hokkaido Government Citation2015). The mean bulk density and the depth of A horizon of the field were 1.11 Mg m−3 and 11.6 cm, respectively. For the simplicity of calculation, bulk density of 1.00 Mg m−3 and the depth of soil of 10 cm were used to calculate the optimum range of AVP and Ex-K for upland crops. The optimum ranges were between 100 and 300 kg ha−1 and 150 and 300 kg ha−1 for AVP and Ex-K, respectively (Department of Agriculture, Hokkaido Government Citation2015). There is no optimum range set for inorganic N, therefore the hot-water extractable N range was used as a reference, and between 100 and 200 kg ha−1 was set as the optimum. Out of the 71 sampling locations, about 80%, 20%, and 40% of the locations had optimum or more soil nutrients for N, P, and K, respectively. P appeared to be the most limited nutrients among the three major elements especially in the southeastern side of the field.
Rodenburg et al. (Citation2003) studied the spatial variation of pH and BrayII-P in a post-productive rubber agroforest that was slashed-and-burned in Sumatra, Indonesia. The field was a 1 ha convex-concave field with slopes ranging from 0 to 35° under Typic Dystropept or Typic Tropofluvents (Soil Survey Staff Citation1994). Their data showed a Q value of 0.89 and a range of 7.54 m for AVP; the former is almost the same as our finding. They concluded soil run-off and sedimentation processes influenced the spatial variation of soil fertility in the field. Our study field also had similar slope gradient as well as convex-concave topography and thus soil run-off and sedimentation process could affect the supply of P across the field. There was a significant positive correlation between TC and AVP (), though the relationship was weak and indicated the influence of other factors.
Soil acidity was severe and Ex-Al was high in the southeastern part of the field. Exchangeable Al exceeding 2 cmolc kg−1 is known to limit root growth (Saigusa Citation1994), and about 50% of the area exceeded this threshold in this field. The majority of clay minerals were identified as 2:1 to 2:1:1 type (Kinoshita et al. Citation2021), which can release structural Al when the pH becomes lower (Saigusa Citation1994). In this field, Ex-Al was particularly high in the subsoils (Kinoshita et al. Citation2021). The southeastern part had steeper slope and shallow A horizon thickness compared to other parts of the field (), indicating that subsoils with potentially high Ex-Al appear closer to the soil surface. There was a significant negative correlation between Ex-Al and AVP () indicating that the P is precipitated as aluminum phosphate salt making the P unavailable. Therefore, the alleviation of acidity and lowering of Ex-Al is essential for making P available to plants in the southeastern side of the field.
4.4. Future recommendations
The government of Sabah state recommends not to conduct slash-and-burn agriculture where the slope is 25° or more (personal communication). Our data generally support this recommendation that the land with a slope angle more than 25° has lower TC stock. However, field-average TC stock was high even compared to uncultivated natural vegetation of the same soil type (Batjes Citation1996).
Currently, there are no fertilizer or agrochemicals used in this system. The soil fertility conditions were optimum in most of the areas for N. If improvements of crop productivity are sought, P appears to be the limiting factor and the application of phosphate fertilizer is recommended by the local government (personal communication). However, this will not be effective in areas where the soil pH is low. In this case, the application of lime materials can be recommended to increase soil pH (H2O), first to alleviate Al toxicity but also to improve AVP after a careful consideration of the amount of lime required, cation balances, and the cost of application. The areas with high Ex-Al had low TC stock (), therefore soil color may become a useful indicator for local farmers to decide in which areas to apply lime materials.
5. Conclusions
In a sloping upland field under a traditional slash-and-burn agricultural system, total C stock (TC) was high but the spatial variation was extreme even at a very short distance. The spatial variation of TC appeared to be strongly affected by the inputs of biochar materials from human induced fire as well as the re-distribution of the biochar materials due to the slope, microtopography, and parent materials but warrants further investigations. Available phosphate was the most limited major nutrients when referencing the Japanese fertilizer guidelines, and the spatial distribution appeared to be affected by soil acidity status, especially exchangeable Al. Potential improvements of the production systems could be made by the application of lime materials in locations where TC content was low.
Future studies are anticipated to shed light on the response of crop productivity to pH improvement as well as the use of fertilizers. However, any additional interventions on this traditional cropping system need to consider not only the near-term human needs, but long-term social, economic, and ecological limits.
Acknowledgments
We are very grateful to Prof. Charles Vairappan and Dr. Nobuyuki Tsuji of the Universiti Malaysia Sabah and the staffs of the JICA-SDBEC project. We are also very grateful to two anonymous reviewers who provided us with invaluable suggestions.
Disclosure statement
The authors declare that they have no conflict of interest.
References
- Batjes, N. H. 1996. “Total Carbon and Nitrogen in the Soils of the World.” European Journal of Soil Science 47 (2): 151–163. doi:10.1111/j.1365-2389.1996.tb01386.x.
- Bruun, T. B., A. de Neergaard, D. Lawrence, and A. D. Ziegler. 2009. “Environmental Consequences of the Demise in Swidden Cultivation in Southeast Asia: Carbon Storage and Soil Quality.” Human Ecology 37 (3): 375–388. doi:10.1007/s10745-009-9257-y.
- Bruun, T. B., K. Egay, O. Mertz, and J. Magid. 2013. “Improved Sampling Methods Document Decline in Soil Organic Carbon Stocks and Concentrations of Permanganate Oxidizable Carbon After Transition from Swidden to Oil Palm Cultivation.” Agriculture, Ecosystems & Environment 178: 127–134. doi:10.1016/j.agee.2013.06.018.
- Cambardella, C. A., T. B. Moorman, D. L. Karlen, J. M. Novak, R. F. Turco, and A. E. Konopka. 1994. “Field-Scale Variability of Soil Properties in Central Iowa Soils.” Soil Science Society of America Journal 58 (5): 1501–1511. doi:10.2136/sssaj1994.03615995005800050033x.
- Ceddia, M. B., A. L. O. Villela, É. F. M. Pinheiro, and O. Wendroth. 2015. “Spatial Variability of Soil Carbon Stock in the Urucu River Basin, Central Amazon-Brazil.” The Science of the Total Environment 526: 58–69. doi:10.1016/j.scitotenv.2015.03.121.
- Cherrier, J., S. K. Maharjan, and K. L. Maharjan. 2018. “Shifting Cultivation: Misconception of the Asian Governments.” Journal of International Development and Cooperation 24 (1&2): 71–82. doi:10.15027/45254.
- Committee for Methods of Soil Environment Analysis. 1997. Methods of Soil Environment Analysis. Tokyo: Hakuyusha. In Japanese.
- Department of Agriculture, Hokkaido Government. 2015. Hokkaido Fertilizer Recommendations 2015. In Japanese. SapporoHokkaido Government: Department of Agriculture.
- Fajrini, R. 2022. “Environmental Harm and Decriminalization of Traditional Slash-And-Burn Practices in Indonesia.” International Journal for Crime, Justice & Social Democracy 11 (1): 28–43. doi:10.5204/ijcjsd.2034.
- Fearnside, P. M., P. M. L. A. Graça, and F. J. A. Rodrigues. 2001. “Burning of Amazonian Rainforests: Burning Efficiency and Charcoal Formation in Forest Cleared for Cattle Pasture Near Manaus, Brazil.” Forest Ecology and Management 146 (1–3): 115–128. doi:10.1016/S0378-1127(00)00450-3.
- Garrity, D. P. 1993. “Sustainable Land-Use Systems for Sloping Uplands in Southeast Asia.” In Technologies for Sustainable Agriculture in the Tropics, edited by J. Ragland and R. Lal, 41–66. Madison: American Society of Agronomy.
- Giardina, C. P., R. L. Sanford, I. C. Døckersmith, and V. J. Jaramillo. 2000. “The Effects of Slash Burning on Ecosystem Nutrients During the Land Preparation Phase of Shifting Cultivation.” Plant and Soil 220 (1): 247–260. doi:10.1023/A:1004741125636.
- Hutchison, C. S. 2005. “Rajang Group (Western).” In Chap. 16 in Geology of North-West Borneo -1st Edition. Amsterdam: Elsevier B. V.
- Ippolito, J. A., K. A. Spokas, J. M. Novak, R. D. Lentz, and K. B. Cantrell. 2015. “Biochar Elemental Composition and Factors Influencing Nutrient Retention.” In Biochar for Environmental Management, edited by J. Lehmann and J. Stephen, 139–163. Second ed. Abingdon: Routledge.
- Kinoshita, R., A. Kishimoto, D. Aiuchi, N. Fujitake, M. Osaki, M. Clayton, and M. Tani. 2021. “Properties and Classification of Soils Under Traditional Slash and Burn Cropping Systems in Sabah, Malaysia.” Pedologist 62 (2): 66–75. doi:10.18920/pedologist.65.2_66.
- Kleinman, P. J. A., D. Pimentel, and R. B. Bryant. 1995. “The Ecological Sustainability of Slash-And-Burn Agriculture.” Agriculture, Ecosystems & Environment 52 (2–3): 235–249. doi:10.1016/0167-8809(94)00531-I.
- Kuhlbusch, T. A. J. 1998. “Black Carbon and the Carbon Cycle.” Science 280 (5371): 1903–1904. doi:10.1126/science.280.5371.1903.
- Major, J., J. Lehmann, M. Rondon, and C. Goodale. 2010. “Fate of Soil-Applied Black Carbon: Downward Migration, Leaching and Soil Respiration.” Global Change Biology 16 (4): 1366–1379. doi:10.1111/j.1365-2486.2009.02044.x.
- Myers, N. 1992. The Primary Source: Tropical Forests and Our Future. New York: W.W.Norton.
- Padoch, C. 1982. Migration and Its Alternatives Among the Iban of Sarawak. Leiden: Koninklijk Instituut voor Taal-, Land- en Volkenkunde.
- Paustian, K., J. Lehmann, S. Ogle, D. Reay, G. P. Robertson, and P. Smith. 2016. “Climate-Smart Soils.” Nature 532 (7597): 49–57. doi:10.1038/nature17174.
- Pebesma, E. J. 2004. “Multivariate Geostatistics in S: The Gstat Package.” Computers & Geosciences 30 (7): 683–691. doi:10.1016/j.cageo.2004.03.012.
- Peel, M. C., B. L. Finlayson, and T. A. McMahon. 2007. “Updated World Map of the Köppen-Geiger Climate Classification.” Hydrology and Earth System Sciences 11 (5): 1633–1644. doi:10.5194/hess-11-1633-2007.
- Preston, C. M., and M. W. I. Schmidt. 2006. “Black (Pyrogenic) Carbon: A Synthesis of Current Knowledge and Uncertainties with Special Consideration of Boreal Regions.” Biogeosciences 3 (4): 397–420. doi:10.5194/bg-3-397-2006.
- Raison, R. J., P. K. Khanna, and P. V. Woods. 1985. “Mechanisms of Element Transfer to the Atmosphere During Vegetation Fires.” Canadian Journal of Forest Research 15 (1): 132–140. doi:10.1139/x85-022.
- Rodenburg, J., A. Stein, M. van Noordwijk, and Q. M. Ketterings. 2003. “Spatial Variability of Soil pH and Phosphorus in Relation to Soil Run-Off Following Slash-And-Burn Land Clearing in Sumatra, Indonesia.” Soil and Tillage Research 71 (1): 1–14. doi:10.1016/S0167-1987(02)00141-1.
- Saigusa, M. 1994. “Chemistry of Aluminum in Acidic Soils.” In Low pH Soils and Plants, edited by S. Mori and K. Inoue, 7–42. Tokyo: Hakuyusha. In Japanese.
- Serrasolsas, I., and P. K. Khanna. 1995. “Changes in Heated and Autoclaved Forest Soils of S.E. Australia. I. Carbon and Nitrogen.” Biogeochemistry 29 (1): 3–24. doi:10.1007/BF00002591.
- Soil Survey Staff. 1994. Keys to Soil Taxonomy, 6th Ed. Washington, DC: USDA-Natural Resources Conservation Service.
- Suzuki, K., D. Dublin, N. Tsuji, and M. Osaki. 2015. “Evaluation of SATOYAMA-Human and Nature Coexistence System-In Applying Satoyama Agricultural Development (SADT) and Happiness Survey in Sabah State, Malaysia.” NeBio 6 (3): 1–11.
- Tanaka, S. 2012. “Influence of Burning Practice in Shifting Cultivation Under Different Climates on Nutrient Dynamics.” Population Ecology 55 (2): 403–414. doi:10.1007/s10144-012-0354-1.
- Whitman, T., B. P. Singh, and A. R. Zimmerman. 2015. “Priming Effects in Biochar-Amended Soils: Implications of Biochar-Soil Organic Matter Interactions for Carbon Storage.” In Biochar for Environmental Management, edited by J. Lehmann and J. Stephen, 455–487. Second ed. Abingdon: Routledge.
- Wiedner, K., and B. Glaser. 2015. “Traditional Use of Biochar.” In Biochar for Environmental Management, edited by J. Lehmann and J. Stephen, 15–37. Second ed. Abingdon: Routledge.
- Zhang, W., J. Niu, V. L. Morales, X. Chen, A. G. Hay, J. Lehmann, and T. S. Steenhuis. 2010. “Transport and Retention of Biochar Particles in Porous Media: Effect of PH, Ionic Strength, and Particle Size.” Ecohydrology 3 (4): 497–508. doi:10.1002/eco.160.