
Abstract
Semi-solid pharmaceutical forms, like topical and transdermal products, are widely used for medical purposes since they provide convenient and pain-free treatment for patients. In this study, two transdermal gel formulations with different active pharmaceutical ingredients were analyzed with near-infrared spectrophotometers with three distinct optical arrangements (dispersive, Fourier transform, and diode-array spectrophotometers) for the measurement of active pharmaceutical ingredient concentration. The reference concentrations were measured with high-performance liquid chromatography methods.
The developing of calibration for reference concentrations based on near-infrared spectra was performed using partial least squares regression. The spectra from near-infrared spectrophotometer with diode-array optical arrangement presented the best root mean square error of cross-validation results with 0.045% and 0.144% for the two active pharmaceutical ingredients. The root mean square error of cross-validation using dispersive spectra were 0.125% and 0.193% and using Fourier transform spectra were 0.130% and 0.344% for the active pharmaceutical ingredients. The results of partial least squares regression were confirmed using simulated spectra based on the measured datasets.
Near-infrared spectroscopy can be used successfully for the quantitative measurement of active pharmaceutical ingredient concentration in transdermal gel formulations. The type of optical arrangements of spectrophotometers can influence the performance of calibrations and have to be optimized case by case.
Introduction
Since 1968, when Ben-Gera and Norris[Citation1] published the first work about multicomponent regression analysis of agricultural products by near-infrared (NIR) spectroscopy, the software and hardware technology used for NIR technology have gone through a remarkable evolution. Nowadays, a number of NIR spectrophotometers with different optical arrangements are available, of which three types are especially widespread in scientific researches and easily accessible commercially for industrial applications: the dispersive (DS), the Fourier transform (FT), and the diode-array (DA) types.[Citation2]
Comparing the DS, FT, and DA spectrophotometers, all types have their advantages and weaknesses; therefore, their efficiency can be dissimilar in different applications. DS spectrophotometers, which contain scanning grating monochromator, have preeminent signal-to-noise ratio and the best wavelength range since the scanned region is extended for the visible region. On the contrary, the resolution of DS spectrophotometers is lower than that of the other two types.[Citation2] FT spectrophotometers have the best wavelength axis precision and high spectral resolution, however, their signal-to-noise ratio is lower at short wavelengths than that of DS. Moreover, this is the most vibration-sensitive technology because of the behavior of the interferometer, which can be a huge disadvantage in process analysis.[Citation2] These sort of tasks may demand special kind of FT spectrophotometers with more stable and reproducible interferometer structures.[Citation3] In contrast, fix grating DA spectrophotometers—since they do not have moving parts—are fast and robust instruments while also being tolerant to sample movements. Therefore, these kinds of spectrophotometers can be used for qualitative measurements even on moving plot combine harvesters.[Citation4] On the other hand, their resolution and signal-to-noise ratio can be weaker than that of DS and FT spectrophotometers and DA has the smallest declared wavelength range of the aforementioned three kinds of spectrophotometers.[Citation2]
In the food and agriculture sector, there are publications about the comparison of different types of NIR instruments but most of them only compare DS and FT spectrophotometers.[Citation5–7] Fernández-Ahumada et al.[Citation8] proved that the DA instrument had similar or even greater accuracy in the quality control of feed samples than the DS spectrophotometer while also emphasized that DA instruments could be accurate even in dynamic conditions. Still, only a limited number of researches have been conducted with the aim of testing and comparing DA instruments.
As an example of pharmaceutical investigations, Kazeminy et al.[Citation9] measured four formulations of ibuprofen tablets using three kinds of NIR instruments with different optical arrangements (DS, FT, and polarization interferometer) and they found that despite instrumental and software differences, classification models by all three types of spectrophotometers could accurately predict the identity of ibuprofen dosage forms.
In analyzing semi-solid pharmaceutical forms—like topical and transdermal products—spectrophotometric methods are mostly used for identification[Citation10] in spite of spectroscopy, including NIR or Raman spectroscopy, also can be suitable for quantitative measurements. There are some examples of quantitative analyses of semi-solid pharmaceutical products by NIRS, but with the limitation of using but they used different instrument models, sample cups and sample-light interaction modes (i.e., transmission, transflection, or diffuse reflection). For example, Kemper et al.[Citation11] measured ketoprofen concentration between 1% and 8% in laboratory prepared translucent gel model system using FT-NIR spectroscopy operated in transmission mode. In another study, Blanco and Romero[Citation12,Citation13] investigated dexketoprofen, ketoprofen and preservatives in water/ethanol-based hydrogels in transflection mode using DS spectrophotometer. In spite of the low concentration of measured ingredients (<4%) and the strong O–H bands of NIR spectra, they established partial least squares regression (PLSR) calibrations with acceptable relative errors. By contrast, Baratieri et al.[Citation14] used diffuse reflectance FT-NIR spectroscopy to analyze nystatin and metronidazole in pharmaceutical cream products. The validation tests of PLSR models for both active pharmaceutical ingredients (APIs) showed results within 95–105% of uncertainty. Moreover, Concepcion-Cruz and Ghaly[Citation15] also developed calibrations for ibuprofen formulations containing different ratios of lipid to aqueous phase using FT-NIR in transmittance mode. These calibrations were able to predict not only the API concentration between 0.2% and 0.8% (root mean square error of cross-validation: 0.138 mg) but also the viscosity of formulations (root mean square error of cross-validation: 1.14·103 cP).
The development of mathematical and modeling techniques has also been improving the applicability of NIR. Using quantum chemical calculations, spectra of different molecules in different solvents can be computed and these spectra can be used during the explanation of the experimental results.[Citation16] There are also computational solutions for generating spectra based on experimental data. These kinds of data augmentation can facilitate the optimization of model‐building techniques when the low availability and high costs of samples may limit experimental sample sizes.[Citation17,Citation18] Notwithstanding, it should be taken into account that the models thus constructed only represent the variability of the samples being tested. For later use, it is recommended to increase the number of samples and rebuild calibrations.[Citation18]
In this study, two transdermal gel formulations with different active pharmaceutical ingredient (API A and API B) were measured using three NIR instruments with different optical configurations with the aim of comparing the effectiveness of DS, FT, and DA instruments in the quantitative measurement of transdermal products. Calibration models for reference concentrations based on NIR spectra were performed using PLSR. Mathematical pretreatments of spectra and PLSR models were optimized separately in the case of spectral datasets of DS, FT, and DA spectrophotometers to recognize the pure potential of these three types of instruments in quantitative analysis of API concentration. The results of PLSR were confirmed using simulated spectra based on the measured datasets.
Materials and methods
Samples and reference measurements
Two transdermal gel formulations (made by Egis Pharmaceuticals Plc. Production Site of Körmend, Körmend, Hungary) with different APIs were applied as test samples to compare NIR spectrophotometers with different optical arrangements. The exact composition of these formulations (hereinafter: Formulation A and Formulation B) are confidential and therefore not revealed in order to protect commercial and industrial secrets. Samples of the individual formulation were produced from the same batches of API and additives and were blended separately resulting in an independent sample for each calibration point. These samples were divided into three independent subsamples for NIR measurements. Samples were stored and measured at room temperature (25 ± 1 °C).
In the case of Formulation A, the API A concentrations were between 1.0% and 5.0% (w/w) with 9 calibration steps (Δ: 0.5%) where API A was an organic compound with different heteroatoms (O, N, S, F). Formulation B contained API B between 0.5% and 3.5% (w/w) with 11 calibration steps (Δ: 0.3%) where API B was also an organic compound with O, N and Cl heteroatoms. Due to the fewer number of heteroatoms in it, API B has fewer characteristic vibrations in the NIR region, which can be distinguished from matrix origin vibrations (e.g., C–H, O–H vibrations). According to this spectral attribute and the lower API B concentration, Formulation B expectedly leads to more difficulties during making NIR calibration models than Formulation A.
The reference concentrations of API A in Formulation A and API B in Formulation B were measured with validated liquid chromatographic methods, using Shimadzu Nexera HPLC system (Shimadzu Corp., Kyoto, Japan) connected to a Shimadzu SIL-30AC autosampler (Shimadzu Corp., Kyoto, Japan) and a diode-array spectrophotometric detector operating in the UV region.
The sample of 250 mg from Formulation A was dissolved in 25 mL methanol/water (3/1, v/v) solution at room temperature. The solution was filtered with a 0.22 µm, hydrophilic PTFE syringe filter. Formulation A measurements were performed on BetaBasic Phenyl reversed-phase chromatographic column (5 μm; 250 mm × 4.6 mm) (Thermo Fischer Scientific Inc., Waltham, MA, USA) with an eluent flow rate of 1.5 mL min−1. The autosampler and chromatographic measurements were maintained at 20 °C and 60 °C, respectively. During the chromatographic run (40 °C) phosphate buffer/methanol/acetonitrile 6/3/1 (v/v) eluent was used based on phosphate buffer containing 2.7 g L−1 potassium dihydrogen phosphate (pH = 3.0).
In the case of Formulation B, 300 mg sample was dissolved in 20 mL methanol/water (3/1, v/v) solution at room temperature. Then the solution was filtered with a 0.22 µm, PTFE syringe filter. The chromatographic separation was performed on Kromasil 100 Å C18 reversed-phase chromatographic column (5 μm; 250 mm × 4.6 mm) (Sigma-Aldrich, St. Louis, MO, USA) with an eluent flow rate of 1.0 mL min−1. The autosampler and chromatographic measurements were maintained at 20 °C and 35 °C, respectively. From phosphate buffer containing 0.8 g L−1 potassium dihydrogen phosphate (pH = 2.5) the following eluents were prepared: solvent A (phosphate buffer/methanol 8/2, v/v), solvent B (phosphate buffer/methanol 2/8, v/v). Samples were injected onto HPLC column and eluted with the following gradient elution program: linear gradient from solvent A/solvent B (30/70, v/v) to solvent A/solvent B (0/100, v/v) for 25 min, then isocratic step for 5 min finally the initial conditions were reestablished in 1 min and held for 4 min.
The intra-day precision was assessed by analyzing six samples on the same day. Relative standard deviation (RSD%) of API A measurement and API B measurement were 0.31% and 0.32%, respectively.
NIR spectra acquisitions
For the NIR measurements, samples were divided into three independent subsamples resulting in 27 and 33 subsamples of Formulation A and Formulation B, respectively.
DS spectra were collected using a Foss NIRSystems 6500 spectrophotometer (Foss NIRSystems, Inc., Silver Spring, MD, USA) equipped with a rapid content analyzer (RCA) which contains PbS detector. Samples were placed in a sample holder with a sapphire window with a diameter of 1.2 cm (Perkin Elmer, Inc., Waltham, MA, USA) furnished with a hexagonal aluminum reflector (optical spacing, 0.5 mm; Perkin Elmer, Inc., Waltham, MA, USA) (. 32 scans with a data interval of 2 nm were recorded for each spectrum in the wavelength range of 1100–2498 nm. The measurement time was approximately 2–2.5 min.
Figure 1. The schematic illustrations of the sample holders used in the dispersive (a), Fourier transform (a) and diode-array (b) near-infrared measurements. (a) Sample holder with a sapphire window furnished with a hexagonal aluminum reflector. (b) Open top sample cup for diffuse reflectance measurements. Due to the semitransparency of samples, transflectance may also occur during the spectra acquisition.
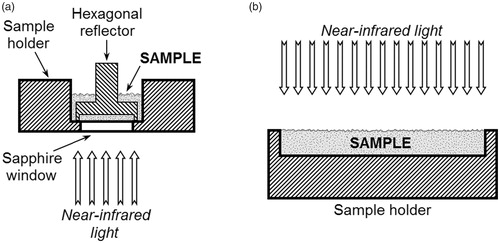
FT spectra were recorded using a Spectrum 400 spectrophotometer (Perkin Elmer, Inc., Waltham, MA, USA) with a near-infrared reflectance accessory (NIRA) which contains InGaAs detector. Samples were placed in a sample holder with a sapphire window with a diameter of 1.2 cm (Perkin Elmer, Inc., Waltham, MA, USA) furnished with a hexagonal aluminum reflector (optical spacing: 0.5 mm; Perkin Elmer, Inc., Waltham, MA, USA) (. 32 scans with resolution of 16 cm−1 and data interval of 2 cm−1 were recorded for each spectrum in the wavenumber range between 10,000 and 4000 cm−1 (i.e., in the wavelength range between 1000 and 2500 nm). The measurement time was approximately 1.5–2 min.
DA absorbance spectra were collected with the data interval of 2 nm between 950 and 1650 nm using a Perten DA 7250 NIR Analyzer (Perten Instruments AB, Hägersten, Sweden) which contains a thermoelectrically cooled 256-element InGaAs detector. Samples were placed in a 3 mm thick layer into an open top sample cup (Perten Instruments AB, Hägersten, Sweden) (. However, these sample cups are used for diffuse reflectance measurements, transflectance may also occur during the spectra acquisition. The measurement time was 6 s. During this time, the device collected approximately 90 spectra.
Data analysis
To remove physical phenomena in the spectra (in this case the undesirable scatter effect, which may be induced by the changing transparency and viscosity of samples) and improve the signal-to-noise ratio, mathematical pretreatments like multiplicative scatter correction (MSC) and standard normal variate (SNV), first and second ordered derivatives with the gap-segment and the Savitzky-Golay methods were applied.[Citation19,Citation20] These kinds of mathematical pretreatments of NIR spectra were evaluated with The Unscrambler X 10.4 (CAMO Software AS., Oslo, Norway). The optimal combinations of normalization and derivative methods were selected by the mean performance indicators of partial least squares regression (PLSR), including root mean square error of calibration and cross-validation (RMSEC and RMSECV, respectively) ().
Table 1. Applied data pretreatments.
PLSR was applied to create equations to describe API concentrations using The Unscrambler X 10.4 (CAMO Software AS., Oslo, Norway). PLSR computes the algorithm on the spectroscopic and reference matrices simultaneously to find the latent variables (LVs) in the spectroscopic matrix that may be able to predict the LVs of reference matrix, or the values of the one dimension reference matrix (i.e., vector). The regression was accomplished on pretreated and mean-centered spectral data using the non-linear iterative partial least-squares algorithm (NIPALS) and full cross-validation (i.e., leave-one-out) method. To evaluate and compare the PLSR models, root mean square error (RMSEC, RMSECV), correlation coefficients (R2cal, R2cv) and residual predictive deviation (RPDcal, RPDcv)[Citation21,Citation22] were calculated for calibration and cross-validation, respectively.[Citation23]
In this study, simulated spectra generated based on the measured datasets (hereinafter referred to as the “original datasets”) were used to confirm the results of PLSR models. For each of the calibration points in the original datasets, the average spectrum and the covariance matrix were calculated, then multivariate normally distributed spectra were simulated by using the rmvnorm function of mvtnorm package[Citation24,Citation25] in R‐project software ver. 3.5.0 (R Foundation for Statistical Computing, Vienna, Austria).[Citation26] For the individual formulations, five groups of simulated datasets (G1–G5 datasets) were generated with the same sample sizes (i.e., each calibration point contained three spectra), which resulted in five independent datasets of Formulation A and Formulation B, each containing 27 and 33 simulated spectra, respectively.
The PLSR models based on original datasets were tested with G1–G5 datasets, separately. G1–G5 datasets were also applied to build PLSR models using the previously optimized data pretreatments (see also ) and regression parameters (i.e., mean-centered data, NIPALS algorithm, full cross-validation). These independent models were also tested with the original spectra, and the results of these predictions (i.e., original PLSR models vs. G1–G5 datasets and G1–G5 PLSR models vs. original spectra) were compared based on root mean square error (RMSEC, RMSECV, RMSEP), correlation coefficients (R2cal, R2cv, R2p) and residual predictive deviation (RPDcal, RPDcv, RPDp) calculated for calibration, cross-validation and prediction, respectively.
Results and discussion
Spectral characterization
Raw NIR spectra (i.e., spectra without any mathematical pretreatment) of Formulation A and B measured with three different instruments are shown in .
Figure 2. Raw near-infrared spectra of dispersive (a), Fourier transform (b) and diode-array (c) spectrophotometers for Formulation A and for Formulation B with different nominal active pharmaceutical ingredient concentrations. Due to the higher numbers of heteroatoms and infra-active functional groups of active pharmaceutical ingredient A, dispersive and Fourier transform spectra of Formulation A (a and b, respectively) show stronger characteristic peaks in the 1675–1825 nm region (first overtones of C–H, C=O, N–H and S–H bonds) than the spectra of Formulation B. Diode-array spectra of the two formulations (c) have remarkable differences in the region between 1150 nm and 1250 nm (second overtones of C–H, aromatic C–H, C=C, C=O and O–H bands).
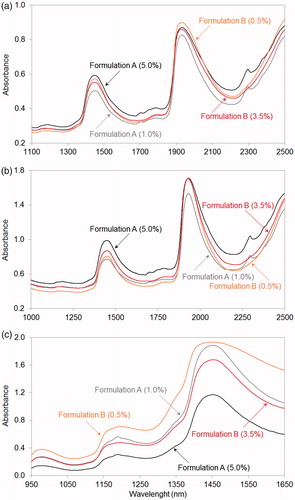
DA spectrophotometer collects spectra between 950 and 1650 nm, which is a smaller but overlapped region according to DS and FT spectra. Thanks to the different configuration, DA spectra show characteristic peaks between 1150 and 1250 nm with a better signal-to-noise ratio than that of DS or FT spectra in these regions. Moreover, due to the application of the diffuse reflective technique, DA spectra show baseline shifts in accordance with API concentration. This effect can be explained by the changing physical attributes of samples, for example, transparency and viscosity.[Citation19]
On all of the spectra, the domination of O–H bands can be observed with maxima around 1450 nm and 1940 nm, and there is an O–H absorption region at around 1190 nm which is significant only in DA spectra.[Citation27] Due to the higher numbers of heteroatoms and infra-active functional groups of API A—which can be distinguished from matrix origin C–H, O–H etc. vibrations—DS and FT spectra of Formulation A show stronger characteristic peaks in the 1675–1825 nm and in the 2150–2400 nm regions (first overtones of C–H, C=O, N–H, S–H bonds and first combinations of C–H, aromatic C–H, C=O, N-H, S–H, C–N, N–H, O–H bands, respectively).[Citation28] DA spectra of the two formulations have important differences in the above-mentioned region between 1150 nm and 1250 nm (second overtones of C–H, aromatic C–H, C=C, C=O and O–H bands).[Citation28]
Overall, Formulation A gives more informative NIR spectra with all instruments than Formulation B, and DA spectra show characteristic peaks in other regions than DS or FT spectra does.
Results of partial least squares regressions
To build predictive models for the quantification of API concentrations, PLSR was performed. Raw absorbance spectra and pretreated spectra (see also ) were investigated in the whole scanned spectral regions of DS, FT and DA instruments. By using the full spectra—not just the overlapping region (i.e., 1100–1650 nm)—the pure potential of individual spectrophotometers has been fully realized in the industrial application of transdermal gel analysis. The correlation coefficient, root mean square error and residual predictive deviation of calibration and cross-validation (R2cal, R2cv, RMSEC, RMSECV and RPDcal, RPDcv, respectively) results can be seen in with the number of applied latent variables (LVs, i.e., factors) of PLSR models.
Table 2. Table of root mean square error, correlation coefficient, residual predictive deviation and the number of latent variables of partial least squares regression models, using raw and mathematically pretreated near-infrared spectra.
In the case of both formulations, DS raw spectra give PLSR models with a high number of LVs at Formula A and B, 9 and 8, respectively. Such a high number of LVs may imply overfitted models.[Citation23,Citation29] After spectral pretreatments, the complexity of Formula A and Formula B models decrease into the acceptable 3 and 4 LVs, respectively. Besides, RMSECV of API A calibration is approximately halved thanks to the pretreatments, while the difference between RMSEC and RMSECV become smaller. RMSECV of API B calibration and the RMSEC–RMSECV difference also decrease. Consequently, normalization of DS spectra significantly improves the calibrations of both APIs and gives models with 0.125% and 0.191% RMSECV results. RPDcal and RPDcv values of API A model based on pretreated spectra greater than 10 means that DS can provide calibration model with excellent performance for this formulation. RPDcal and RPDcv of API B model are between 5 and 8, therefore this model may be used in the quality control of Formulation B but this way results will not be as reliable as in the case of Formulation A.[Citation21,Citation22]
Raw FT spectra give better RMSECV with 6 LVs in the case of API A than of raw DS spectra, but after pretreatments, the two spectral datasets achieve approximately similar RMSEC, RMSECV, and R2 values when using the same number of LVs. In contrast, calibration of API B in Formulation B provides poor results with raw FT spectra, while calibration with MSC normalized FT spectra also provides low R2cv (<0.9) and high RMSECV (0.344%) values. Although RPDcal and RPDcv values of API A calibration are excellent, API B calibration with 3.0 RPDcv means that this model may be used only for the rough screening of Formulation B.[Citation21,Citation22]
DA spectra result in the best R2cal, R2cv, RMSEC, and RMSECV values in the case of both formulations. Calibration with raw DA spectra provide smaller RMSECV (0.171% at API A and 0.185% at API B) values than the best result in the events of pretreated DS and FT spectra, additionally, the numbers of LVs are also low (2 and 4 LVs). Interestingly, using pretreated DA spectra do not change the number of LVs despite normalization and second derivatives eliminate the baseline shifts which have great relevance in the variability of DA spectra. Therefore, apart from physical properties, chemical information is also reflected in the DA spectra.
Pretreatments have a great effect on performance indicators: RMSECV in the case of API A calibration becomes approximately the third of the initial value (0.040%) and RMSECV of API B decreases by more than 20% (0.144%). This tendency is also observable in RPDcal and RPDcv values: RPDcal and RPDcv of API A calibration become more than 30 so Formulation A can be measured with great accuracy using DA. RPDcal and RPDcv of API B are between 7 and 10 which means that this model can also be used for quantification in the case of Formulation B.[Citation21,Citation22]
show the regression coefficients of PLSR models using pretreated spectra. In the case of API A calibration, a significant peak can be observed between 1600 and 1640 nm in DA regression coefficients (), which peak can be identified in DS and FT regression coefficients (, respectively) but with lower relevance. Moreover, peaks in the 1080–1220 nm region of DA regression coefficients are also important, but these peaks are hardly recognizable in DS regression coefficients and cannot be distinguished from the noise in the case of FT regression coefficients. Similar statements can be made according to regression coefficients of API B calibrations: relevant peaks can be observed in 1110–1160 nm and 1360–1430 nm regions of DA regression coefficients (), while these regions of DS and FT regression coefficients (, respectively) have little or no relevance in the models. Such results may be attributed to the different signal-to-noise ratio of the above-mentioned regions, which originate from the different optical arrangements of such spectrophotometers and the distinct characteristics of detectors.
Figure 3. Regression coefficients of partial least squares regression models, using pretreated spectra of dispersive (a), Fourier transform (b) and diode-array (c) spectrophotometers and standard normal variate normalized second‐derivative spectra of active pharmaceutical ingredients in Formulation A (d) measured with diode-array spectrophotometer. The regression coefficient of diode-array spectra based partial least squares model (c) shows high similarity to the standard normal variate normalized second‐derivative diode-array spectra of the active pharmaceutical ingredient (d). Relevant peaks can be observed in the 1080–1220 nm and 1600–1640 nm regions of regression coefficient of diode-array spectra (c), while these regions of dispersive (a) and Fourier transform (b) spectra based models show little or no relevance.
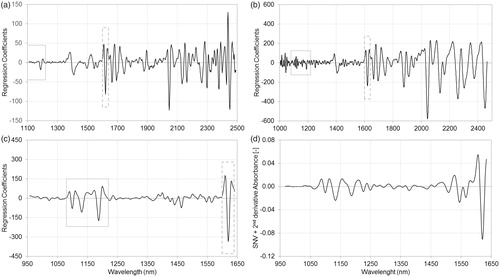
Figure 4. Regression coefficients of partial least squares regression models, using pretreated spectra of dispersive (a), Fourier transform (b) and diode-array (c) spectrophotometers and standard normal variate normalized second‐derivative spectra of active pharmaceutical ingredients in Formulation B (d) measured with diode-array spectrophotometer. The regression coefficient of diode-array spectra based partial least squares model (c) shows high similarity to the standard normal variate normalized second‐derivative diode-array spectra of the active pharmaceutical ingredient (d). Relevant peaks can be observed in the 1110–1160 nm and 1360–1430 nm regions of regression coefficient of diode-array spectra (c), while these regions of dispersive (a) and Fourier transform (b) spectra based models show little or no relevance.
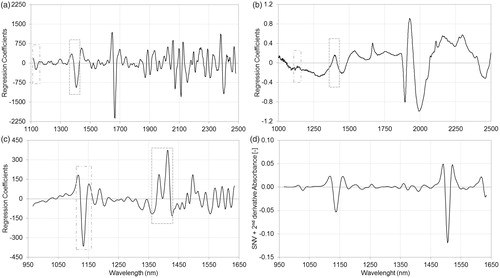
The DA regression coefficient of API A shows high similarity to the SNV normalized second‐derivative spectrum of API A measured with the same DA spectrophotometer (), while SNV normalized second‐derivative spectrum of API B has only a shorter corresponding region below 1300 nm (. The regression coefficients of models show more peaks which may represent the C–H vibration of aromatic groups of APIs: the second overtone of the C–H stretch at 1132 nm can be observed on DA regression coefficients of API A and API B, and API B also has characteristic aromatic bands at 1386 nm and 1414 nm. The absorption of aromatic groups also appear at 1666 nm and 2402 nm on the DS regression coefficient of API B. Conversely, API A has intensive peaks at 1620 nm on each regression coefficient and at 2045 nm in the case of DS and FT models. These peaks may represent the sterically free, special functional groups of API A with one or more heteroatoms.[Citation28]
Simulated spectra based on the measured datasets were used to confirm the results of PLSR models based on original datasets.[Citation17,Citation18] The five independent G1–G5 datasets were also applied to build PLSR models and these independent models were tested with the original spectra. Mean plots of RMSE and RPD of PLSR models with confidence intervals (±0.95) are shown in . There are no significant differences between the RMSEP and RPDp results on original and simulated datasets (Student’s t-test, p = 0.05) in the case of DS and DA spectra. API A models of DA have the best RMSEP and RPDp values at around 0.05% and 30, while API B models of both DS and DA resulted in RPDp of around 0.13% and 8, respectively. Results of FT models have higher variance, which may be explained by the higher variability of FT spectra. API B calibrations based on simulated FT datasets resulted in models with the highest complexity between 4 and 9 LVs, while API A models have only 3 or 4 LVs. In the case of API B calibrations, DS and DA models also have higher number of LVs than that of the original models (5–6 LVs and 4–5 LVs, respectively), while all the API A calibrations based on DS and DA datasets resulted in robust models with 3 and 2 LVs, respectively.
Figure 5. Mean plots with confidence intervals (±0.95) of root mean square error (a), and residual predictive deviation (b) of partial least squares regression models, using original and simulated near-infrared spectra after pretreatments. In the case of both formulations, diode-array spectra gave the best root mean square error (a) and residual predictive deviation (b) results. Calibrations with dispersive and Fourier transform spectra achieved similar results at the analysis of Formulation A, but in the case of Formulation B, Fourier transform spectra could not provide as good calibration as dispersive spectra. See text for more details.
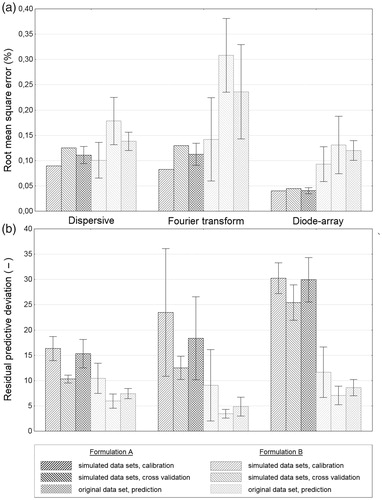
In summary, DA spectra gave the best RMSECV results with 0.045% (1.3% relative error) and 0.144% (7.2% relative error) in the case of API A and API B, respectively. The best RMSECV results using DS spectra were 0.125% (4.2% relative error) and 0.193% (9.7% relative error); and at using FT spectra were 0.130% (4.3% relative error) and 0.344% (17.2% relative error) for API A and API B, respectively. Therefore, calibrations with DS and FT spectra achieved similar results at the analysis of Formulation A, but in the case of Formulation B, FT spectra could not provide as good calibration as that of DS. According to the regulations of the European pharmaceutical authority, the maximum acceptable deviation in the active substance content of the finished products shall not exceed ±5% at the time of manufacture.[Citation30] The regulations of the United States Pharmacopeia (USP) also state that variation in a quality attribute cannot exceed ±10% from the target label claim.[Citation10] DA calibrations of both formulations correspond to the USP requirement, and Formulation A also conforms the European requisite.
Conclusion
Two transdermal gel formulations with different APIs were measured in this study, using three types of near-infrared spectrophotometers (DS, FT, and DA) while the reference concentrations of APIs were measured with HPLC methods. Optimization of mathematical pretreatments of NIR spectra and development of PLSR models were performed separately on the spectral datasets of DS, FT, and DA spectrophotometers to realize the full potential of the individual instruments in the industrial application of transdermal gel analysis.
The spectra from the DA spectrophotometer presented the best RMSECV results with 0.045% and 0.144% for the two active pharmaceutical ingredients. The RMSECV using DS spectra were 0.125% and 0.193%; and when using FT spectra were 0.130% and 0.344% for the active pharmaceutical ingredients. The results of partial least squares regression were confirmed using simulated spectra based on the measured datasets. Thanks to the post-dispersive configuration, FT and DA spectrophotometers operate with more intensive incoming light than DS, while the reference materials and detector characteristics of the spectrophotometers are also different. Due to the above factors and additional optical differences which influence the sensitivities of the tested instruments, the results of PLSR models may vary.
Although DA spectrophotometers are primarily used in food and agricultural applications, they could also be applied effectively in the pharmaceutical industry. Since these kinds of fix grating instruments do not have moving parts they are fast, robust and tolerant to sample movement.[Citation2,Citation4,Citation8] Consequently, DA spectrophotometers can be applied in a vibrating environment (e.g., next to the manufacturing units) and may be directly inserted into the transdermal gel production process as potential on-line/in-line tools.
To conclude, NIR spectroscopy is suitable for quantitative measurements of transdermal products and the type of optical arrangements of spectrophotometers can influence the performance of calibrations and have to be tested case by case. The initial decisions about the applied methods and instruments can determine the success of the whole development process, not just due to the molecular characteristics and spectral effects of chemical components (overlapping and interactions of absorption bands), but due to the physical properties of formulations (e.g., transparency, opacity, viscosity).[Citation19] If all of these aspects are taken into account in NIR method development, the technique can be reliably used in pharmaceutical applications as a fast, high throughput and nondestructive technique.
Additional information
Funding
References
- Ben-Gera, I.; Norris, K. H. Direct Spectrophotometric Determination of Fat and Moisture in Meat Products. Journal of Food Science 1968, 33, 64–67. DOI: 10.1111/j.1365-2621.1968.tb00885.x.
- Andersen, H. V.; Wedelsbäck, H.; Hansen, P. W. NIR Spectrometer Technology Comparison. A White Paper from Foss; P/N 1026672 2013.
- Watari, M. Applications of near-Infrared Spectroscopy to Process Analysis Using Fourier Transform Spectrometer. Optical Review 2010, 17, 317–322. DOI: 10.1007/s10043-010-0057-9.
- Montes, J. M.; Utz, H. F.; Schipprack, W.; Kusterer, B.; Muminovic, J.; Paul, C.; Melchinger, A. E. Near‐Infrared Spectroscopy on Combine Harvesters to Measure Maize Grain Dry Matter Content and Quality Parameters. Plant Breed 2006, 125, 591–595. DOI: 10.1111/j.1439-0523.2006.01298.x.
- Peirs, A.; Scheerlinck, N.; Touchant, K.; Nicolaı¨, B. M. PH – Postharvest Technology: Comparison of Fourier Transform and Dispersive near-Infrared Reflectance Spectroscopy for Apple Quality Measurements. Biosystems Engineering 2002, 81, 305–311. DOI: 10.1006/bioe.2001.0040.
- Armstrong, P. R.; Maghirang, E. B.; Xie, F.; Dowell, F. E. Comparison of Dispersive and Fourier-Transform NIR Instruments for Measuring Grain and Flour Attributes. Applied Engineering in Agriculture 2006, 22, 453–457. DOI: 10.13031/2013.20448.
- Schmidt, J.; Gergely, S.; Schönlechner, R.; Grausgruber, H.; Tömösközi, S.; Salgó, A.; Berghofer, E. Comparison of Different Types of NIR Instruments in Ability to Measure β-Glucan Content in Naked Barley. Cereal Chemistry 2009, 86, 398–404. DOI: 10.1094/CCHEM-86-4-0398.
- Fernández-Ahumada, E.; Garrido-Varo, A.; Guerrero-Ginel, J. E. Feasibility of Diode-Array Instruments to Carry near-Infrared Spectroscopy from Laboratory to Feed Process Control. Journal of Agricultural and Food Chemistry 2008, 56, 3185–3192. DOI: 10.1021/jf073534t.
- Kazeminy, A.; Hashemi, S.; Williams, R. L.; Ritchie, G. E.; Rubinovitz, R.; Sen, S. A Comparison of near Infrared Method Development Approaches Using a Drug Product on Different Spectrophotometers and Chemometric Software Algorithms. Journal of Near Infrared Spectroscopy 2009, 17, 233–244. DOI: 10.1255/jnirs.854.
- Ueda, C. T.; Shah, V. P.; Derdzinski, K.; Ewing, G.; Flynn, G.; Maibach, H. I.; Marques, M. R. C.; Rytting, H.; Shaw, S.; Thakker, K. D. Topical and Transdermal Drug Products. Pharmacopeial Forum 2009, 35, 750–764. DOI: 10.14227/DT170410P12.
- Kemper, M. S.; Magnuson, E. J.; Lowry, S. R.; McCarthy, W. J.; Aksornkoae, N.; Watts, D. C.; Johnson, J. R.; Shukla, A. J. Use of FT-NIR Transmission Spectroscopy for the Quantitive Analysis of an Active Ingredient in a Translucent Pharmaceutical Topical Gel Formulation. AAPS PharmSciTech 2001, 3, E23. DOI: 10.1208/ps030323.
- Blanco, M.; Romero, M. A. Near Infrared Transflectance Spectroscopy Determination of Dexketoprofen in a Hydrogel. Journal of Pharmaceutical and Biomedical Analysis 2002, 30, 467–472. DOI: 10.1016/S0731-7085(02)00093-6.
- Blanco, M.; Alcalá, M.; Bautista, M. Pharmaceutical Gel Analysis by NIR Spectroscopy. Determination of the Active Principle and Low Concentration of Preservatives. European Journal of Pharmaceutical Sciences 2008, 33, 409–414. DOI: 10.1016/j.ejps.2008.01.011.
- Baratieri, S. C.; Barbosa, J. M.; Freitas, M. P.; Martins, J. A. Multivariate Analysis of Nystatin and metronidazole in a Semi-Solid Matrix by Means of Diffuse Reflectance NIR Spectroscopy and PLS Regression. Journal of Pharmaceutical and Biomedical Analysis 2006, 40, 51–55. DOI: 10.1016/j.jpba.2005.05.025.
- Concepcion-Cruz, S.; Ghaly, E. S. Development of NIR Method for Determination of Rheological Behavior and Drug Content of Semisolid Containing Different Ratios of Lipid to Aqueous Phase. International Journal of Pharmacy and Pharmaceutical Sciences 2013, 5, 961–965.
- Huck, C. W.; Beć, K. B.; Grabska, J.; Ozaki, Y. Quantum Chemical Calculation of NIR Spectra of Practical Materials. NIR News 2017, 28, 13–11. DOI: 10.1177/0960336017695746.
- Georgouli, K.; Osorio, M. T.; Del Rincon, J. M.; Koidis, A. Data Augmentation in Food Science: Synthesising Spectroscopic Data of Vegetable Oils for Performance Enhancement. Journal of Chemometrics 2018, 32, e3004. DOI: 10.1002/cem.3004.
- Szabó, É.; Gergely, S.; Salgó, A. Linear Discriminant Analysis, Partial Least Squares Discriminant Analysis, and Soft Independent Modeling of Class Analogy of Experimental and Simulated near‐Infrared Spectra of a Cultivation Medium for Mammalian Cells. Journal of Chemometrics 2018, 32, e3005. DOI: 10.1002/cem.3005.
- Dahm, D. J.; Dahm, K. D. The physics of near-infrared scattering. In Near-Infrared Technology in the Agriculture and Food Industries, 2nd ed.; Williams, P., Norris, K., Eds.; American Association of Cereal Chemists: St. Paul, MN, 2001; pp 1–17.
- Rinnan, Å.; van den Berg, F.; Engelsen, S. B. Review of the Most Common Pre-Processing Techniques for near-Infrared Spectra. TrAC 2009, 28, 1201–1222. DOI: 10.1016/j.trac.2009.07.007.
- Williams, P. C. Implementation of near-infrared technology. In Near-Infrared Technology in the Agriculture and Food Industries, 2nd ed.; Williams, P., Norris, K., Eds.; American Association of Cereal Chemists: St. Paul, MN, 2001; pp 145–169.
- Fearn, T. Assessing Calibrations: SEP, RPD, RER and R2. NIR News 2002, 13, 12–13. DOI: 10.1255/nirn.689.
- Geladi, P.; Kowalski, B. R. Partial Least-Squares Regression: A Tutorial. Analytica Chimica Acta 1986, 185, 1–17. DOI: 10.1016/0003-2670(86)80028-9.
- Genz, A.; Bretz, F.; Miwa, T.; Mi, X.; Leisch, F.; Scheipl, F.; Bornkamp, B.; Maechler, M.; Hothorn, T. Mvtnorm: multivariate Normal and t Distributions. R Package Version 1.0-8. http://CRAN.R-project.org/package=mvtnorm (accessed Apr 24, 2018).
- Genz, A.; Bretz, F. Computation of Multivariate Normal and t Probabilities. Lecture Notes in Statistics. Vol. 195. Springer-Verlag: Heidelberg, Germany, 2009.
- R Development Core Team. R: A Language and Environment for Statistical Computing. R Foundation for Statistical Computing. https://www.r-project.org/ (accessed Apr 24, 2018).
- Curcio, J. A.; Petty, C. C. The Near Infrared Absorption Spectrum of Liquid Water. Journal of the Optical Society of America A 1951, 41, 302–304. DOI: 10.1364/JOSA.41.000302.
- Workman, J. Jr.; Weyer, L. Practical Guide and Spectral Atlas for Interpretive near-Infrared Spectroscopy, 2nd ed.; CRC Press: Baton Rouge, LA, 2012.
- Zhao, N.; Wu, Z.; Zhang, Q.; Shi, X. Y.; Ma, Q.; Qiao, Y. J. Optimization of Parameter Selection for Partial Least Squares Model Development. Scientific Reports 2015, 5, 11647. DOI: 10.1038/srep11647.
- Directive 2001/83/EC of the European Parliament and of the Council of 6 November 2001 on the Community code relating to medicinal products for human use. OJ L 311, November 28, 2001,