
 ?Mathematical formulae have been encoded as MathML and are displayed in this HTML version using MathJax in order to improve their display. Uncheck the box to turn MathJax off. This feature requires Javascript. Click on a formula to zoom.
ABSTRACT
Aims
To determine the pharmacokinetics in dairy heifers after oral and IV administration of bromoform, a potential antimethanogenic agent found in red seaweed, Asparagopsis spp.
Methods
Twenty-four dairy heifers with a mean weight of 319 (SD 36.9) kg were used. The study was conducted in two phases, and each cohort of 12 heifers received an escalating dose of bromoform. In the first phase, 12 heifers successively received doses of 200, 400, 800, and 1600 mg of bromoform orally, separated by a 72-hour washout period. In the second phase, a different cohort of 12 dairy heifers was used. Each heifer received a total of four doses of bromoform separated by a wash-out period of 72 hours. Sequentially the treatments were (for each of the 12 heifers) an oral dose of 50 mg, followed by an IV dose of 50 mg, followed by an oral dose of 100 mg and finally an IV dose of 100 mg.
Blood samples were assayed by gas chromatography-mass spectrophotometry for bromoform and dibromomethane to estimate the pharmacokinetic parameters using a non-compartmental analysis.
Results
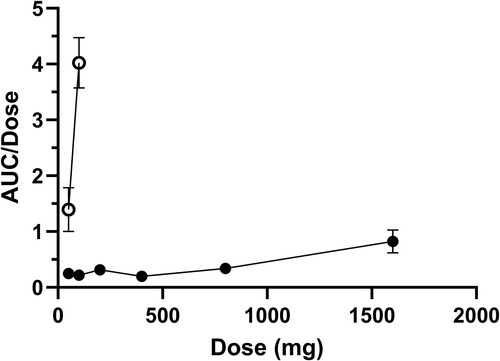
Bromoform was rapidly absorbed as indicated by a short time to the maximum observed concentration of 15 minutes. For the routes of administration and dose ranges investigated, the mean terminal half-life ranged from 0.32 (SE 0.03) hours to 5.73 (SE 1.64) hours when administered orally or IV. With values for the mean area under the curve (AUC) to dose ratio ranging from 0.25 (SE 0.04) to 0.82 (SE 0.19) for oral and 1.39 (SE 0.39) to 4.02 (SE 0.37) for IV administration, bromoform appeared to exhibit non-proportional pharmacokinetic behaviour. The mean absolute bioavailability was 39.13 (SE 10.4)% and 3.36 (SE 0.83)% for 50-mg and 100-mg doses, respectively.
Conclusions and clinical relevance
Bromoform is rapidly absorbed and exhibits dose dependent elimination kinetics.
Introduction
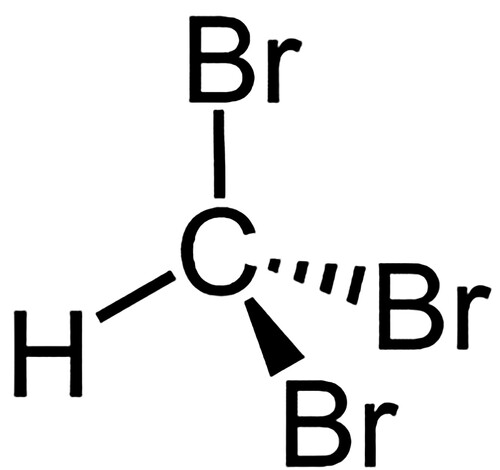
With the rising awareness of the contribution to global methane emissions that can be attributed to livestock, various mitigation strategies are being explored, such as feed additives (Feng and Kebreab Citation2020; Lassen and Difford Citation2020), vaccines (Baca-González et al. Citation2020) and probiotics (Abdelbagi et al. Citation2021). There has been growing interest in the inclusion of halomethane-containing seaweeds such as Asparagopsis taxiformis (Kinley et al. Citation2016a) and A. aramata (Roque et al. Citation2019; Abbott et al. Citation2020) in the diets of ruminants because of the ability of these additives to reduce methanogenesis by ruminal microorganisms (Kinley et al. Citation2016; Li et al. Citation2018). Of a wide range of bioactive compounds in Asparagopsis spp., bromoform is the most abundant (Burreson et al. Citation1976; McConnell and Fenical Citation1977), and is believed to be the primary active ingredient providing anti-methanogenic activity. Bromoform (CAS number 75-25-2), also known as tribromomethane or methyl tribromide, belongs to a group of chemicals called halomethanes. Bromoform is a non-flammable colourless liquid at room temperature and adopts a tetrahedral molecular geometry (). The mechanism behind its anti-methanogenic activity is not entirely clear; however, it is hypothesised that halomethanes inhibit methane production by reacting with reduced vitamin B12 and inhibiting the cobamide-dependent methyltransferase step of methanogenesis, an essential enzymatic reaction required by methanogenic archaea to produce methane (Wood et al. Citation1968).
Figure 1. Chemical structure of bromoform.
Commercial applications of bromoform and bromoform-containing seaweeds have lately gained significant momentum and are now available in Australia (Meat and Livestock Australia Citation2022). As jurisdictions develop regulations for the use and application of halomethane in ruminants, there is a need for a clear rationale for establishing a dosage regimen and minimum effective inclusion level. Identifying pharmacokinetic (PK) parameters is a key step in selecting the rational dose and dosage regimen (Bjornsson Citation1997; Toutain and Lees Citation2004) and in defining the minimum effective inclusion levels. A PK study forms an integral part of the product development process as it generates data on the absorption, distribution, metabolism, and excretion of the active ingredient. Of particular importance are the blood concentration profiles, together with the identification and quantification of major metabolites, because this information is required to predict tissue concentration, and therefore establish residue levels and withholding periods. Bioavailability information is also crucial, even for bioactive compounds such as bromoform that are intended to act locally in the rumen, as this helps to predict the likelihood of systemic exposure and possible residue levels.
To the best of our knowledge, no PK studies on bromoform in ruminants have been published. There are reports of the PK and toxicology of bromoform in rodents (Chu and Marino Citation1980). However, the data from monogastric species cannot be directly translated to ruminants (Toutain et al. Citation2010). Therefore, the aim of this study was to evaluate the PK properties, including the elimination constant, elimination half-life, and clearance rate, and the bioavailability of bromoform in dairy heifers.
Materials and methods
Bromoform (96%) was purchased from ThermoFisher Scientific (Waltham, MA, USA). Propylene glycol was purchased from Pure Nature (Auckland, NZ). All the reagents used were of analytical grade.
Heifers and experimental design
The trial was conducted in two phases; in the first bromoform was administered orally and in the second a combination of oral and IV treatments were administered. Twenty-four non-pregnant heifers were selected for the trial. Approvals were obtained from the AgResearch animal ethics committee (AE15489 and AE0512) and from the Agricultural Chemicals and Veterinary Medicines division of the Ministry for Primary Industries (A011822-06) prior to the study commencing. The study was performed in accordance with all relevant legislative and regulatory requirements.
In the first phase, 12 healthy Holstein-Friesian heifers weighing 290–380 kg were assigned to receive escalating doses of bromoform (200, 400, 800, and 1600 mg) in propylene glycol as an oral drench. Briefly, 4, 8, 16, or 32 g of bromoform were weighed individually into a volumetric flask and propylene glycol added to make up the volume to 1 L. Heifers were drenched with 50 mL of the solution which contained 200, 400, 800, and 1600 mg of bromoform, respectively. The wash-out period between each of the four escalating doses was 72 hours.
In the second phase, a different cohort of 12 healthy Holstein Friesian heifers, weighing 299–334 kg, was used. Each heifer received a total of four doses of bromoform (prepared as described above) separated by a wash-out period of 72 hours. Sequentially and for each of the 12 heifers, the treatments were an oral dose of 50 mg, followed by an IV dose of 50 mg, followed by an oral dose of 100 mg and finally an IV dose of 100 mg. The IV treatments were administered as a bolus infusion via a Luer Lock syringe and an IV catheter placed in the contralateral jugular vein to the IV sampling catheter.
In both phases, approximately 10 mL of venous blood was collected from the sampling catheter with a 16-gauge, 1.5-inch needle into an EDTA vacutainer (Becton Dickinson, Franklin Lakes, NJ, USA) at 0.5 hours before treatment and 0.25, 0.5, 1, 2, 4, 8 and 24 hours after treatment. Samples were immediately frozen at −15°C and transported to an independent external laboratory (Analytica Laboratories, Hamilton, NZ) for quantification using gas chromatography-mass spectrophotometry (GC-MS) of bromoform and dibromomethane, a potential metabolite for bromoform formed in the rumen.
Analytical method
Analysis of blood samples for bromoform and dibromomethane was developed and validated by an independent commercial laboratory (Analytica Laboratories) accredited by International Accreditation New Zealand (Auckland, NZ) and ISO 17025 (Geneva, Switzerland). The concentrations of bromoform and dibromomethane in whole blood were determined by headspace GC-MS, using a Shimadzu GCMS-QP2020NX (Shimadzu Corporation, Kyoto, Japan) with an HS-20 autosampler. A volume of 10 mL of a saturated sodium chloride solution, 50 µL of internal standard solution (toluene-d8), and 500 µL of sample were added to 20 mL headspace vials prior to analysis. Separation of headspace gases was carried out using an Rtx-VMS column (30 m, 0.18 mm ID, 1.40 µm) over 5 minutes with a helium carrier gas flow rate of 2 mL/minute. Selected Ion Monitoring Mode acquisition was used to record ions with mass-to-charge ratio (m/z) of 98, 100 (toluene-d8), 172, 174 (dibromomethane) and 252, 254 (bromoform). A bromoform calibration curve was used to give quantitative data with a limit of quantification (LOQ) of 1 ng/mL. Semi-quantitative dibromomethane data was obtained using a single point calibration. The method was validated for the identity, selectivity, specificity, and interferences. Identity was confirmed by the match of retention time and mass-to-charge ratio for two selected ions versus reference standards. No significant interferences were observed for the ions chosen. Accuracy was assessed by the determination of recovery from fortified samples. The mean accuracy at the LOQ was 108%, and at the 10-times LOQ, it was 97%.
Non-compartmental pharmacokinetic analysis
Data generated from the analytical procedures from phase 1 and 2 for each heifer were entered in MS Excel (Microsoft Office, Redmond, WA, USA) spreadsheets. A non-compartmental analysis was performed in Excel using the bromoform blood concentration data for the 50, 100, 200, 400, 800, and 1600 mg oral doses, and 50 and 100 mg IV doses. The maximum observed concentration (Cmax), the time of Cmax (Tmax) and blood concentration at 24 hours were determined directly from the bromoform blood concentration data. The area under the curve from 0 to 24 hours (AUC0–24) and from 0 to infinity (AUC0–∞) and the area under the first moment curve (AUMC) were calculated from the data for each animal using the linear trapezoidal method. For IV doses, the concentration at time zero was determined by extrapolating the first two time points to time zero and the AUC0–24 and AUC0–∞ calculated. The mean residence time (MRT) was calculated as MRT = AUMC/AUC. The terminal slope (Kel) was determined from the linear portion of the natural log concentration versus time graph for each animal. Starting with the last (i.e. 24-hour) data point and moving backwards toward time zero, at least three data points, and as many as practical, were fitted by linear regression. The number of data points used was determined by maximising the value for r2. From the available AUC and Kel, other PK parameters such as elimination half-life (t1/2), volume of distribution (Vd) and clearance (Cl) were also calculated as follows:
Area under the curve (0 to ):
Where AUClast is the AUC from the time of dosing extrapolated to infinity, based on the last observed concentration (Conclast) and Kel is the terminal slope.
Volume of distribution:
Clearance:
Absolute bioavailability:
Statistical analysis
The estimates of the PK parameters were determined individually for each heifer and means (SE) were established for each group and compared between doses and routes of administration using GraphPad Prism (version 10.1.0 for Windows; GraphPad Software, Boston, MA, USA). The log10 of bromoform concentration was plotted against time and other PK parameters calculated, including AUC0–24/dose and Cmax/dose ratios. The PK parameters for oral treatment groups were compared using a one-way ANOVA model (Brown–Forsythe ANOVA test). PK parameters for oral vs. IV treatments for 50-mg and 100-mg doses were assessed using a mixed effects model and Šídák's multiple comparisons test to determine an effect of administration route for each dose. Coefficient values with p < 0.05 were considered significant.
Results
For the heifers treated orally, all doses of bromoform were well tolerated and the heifers displayed no sign of any adverse events or behavioural changes, including changes in appetite, water intake, or physical examination parameters during the study period. Subsequent to the 800-mg oral treatment, catheters dislodged from two heifers, so they did not receive the 1600-mg dose. With IV treatments, moderate to severe haematuria was noted with both the doses. Four heifers treated with 50 mg of bromoform IV exhibited haematuria. In all cases the urine characteristics returned to normal within 24 hours. The remaining heifers treated with 100 mg bromoform IV, all exhibited haematuria which resolved within 24 hours. Serum biochemistry showed no signs of renal damage.
Pharmacokinetic parameters, calculated from the blood concentration–time data for bromoform in heifers, are shown in . Overall, there were significant differences in the PK parameters between the escalating treatment doses and administration routes. Cmax, AUC, and t1/2 increased with the escalating doses (global p-value = < 0.001 for Cmax and AUC0–24 and 0.069 for t1/2 respectively) (). Meanwhile, Kel decreased considerably with the doses investigated, with mean ranging from 2.4 (SE 0.2) hour−1 to –0.4 (SE 0.10) hour−1 for 50–1600 mg of escalating oral doses respectively (global p-value = < 0.001) (). No clear trend with escalating doses was observed for Cl and Vd, although values were significantly different between the treatment groups (global p-value = 0.009 and < 0.001 for Cl and Vd respectively) ().
Table 1. Mean (± SE) pharmacokinetic parameters following oral (n = 12) or IV (n = 12) administrationTable Footnotea of escalating doses of bromoform to healthy heifers.
The mean blood bromoform concentration-time profiles after oral and IV administration of escalating doses of bromoform in heifers are presented in and . The AUC0–24 and Cmax values following oral and IV administration of escalating doses of bromoform are presented in . shows AUC0–24/dose ratios for oral and IV treatments against the escalating doses. Both and indicate non-proportional PK behaviour particularly for high dose oral treatment and IV treatment groups. The AUC0–24/dose ratio for the 1600-mg oral treatment was more than two-fold for 800-mg oral treatment (). The non-proportional dose behaviour was more evident for the IV treatments with AUC0–24/dose ratios of 1.39 (SE 0.39) and 4.02 (SE 0.37) for 50-mg and 100-mg doses, respectively (, ).
Figure 2. Mean (± SE) concentration of bromoform in blood of 12 dairy heifers following oral administration of 50 mg (filled circle), 100 mg (square), 200 mg (triangle), 400 mg (inverted triangle), 800 mg (diamond) or 1600 mg (unfilled circle) doses of bromoform. Note semi-log scale.
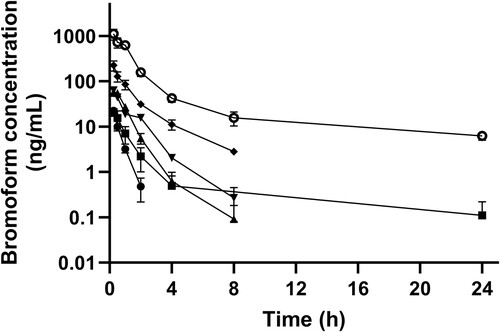
Figure 3. Mean (± SE) concentration of bromoform in blood of dairy heifers following oral (n = 12; unfilled data points) and IV (n = 12; filled data points) administration of 50 (circles) or 100 (squares) mg of bromoform. Note semi-log scale.
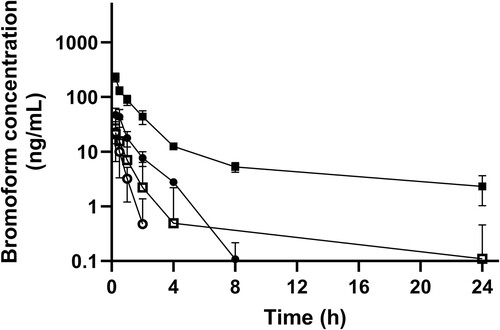
Figure 4. Mean (± SE) maximum blood concentrations (Cmax; left axis, circles) of bromoform, and area under the curve (AUC0–24; right axis, squares) following oral (n = 12; filled data points) or IV (n = 12; unfilled data points) administration of bromoform to dairy heifers.
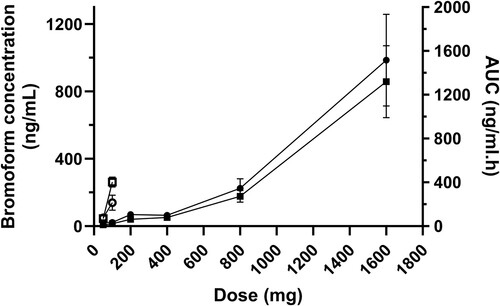
Figure 5. Mean (± SE) AUC0–24/dose vs. bromoform dose for oral (n = 12; filled data points) and IV (n = 12; unfilled data points) administration of bromoform to dairy heifers.
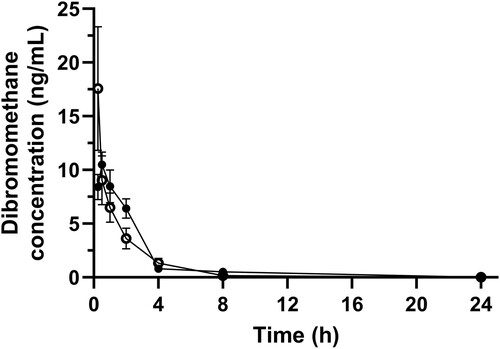
The absolute bioavailability was 39.13 (SE 10.4)% and 3.36 (SE 0.83)% for 50-mg and 100-mg doses respectively. The mean dibromomethane concentration after oral and IV administration in heifers is presented in . The blood levels of dibromomethane for oral and IV groups were similar even though the IV group had ten times higher levels of bromoform than the oral group ( and ).
Figure 6. Mean (± SE) blood concentration in dairy heifers of dibromomethane following administration of 100 mg of bromoform via oral (n = 12; filled data points) and IV (n = 12; unfilled data points) routes.
Discussion
This study is the first to investigate the pharmacokinetics of bromoform, a primary constituent of Asparagopsis spp., in ruminants. Bromoform was absorbed rapidly, as indicated by a short Tmax for all treatment doses, and was thereafter followed by rapid elimination, as displayed by a short t1/2, though it exhibited dose-dependent elimination kinetics. Interestingly, a biphasic systemic profile was observed for higher doses. Bromoform appears to exhibit a non-proportional PK behaviour as displayed by non-proportional values for Cmax, AUC and AUC/dose against the escalating doses. The absolute bioavailability, despite being highly varied, was low for a lipophilic molecule.
The cause of haematuria following IV administration of bromoform remains unknown. One possibility is that this may have been caused by the propylene glycol vehicle (Potter Citation1958; Nielsen and Ingvartsen Citation2004). Potter's (Citation1958) research on sheep reported haemoglobinuria following an IV injection of 39 mL of propylene glycol at a concentration of 20% (w/v); however, in the current study, 50 mL of propylene glycol was administered. The purpose of using hydrophilic propylene glycol as a vehicle was to both solubilise lipophilic bromoform and release free bromoform readily into the ruminal fluid or blood following administration. A previous study on dogs reported no difference in absorption behaviour when propylene glycol was used as a vehicle compared to water (Schulze et al. Citation2005), therefore it can be expected that the propylene glycol would have a similar effect of little or no influence on bromoform absorption. The rapid absorption of bromoform can be attributed to its lipophilic nature and is in agreement with the work by Parra et al. (Citation1986), who reported a peak concentration of bromoform in blood within 15 minutes of oral administration in rats.
A short t1/2, particularly observed at low oral doses (50–400 mg), indicates rapid elimination of bromoform. This short t1/2 contrasts with a relatively longer t1/2 when the dose was ≥ 400 mg. This indicates a threshold for metabolism/elimination and/or absorption capacity beyond 400 mg of a single dose following oral administration. For the 100 mg dose, the t1/2 value was almost ten times longer for the IV treatment compared to the oral treatment. This further indicates an even lower elimination capacity threshold for bromoform administered via the IV route compared to the oral route. Overall, rapid absorption behaviour followed by dose-dependent elimination kinetics for bromoform will be of clinical significance from a product development perspective, as this behaviour will help determine the dose standardisation and formulation strategies for bromoform-containing anti-methanogenic products. The biphasic blood concentration–time profile, particularly evident at high doses ( and ), suggests a distribution phase followed by a long elimination phase. This aspect has not been reported previously in the literature; however, these findings support the observation from the study of bromoform in rats by Parra et al. (Citation1986), where distribution of bromoform in peripheral tissues was more evident at doses ≥ 8 mg/kg, compared to lower doses. The high value obtained for Vd and Cl in the current study also supports this phenomenon. With a pKa of 13.4, lipophilic bromoform tends to distribute widely in body fluids and tissues. It has been reported previously (Batterman et al. Citation2002) that trihalomethanes tend to partition into and accumulate in fatty tissues compared to aqueous compartments.
It is difficult to predict the factors behind the non-linear pharmacokinetics, as bromoform is a volatile molecule (Burreson et al. Citation1976), and this is complicated by the complex environment within the rumen. A possible explanation could be ruminal and extra-ruminal saturation of substrates, where the substrate could be rumen solids, the microbiome and enzymes responsible for bromoform metabolism. At higher oral doses, it is likely the microbiome and/or substrates are saturated, resulting in a non-proportional increase in the blood concentration of bromoform. Alternatively, the non-proportional behaviour may also be due to saturation of enzymes responsible for metabolism. Studies in rodents on the hepatic metabolism of chloroform, a haloform similar to bromoform, have also reported a non-proportional PK response to dose (Corley et al. Citation1990).
The absolute bioavailability of bromoform was highly variable in this study but overall lower than might have been anticipated for a lipophilic molecule. The rumen is a complex environment and the microbiome, particularly methanogens, are believed to degrade bromoform via a reductive dehalogenation pathway (Glasson et al. Citation2022). This is further complicated by poor aqueous solubility and the volatile nature of bromoform. Because bromoform is volatile, it is likely that it is eliminated through exhalation. In early observation in rats, the majority of bromoform was reported to have been eliminated via exhalation (Mink et al. Citation1986). A combination of these distinct factors could have contributed to the observed large variance and low absolute bioavailability. Most of the studies on Asparagopsis spp. as a feed additive also reported little to no accumulation of bromoform in body tissues (Kinley et al. Citation2020; Muizelaar et al. Citation2021), which supports the low bioavailability observed in this study.
For elucidation of metabolites, blood samples for both the oral and IV treatment cohorts for 100 mg were analysed for dibromomethane, a possible metabolite obtained through a reductive dehalogenation pathway (Holliger et al. Citation1992; Guo and Chen Citation2018; Glasson et al. Citation2022). While the possibility of both oxidative and reductive metabolites of bromoform in vivo has been reported in various studies (Stevens and Anders Citation1979, Citation1981; Behrendorff Citation2021; Glasson et al. Citation2022) only dibromomethane was analysed. This metabolite is of clinical importance as it is thought that methanogens in the rumen would metabolise bromoform to dibromomethane, which is believed to be one of the mechanisms for the anti-methanogenic activity of bromoform (Holliger et al. Citation1992; Guo and Chen Citation2018; Glasson et al. Citation2022). Measurable amounts of dibromomethane were detected in the blood following IV administration of bromoform. This may indicate extra ruminal dehalogenation, or it could indicate bromoform moving into the rumen from the circulation, undergoing dehalogenation, and moving back as dibromomethane into the circulation. Whatever the path of the dehalogenation, the extent, following IV administration, appears to be limited.
With rapid absorption, followed by rapid elimination, non-proportional PK dose profile, and low bioavailability, bromoform displayed distinct PK characteristics. However, until more is known about the optimal dose for inhibiting methanogenesis and target efficacy, it is too early to predict the clinical implications of the PK behaviour for bromoform reported in this study. Further work is required to understand how the limited bioavailability impacts withholding periods and how the short half-life within the rumen will impact dosing frequency. This study was done with a single bolus administration. However, to determine more practically relevant PK parameters, a steady state PK study is required, as bromoform containing products will probably need continuous dosing to achieve a sustained reduction in methane production.
This study has revealed some key findings that will help rationalise dosage regimens and inclusion levels of bromoform and bromoform-containing products as a feed additive. Of particular importance are the rapid absorption and dose dependent elimination kinetics, low absolute bioavailability, and non-proportional PK behaviour of bromoform, which will be of clinical relevance in the future.
Acknowledgements
This study was supported by New Zealand Agricultural Greenhouse Gas Research Centre (NZAGRC). We would like to thank Cognosco Animal Health and Production Research for conducting the animal trial and Analytica Laboratories for analysing the samples.
Disclosure statement
No potential conflict of interest was reported by the author(s).
Correction Statement
This article was originally published with errors, which have now been corrected in the online version. Please see Correction (http://dx.doi.org/10.1080/00480169.2024.2349344).
References
- Abbott DW, Aasen IM, Beauchemin KA, Grondahl F, Gruninger R, Hayes M, Huws S, Kenny DA, Krizsan SJ, Kirwan SF, et al. Seaweed and seaweed bioactives for mitigation of enteric methane: challenges and opportunities. Animals 10, 2432, 2020. https://doi.org/10.3390/ani10122432
- Abdelbagi M, Ridwan R, Fidriyanto R, Rohmatussolihat, Nahrowi, Jayanegara A. Effects of probiotics and encapsulated probiotics on enteric methane emission and nutrient digestibility in vitro. IOP Conference Series: Earth and Environmental Science 788, 012050, 2021. https://doi.org/10.1088/1755-1315/788/1/012050
- Baca-González V, Asensio-Calavia P, González-Acosta S, de la Lastra JMP, de la Nuez AM. Are vaccines the solution for methane emissions from ruminants? A systematic review. Vaccines 8, 460, 2020. https://doi.org/10.3390/vaccines8030460
- Batterman S, Zhang L, Wang S, Franzblau A. Partition coefficients for the trihalomethanes among blood, urine, water, milk and air. Science of the Total Environment 284, 237–47, 2002. https://doi.org/10.1016/S0048-9697(01)00890-7
- Behrendorff JBYH. Reductive cytochrome P450 reactions and their potential role in bioremediation. Frontiers in Microbiology 12, 649273, 2021. https://doi.org/10.3389/fmicb.2021.649273
- Bjornsson TD. Practical uses of individual pharmacokinetic parameters in drug development and clinical practice: examples and simulations. European Journal of Drug Metabolism and Pharmacokinetics 22, 1–14, 1997. https://doi.org/10.1007/BF03189779
- Burreson BJ, Moore RE, Roller PP. Volatile halogen compounds in the alga Asparagopsis taxiformis (Rhodophyta). Journal of Agricultural and Food Chemistry 24, 856–61, 1976. https://doi.org/10.1021/jf60206a040
- Chu I, Marino V. The acute toxicity of four trihalomethanes in male and female rats. Toxicology and Applied Pharmacology 52, 351–3, 1980. https://doi.org/10.1016/0041-008X(80)90122-2
- Corley RA, Mendrala AL, Smith FA, Staats DA, Gargas ML, Conolly RB, Andersen ME, Reitz RH. Development of a physiologically based pharmacokinetic model for chloroform. Toxicology and Applied Pharmacology 103, 512–27, 1990. https://doi.org/10.1016/0041-008X(90)90324-N
- Feng X, Kebreab E. Net reductions in greenhouse gas emissions from feed additive use in California dairy cattle. PLoS One 15, e0234289, 2020. https://doi.org/10.1371/journal.pone.0234289
- Glasson CRK, Kinley RD, de Nys R, King N, Adams SL, Packer MA, Svenson J, Eason CT, Magnusson M. Benefits and risks of including the bromoform containing seaweed Asparagopsis in feed for the reduction of methane production from ruminants. Algal Research 64, 102673, 2022. https://doi.org/10.1016/j.algal.2022.102673
- Guo M, Chen Y. Coenzyme cobalamin: biosynthesis, overproduction and its application in dehalogenation—a review. Reviews in Environmental Science and Bio/Technology 17, 259–84, 2018. https://doi.org/10.1007/s11157-018-9461-6
- Holliger C, Schraa G, Stupperich E, Stams AJ, Zehnder AJ. Evidence for the involvement of corrinoids and factor F430 in the reductive dechlorination of 1,2-dichloroethane by Methanosarcina barkeri. Journal of Bacteriology 174, 4427–34, 1992. https://doi.org/10.1128/jb.174.13.4427-4434.1992
- Kinley RD, de Nys R, Vucko MJ, Machado L, Tomkins NW. The red macroalgae Asparagopsis taxiformis is a potent natural antimethanogenic that reduces methane production during in vitro fermentation with rumen fluid. Animal Production Science 56, 282, 2016. https://doi.org/10.1071/AN15576
- Kinley RD, Martinez-Fernandez G, Matthews MK, de Nys R, Magnusson M, Tomkins NW. Mitigating the carbon footprint and improving productivity of ruminant livestock agriculture using a red seaweed. Journal of Cleaner Production 259, 120836, 2020. https://doi.org/10.1016/j.jclepro.2020.120836
- Lassen J, Difford GF. Genetic and genomic selection as a methane mitigation strategy in dairy cattle. Animal 14, s473–83, 2020. https://doi.org/10.1017/S1751731120001561
- Li X, Norman HC, Kinley RD, Laurence M, Wilmot M, Bender H, De Nys R, Tomkins N. Asparagopsis taxiformis decreases enteric methane production from sheep. Animal Production Science 58, 681–8, 2018. https://doi.org/10.1071/AN15883
- McConnell O, Fenical W. Halogen chemistry of the red alga Asparagopsis. Phytochemistry 16, 367–74, 1977. https://doi.org/10.1016/0031-9422(77)80067-8
- *Meat and Livestock Australia. Asparagopsis Now Commercially Available to Beef Producers. https://www.mla.com.au/news-and-events/industry-news/asparagopsis-now-commercially-available-to-beef-producers/ (accessed 20 October 2022). Meat & Livestock Australia, Sydney, NSW, Australia, 2022
- Mink FL, Brown TJ, Rickabaugh J. Absorption, distribution, and excretion of 14C-trihalomethanes in mice and rats. Bulletin of Environmental Contamination and Toxicology 37, 752–8, 1986. https://doi.org/10.1007/BF01607835
- Muizelaar W, Groot M, van Duinkerken G, Peters R, Dijkstra J. Safety and transfer study: transfer of bromoform present in Asparagopsis taxiformis to milk and urine of lactating dairy cows. Foods (Basel, Switzerland) 10, 584, 2021. https://doi.org/10.3390/foods10030584
- Nielsen NI, Ingvartsen KL. Propylene glycol for dairy cows. Animal Feed Science and Technology 115, 191–213, 2004. https://doi.org/10.1016/j.anifeedsci.2004.03.008
- Parra P, Martinez E, Suñol C, Artigas F, Tusell JM, Gelpl E, Albaigés J. Analysis, accumulation and central effects of trihalomethanes. I. Bromoform. Toxicological & Environmental Chemistry 11, 79–91, 1986. https://doi.org/10.1080/02772248609357122
- Potter BJ. Haemoglobinuria caused by propylene glycol in sheep. British Journal of Pharmacology and Chemotherapy 13, 385–9, 1958. https://doi.org/10.1111/j.1476-5381.1958.tb00225.x
- Roque BM, Salwen JK, Kinley R, Kebreab E. Inclusion of Asparagopsis armata in lactating dairy cows’ diet reduces enteric methane emission by over 50 percent. Journal of Cleaner Production 234, 132–8, 2019. https://doi.org/10.1016/j.jclepro.2019.06.193
- Schulze JDR, Peters EE, Vickers AW, Staton JS, Coffin MD, Parsons GE, Basit AW. Excipient effects on gastrointestinal transit and drug absorption in Beagle dogs. International Journal of Pharmaceutics 300, 67–75, 2005. https://doi.org/10.1016/j.ijpharm.2005.05.004
- Stevens JL, Anders MW. Metabolism of haloforms to carbon monoxide—III. Studies on the mechanism of the reaction. Biochemical Pharmacology 28, 3189–94, 1979. https://doi.org/10.1016/0006-2952(79)90060-1
- Stevens JL, Anders MW. Metabolism of haloforms to carbon monoxide. IV. Studies on the reaction mechanism in Vivo. Chemico-Biological Interactions 37, 365–74, 1981. https://doi.org/10.1016/0009-2797(81)90121-6
- *Toutain P-L, Ferran A, Bousquet-Mélou A. Species differences in pharmacokinetics and pharmacodynamics. In: Cunningham F, Elliott J, Lees P (eds). Comparative and Veterinary Pharmacology. Pp 19–48. Springer, Heidelberg, Germany, 2010. https://doi.org/10.1007/978-3-642-10324-7_2
- Toutain PL, Lees P. Integration and modelling of pharmacokinetic and pharmacodynamic data to optimize dosage regimens in veterinary medicine. Journal of Veterinary Pharmacology and Therapeutics 27, 467–77, 2004. https://doi.org/10.1111/j.1365-2885.2004.00613.x
- Wood JM, Scott Kennedy F, Wolfe RS. Reaction of multihalogenated hydrocarbons with free and bound reduced vitamin B12. Biochemistry 7, 1707–13, 1968. https://doi.org/10.1021/bi00845a013
- *Non-peer-reviewed