
Abstract
1. Understanding species differences in the toxicokinetics of bisphenol A (BPA) is central to setting acceptable exposure limits for human exposures to BPA. BPA toxicokinetics have been well studied, with controlled oral dosing studies in several species and across a wide dose range.
2. We analyzed the available toxicokinetic data for BPA following oral dosing to assess potential species differences and dose dependencies. BPA is rapidly conjugated and detoxified in all species. The toxicokinetics of BPA can be well described using non-compartmental analyses.
3. Several studies measured free (unconjugated) BPA in blood and reported area under the curve (AUC) of free BPA in blood of mice, rats, monkeys, chimpanzees and humans following controlled oral doses. Extrinsic clearance was calculated and analyzed across species and dose using allometric scaling.
4. The results indicate free BPA clearance is well described using allometric scaling with high correlation coefficients across all species and doses up to 10 mg/kg. The results indicate a human equivalent dose factor (HEDf) of 0.9 is appropriate for extrapolating a point of departure from mice and rats to a human equivalent dose (HED), thereby replacing default uncertainty factors for animal to human toxicokinetics.
Introduction
Bisphenol A (BPA: mw 228) is an industrial chemical primarily used to manufacture plastics and resins. It is an important component of epoxy resins used as protective coatings in metal food containers. It is also polymerized to form polycarbonate plastic, which is a clear and shatter-resistant plastic suitable for replacing glass or other materials in many applications (Vogel, Citation2009). BPA has been the subject of extensive toxicology testing in in vitro systems, in animals, and has been the subject of numerous epidemiological studies (Arnich et al., Citation2011; Hengstler et al., Citation2011; NTP, Citation2010; Peretz et al., Citation2014).
Several groups have conducted weight of evidence or in-depth evaluations of the toxicological data for BPA to determine a point of departure (POD) for use in a risk assessment (Arnich et al., Citation2011; European Food Safety Authority (EFSA), Citation2015; Lagarde et al., Citation2015; NTP, Citation2010; Zoeller & Vandenberg, Citation2015). The point of departure is an estimated dose at which an adverse effect is noted and from which lower safe exposures are extrapolated. While the results of these reviews do not always agree, the strongest evidence suggests that changes in kidney or overall body weight in rodents should be used as the POD (EFSA, Citation2015; Hengstler et al., Citation2011). Understanding species differences in the toxicokinetics of BPA can help reduce uncertainties in risk assessments for BPA (Hengstler et al., Citation2011; Teeguarden & Hanson-Drury, Citation2013).
Because of the extensive interest in BPA, toxicokinetic studies have recently been conducted in multiple species including rodents, non-human primates and humans (Doerge et al., Citation2010a, 2010b, 2010c, Citation2011,Citation2012; Sieli et al., Citation2011; Taylor, Citation2011; Teeguarden et al., Citation2015a; Thayer et al., Citation2015; Tominaga et al., Citation2006). Analytical and toxicological variability are apparent from BPA studies, and analytical difficulties coupled with the presence of BPA as a contaminant in laboratory equipment and supplies emphasize the importance of evaluating toxicokinetic and toxicological studies with extreme caution (Teeguarden & Hanson-Drury, Citation2013).
Oral exposures due to BPA in food packaging are thought to be the primary route of exposure for humans (EFSA, Citation2015). Total oral absorption is >80%, but in rats and mice this has been described as much lower due to first pass metabolism, and most of the dose (>50%) is recovered in feces due in large part to enterohepatic recirculation (Doerge et al., Citation2010a, 2011; FDA: Roth & Komoloprasert, Citation2007). The uptake, metabolism and distribution of BPA appears to be similar following oral exposures in rodents, monkeys and humans (Barrett, Citation2011; Taylor, Citation2011; Teeguarden et al., Citation2015a). Regardless of route, BPA is rapidly cleared from blood. For all species investigated, BPA is rapidly glucuronidated (i.e. conjugated) after absorption (Domoradzki et al., Citation2004; Völkel et al., Citation2002; Yang & Fisher, Citation2014). Sulfate conjugates of BPA have also been measured. In humans, however, BPA does not undergo enterohepatic recirculation to as significant an extent; only very low levels of unconjugated BPA (commonly referred to as free BPA) are detected, which indicates rapid conjugation after oral exposure coupled with low uptake of parent material (Teeguarden et al., Citation2015b; Völkel et al., Citation2002; Yang & Fisher, Citation2014). Elimination of BPA is primarily fecal in mice and rats, but primarily urinary in humans, and >50% BPA is eliminated in urine or feces as a conjugate in all species (FDA: Roth & Komoloprasert, Citation2007).
The potential effects from BPA exposure as reported in numerous studies are varied and inconsistent. In some animal studies, high doses of BPA have been shown to have neuroendocrine effects due to BPAs weakly estrogenic activity (Murray et al., Citation2007; Salian et al., Citation2009a, 2009b), whereas other studies have found no response (Arnich et al., Citation2011; Stump et al., Citation2010). The lack of dose response in adverse effects and variability in response from high dose studies has led some to hypothesize that BPA may have a non-monotonic adverse response dose relationship, leading to effects at low doses that are not seen at higher doses. Results from these low dose studies are likewise variable and inconsistent, and the doses described as low often equate to internal doses that are much higher than achieved from actual exposures (Teeguarden & Hanson-Drury, Citation2013). Most studies reporting the use of low doses are in vitro, and these results are also variable, with some studies showing potential non-monotonic effects, and others looking at the same endpoint finding no effect (NTP, Citation2010; Teeguarden & Hanson-Drury, Citation2013). Hazard evaluation and dose-response are difficult to obtain from studies that cannot be duplicated or that have insufficient data (Arnich et al., Citation2011). While still controversial, several government agencies and groups, including US National Toxicology Program (NTP), EFSA and the German Society of Toxicology have evaluated the data and opined that the lack of reproducibility for these low dose studies (both in vitro and in vivo) do not support a non-monotonic low dose effect in vivo (Arnich et al., Citation2011; EFSA, Citation2015; Hengstler et al., Citation2011; NTP, Citation2008)
For chemicals exhibiting saturable metabolism and/or elimination, the relationship between internal pharmacokinetics and external dose is expected to be linear at low doses (below saturable kinetics), but become non-linear at doses above which saturation of metabolism and/or elimination occurs (Kirman et al., Citation2003). The allometric scaling used to extrapolate pharmacokinetics (AUC and rate of metabolism) across species is most often assumed to scale as a function of BW0.75 (Clewell et al., Citation2002; Foureman & Kenyon, Citation2006). Kirman et al. (Citation2003) tested this relationship with a number of volatile organics, and showed it to be true for low doses. A more simple BW relationship between dose and area under the curve (AUC) was evident for higher doses (Kirman et al., Citation2003). For BPA, the determining factor for parent AUC will be clearance of free (unconjugated) BPA. In this paper, we evaluate the abundance of toxicokinetic data for BPA following oral exposures from multiple publications to determine species differences in the clearance of BPA. After determining the relationship between body weight, apparent clearance and AUC, Human Equivalent Dose Adjustment Factors (HEDf) were determined. An HEDf is used to scale internal dose (free BPA in blood) across species. The Human Equivalent Dose is the external dose or exposure that leads to an equivalent internal metric, such as AUC, at the POD derived from an animal toxicology study.
Materials and methods
Dose metric evaluation
A literature search was conducted to identify relevant toxicokinetic studies. Keywords included BPA and, toxicokinetics or pharmacokinetics, and oral. Species toxicokinetic comparisons are generally based on maximum serum concentration or area under the plasma concentration versus time curve (AUC). Consistent with other studies, AUC was compared here for free BPA (EFSA, Citation2015; Foureman & Kenyon, Citation2006; Gentry et al., Citation2002; Kirman et al., Citation2003). The data used to derive the AUC from the different studies were evaluated, and the AUC themselves were compared using standard extrapolation techniques, described below.
Studies that reported plasma AUC for free BPA after single oral exposures in species of interest are shown in and . When AUC was reported for 0–24 h, AUC24–∞ was calculated using BPA plasma concentration at 24 hours (obtained from figures within the references using DigitizeIt (Bormann, [email protected]) and the first-order elimination rate (Kel = ln(2)/T1/2:/h) using EquationEquation (1)(1) .
(1)
Table 1. Single gavage dose studies with relevant toxicokinetic data.
Table 2. Single gavage dose studies with reported AUCFree (0-24 h) extrapolated to AUCFree (0-∞) (nM*h).
Kel reported in each respective reference was used when possible. AUC24–∞ was then added to AUC0–24 to calculate AUC0–∞.
Critical considerations of the data included an assessment of the number of samples reported to be above the limit of quantitation (LOQ), and the shape of the pharmacokinetic curve. The determination of AUC requires capturing the Cmax and elimination phases, and the data were evaluated for these parameters.
The determining factor relating dose to AUC in blood is the clearance of free BPA. Specifically,
(2)
Or, rearranging and solving for AUC;
(3)
Fraction absorbed (f) of BPA has been reported to vary widely, from 1% to 100% (FDA: Roth & Komoloprasert, Citation2007; Doerge et al., Citation2011; Domoradzki et al., Citation2004; Pottenger et al., Citation2000; Teeguarden et al., Citation2015a, 2015b). Fecal elimination is greatest in rodents, and independent of route of exposure (Pottenger et al., Citation2000), so the apparent variability in bioavailability seems to be dependent on rapid first pass metabolism and enterohepatic recirculation. Due to the difficulty in determining f, it was not considered in this analysis. This relationship between AUC and clearance was used to calculate clearance for each study, species and dose ( and ). The relationship between either clearance or AUC and body weight has been shown to be related across species based on allometry where;
(4)
This basic pharmacokinetic principle states that clearance (and thus resulting AUC) scales between species based on body weight (BW) (Foureman & Kenyon, Citation2006; Kirman et al., Citation2003). The relationship between AUC or clearance and species-specific BW according to EquationEquation (4)(4) was used to determine dose- and species-specific internal dose metrics.
Data analysis
EquationEquation (4)(4) was used to fit pharmacokinetic data (AUC or CL), and outliers were identified using GraphPad Prism ROUT (Robust regression and Outlier removal) method (GraphPad Prism version 5.00 for Windows, GraphPad Software, San Diego, CA, www.graphpad.com: Motulsky & Brown, Citation2006). Allometric comparisons of clearance were evaluated against reported data and HEDf calculated by comparing AUC across species fit to EquationEquation (4)
(4) .
Results
For most of the identified datasets, Cmax was measured at about 1–2 h post-oral dosing, followed by a typical distribution phase and steady decline to the last time point (Doerge et al., Citation2012, 2011, 2010b; Sieli et al., Citation2011; Teeguarden et al., Citation2015a; Thayer et al., Citation2015; Tominaga et al., Citation2006). In rodents, the distribution phase can be seen from about 2 to 6 h post-dosing (Sieli et al., Citation2011; Tominaga et al., Citation2006).
Specific datasets that show differences from these tendencies include the rat data of Tominaga et al. (Citation2006), and the mouse data from Doerge et al. (Citation2011). While the curve for CD-1 mice in the study of Doerge et al. (Citation2011) are not shown, they report free BPA for most of their samples were below the limit of detection (n = 12) after the 0.1 mg/kg BPA dose at all time points. Levels of free BPA were detected only at the earliest tee time points, and only in one or two samples of the twelve possible at each time. In calculating the AUC of free BPA in mice, Doerge et al. (Citation2011) assumed a value of zero for free BPA in all samples that were below the LOD. This is inadequate for an accurate assessment of AUC and clearance.
While the concentration–time curves for monkeys and chimpanzees from the study of Tominaga et al. (Citation2006) show the expected time-course, the data from rats from the same study do not (see from the reference). The lowest concentrations of free BPA are reported at about 4 h, followed by an apparent increase. This results in an inability to validate clearance from the rat data in this study, and these data were not used in the final analyzes of clearance.
Figure 1. The relationship between AUC and dose across multiple species. All data are shown. Outliers (not used in regression) are encircled. The dotted line represents the upper 99% confidence intervals (determined based on the equation in the figure using Graphpad Prism).
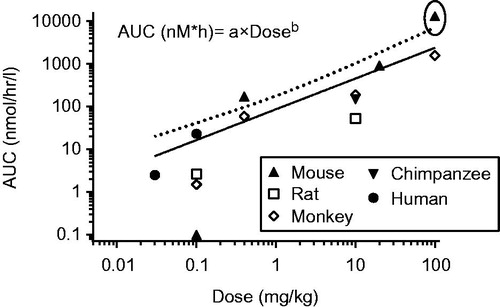
The AUC from all of the studies identified in show an increase with dose based on the same power function suggested for CL (EquationEquation (4)(4) ) (). Using Graphpad Prism and the ROUT method, AUC from the mouse for the highest described dose (100 mg/kg: Taylor Citation2011) was identified as an outlier and not used in further regressions (). This is consistent with a possible saturation of conjugation at these high doses, at least in mice. Fitting the power function equation to the AUC for free BPA in humans, monkeys, mice, chimpanzees and rats yields values of 3.3 for “a” and 1.3 for “b” with good agreement across species (r2 for all excluding the 100 mg/kg dose in mice = 0.97).
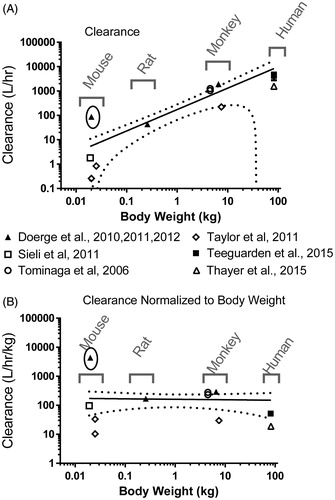
Clearance calculated using EquationEquation (2)(2) from AUC0–∞ showed the expected relationship for all data except that of Doerge et al. (Citation2011) for mice exposed to 0.1 mg/kg via gavage (). Plotting clearance (L/h) as a function of body weight and using Graphpad Prism and the ROUT method indicates the estimate of clearance for mice from Doerge et al. (Citation2011) is an outlier and does not fit with expected based on all of the other species (rat, monkey, chimpanzee, and human). Normalized to body weight, clearance in these studies ranged from 10 to 300 L/h/kg, whereas clearance from Doerge et al. (Citation2011) for mice was 4380 L/h/kg, ∼15-fold higher than any other study. As previously described, the Doerge et al. (Citation2011) AUC for mice was determined from 3 measurable data points, and only a fraction of the samples used to calculate these concentrations had detectable levels of BPA. Fitting the power function equation to CL (L/h/kg) for free BPA in humans, monkeys, mice, chimpanzees and rats yields values of 161 for “a” and −0.016 for “b” with good agreement across species (r2 = 0.90).
Figure 2. Clearance of BPA based on body weight in multiple species. The data are fit to a power function as described in EquationEquation (2)(2) . Mouse data from Doerge et al., Citation2011 are outliers (circled) and were excluded. Solid line shows the best fit of the allometric equation (EquationEquation (4)
(4) ). Dotted lines represent the 95% confidence interval. (A) Clearance (L/h), (B) Clearance normalized to body weight (L/h/kg).
Human exposure data are available for free BPA (Teeguarden et al., Citation2015a; Thayer et al., Citation2015). All data from both of these studies were supplied within the supplementary material of the publications, so clearance was calculated for each individual volunteer based on specific exposure and body weight information. The mean clearance rate in the 10 volunteers from Teeguarden et al. (Citation2015a, 2015b) was 61 ± 23 L/h*kg (range= 23–94 L/h/kg). The mean clearance rate for the fasted volunteers in the study of Thayer et al. (Citation2015) was 20 ± 6.6 L/h/kg (range= 13–36 L/h/kg). The average for all animal studies (excluding the mouse data from Doerge et al., Citation2011) was 161 ± 118 L/h/kg, indicating clearance in non-fasted humans is consistent with non-human laboratory animals, but fasting may decrease conjugation or clearance of free BPA.
Comparing calculated AUC measured in the human volunteer studies of Teeguarden et al. (Citation2015a, 2015b) shows good agreement between measured and predicted AUC. Clearance in an 81 kg individual (the average body weight in the study) is predicted to be 150 L/h*kg at a dose of 131 nmol/kg (0 .03 mg/kg). This value is 2.2× higher than 61 ± 23 L/h*kg calculated from the data presented in Teeguarden et al. (Citation2015a, 2015b), and about 7× higher than that reported by Thayer et al. (Citation2015), likely due to fasting condition of the subjects. The predicted AUC is 2.9 nM*h which is in close agreement with the AUC calculated from the study of Teeguarden et al. (Citation2015a, 2015b) (2.5 ± 1.3 nM*h). Following a dose of 438 nmol/kg (as in Thayer et al., Citation2015), the predicted AUC in humans is 29 nM*h, similar (1.5x higher) to the 20 nM*h from that reference. The study of Thayer et al. (Citation2015) was the only study identified in which the subjects (animal or human) were fasted prior to treatment. Changes in glucuronidation following fasting are known (Cornish & Ryan, Citation1965), thereby potentially leading to lower clearance of BPA.
HEDf were calculated using the predicted clearance and AUC following a dose of 438 µmol (0.1 mg/kg) (). The results of these clearance comparisons show HEDf of 0.9 for either mice or rats. This equation can also be used to derive HEDf for other species, based on body weight.
Table 3. Human equivalent factors.
Discussion
The results from the current study show that the clearance of BPA is consistent across doses up to about 10 mg/kg, and is well described using an allometric relationship (EquationEquation (4)(4) ) with a power of −0.016 AUC can either be determined using a similar equation (AUC (nM*h) = 3.3 × Dose (mg/kg)1.3), or directly from clearance (EquationEquation (3)
(3) ), which is what has been done here. Most studies that attempted to determine a dose–response or saturation have only included 2 doses (e.g. Taylor, Citation2011), providing weak evidence for such a saturation. By analyzing the AUC across a wide range of doses and species and across multiple studies suggests saturation of glucuronidation may occur at doses greater than 10 mg/kg, which is consistent with other reports (Domoradzki et al., Citation2004). However, analytical difficulties from the low doses also appear to be an issue; these difficulties are evident in studies in mice and rats (Doerge et al., Citation2012; Tominaga et al., Citation2006).
AUC (of any compound) is a function of dose and whole body clearance (combination of metabolism and elimination). Low dose animal studies are lacking and the high dose studies lack relevance to human exposures (Volkel, Citation2017). Having available measured AUCs from numerous studies over a wide range of doses and species provides increased confidence in determining dose and species dependent effects on clearance of BPA. This allowed for an assessment of potential saturation of clearance mechanisms at high doses and potential analytical shortcomings when clearance estimates were drastically different at low doses. In this analysis, clearance estimates across doses and species were fit to a power function (EquationEquation (4)(4) ). Clearance predicted from Doerge et al. (Citation2011) in mice was identified as an outlier compared to all other data from all species (). With only 3 data points with samples above the LOD averaging in zeros for data below the LOD and missing the terminal phase has likely resulted in a vast underestimate of AUC of unconjugated BPA in mice in Doerge et al. (Citation2011). In addition, the fraction absorbed is likely nearly 100% in humans and monkeys and possibly lower than that in rats and mice, and this may impact predicted AUC. In the final analysis, we are comparing AUC to dose between species, so f is implied.
The analysis described herein allows for evidence-based species extrapolation without using assumptions or default uncertainty factors (UF). Fitting to the power function has permitted allometric scaling of clearance across multiple species and shows that clearance (L/h) scales as a function of BW raised to the 0.88 power, close to unity. This is borne out by simply normalizing to body weight, which results in an allometric relationship with a power function of −0.016, indicated unity (x0 = 1). The HEDf calculated herein is similar to the value calculated by the European Food Safety Authority (EFSA, Citation2015), which determined an HEDf = 0.72 by comparing rat to human AUC of free (aglycone) BPA. We have added more pharmacokinetic studies in more species and determined an HEDf of 0.9 across all species. This HEDf is a BPA-specific adjustment factor to describe dose-based risk in humans compared to data in experimental animals. Interspecies scaling using the HEDf reduces uncertainty in inter-species differences in toxicokinetic by quantifying differences in dose metrics. Using this finding, appropriate HEDf factor of 0.9 are most appropriate for scaling the dose at the PODs from mice and rats (). Thus, a HED should be 0.9 times the POD when the POD is derived from mouse or rat oral dosing studies, thereby replacing default uncertainty factors for the animal to human PK uncertainty factor.
Declaration of interest
The authors received funding from the American Chemistry Council for development of this analysis and manuscript. The authors had complete control over the analyses, content and preparation of the manuscript.
References
- Arnich N, Canivenc-Lavier M-C, Kolf-Clauw M, et al. (2011). Conclusions of the French Food Safety Agency on the toxicity of bisphenol A. Int J Hyg Environ Health 214:271–5
- Barrett JR. (2011). The pharmacokinetics of BPA: similarities in human and animal metabolism suggest higher exposure than thought. Environ Health Perspect 119:A177
- Clewell HJ, Andersen ME, Barton HA. (2002). A consistent approach for the application of pharmacokinetic modeling in cancer and noncancer risk assessment. Environ Health Perspect 110:85–93
- Cornish HH, Ryan RC. (1965). Metabolism of benzene in nonfasted, fasted, and aryl-hydroxylase inhibited rats. Toxicol Appl. Pharmacol 7:767–71
- Doerge DR, Twaddle NC, Vanlandingham M, Fisher JW. (2010a). Pharmacokinetics of bisphenol A in neonatal and adult Sprague-Dawley rats. Toxicol Appl Pharmacol 247:158–65
- Doerge DR, Twaddle NC, Woodling KA, Fisher JW. (2010b). Pharmacokinetics of bisphenol A in neonatal and adult rhesus monkeys. Toxicol Appl Pharmacol 248:1–11
- Doerge DR, Vanlandingham M, Twaddle NC, Delclos KB. (2010c). Lactational transfer of bisphenol A in Sprague-Dawley rats. Toxicol Lett 199:372–6
- Doerge DR, Twaddle NC, Vanlandingham M, Fisher JW. (2011). Pharmacokinetics of bisphenol A in neonatal and adult CD-1 mice: inter-species comparisons with Sprague-Dawley rats and rhesus monkeys. Toxicol Lett 207:298–305
- Doerge DR, Twaddle NC, Vanlandingham M, Fisher JW. (2012). Pharmacokinetics of bisphenol A in serum and adipose tissue following intravenous administration to adult female CD-1 mice. Toxicol Lett 211:114–19
- Domoradzki JY, Thornton CM, Pottenger LH, et al. (2004). Age and dose dependency of the pharmacokinetics and metabolism of bisphenol A in neonatal sprague-dawley rats following oral administration. Toxicol Sci 77:230–42
- EFSA (European Food Safety Authority). (2015). Scientific Opinion on the risks to public health related to the presence of bisphenol A (BPA) in foodstuffs: PART II - Toxicological assessment and risk characterisation. EFSA Panel on Food Contact Materials, Enzymes, Flavourings and Processing Aids (CEF) European Food Safety Authority (EFSA), Parma, Italy. http://www.efsa.europa.eu/sites/default/files/scientific_output/files/main_documents/3978part2.pdf
- FDA: Roth WL, Komolprasert V. (2007). Toxicokinetics of Bisphenol A. Memo to US Department of Health and Human services. https://www.fda.gov/ohrms/dockets/ac/08/briefing/2008-0038b1_01_16_FDA%20 Reference%20Material-FDA%20Memo%20FDA%20Memo%20P.pdf
- Foureman GL, Kenyon EM. (2006). Harmonization in interspecies extrapolation: use of BW3/4 as default method in derivation of the oral RfD. EPA/630/R-06/001. Washington (DC)
- Gentry PR, Covington TR, Andersen ME, Clewell HJ. (2002). Application of a physiologically based pharmacokinetic model for isopropanol in the derivation of a reference dose and reference concentration. Regul Toxicol. Pharmacol 36:51–68
- Hengstler JG, Foth H, Gebel T, et al. (2011). Critical evaluation of key evidence on the human health hazards of exposure to bisphenol A. Crit Rev Toxicol 41:263–91
- Kirman CR, Sweeney LM, Meek ME, Gargas ML. (2003). Assessing the dose-dependency of allometric scaling performance using physiologically based pharmacokinetic modeling. Regul Toxicol Pharmacol 38:345–67
- Lagarde F, Beausoleil C, Belcher SM, et al. (2015). Non-monotonic dose-response relationships and endocrine disruptors: a qualitative method of assessment. Environ Health 14:13
- Motulsky HJ, Brown RE. (2006). Detecting outliers when fitting data with nonlinear regression – a new method based on robust nonlinear regression and the false discovery rate. BMC Bioinformatics 7:123
- Murray TJ, Maffini MV, Ucci AA, et al. (2007). Induction of mammary gland ductal hyperplasias and carcinoma in situ following fetal bisphenol A exposure. Reprod Toxicol 23:383–90
- Negishi T, Tominaga T, Ishii Y, et al. (2004). Comparative study on toxicokinetics of bisphenol A in F344 rats, monkeys (Macaca fascicularis), and chimpanzees (Pan troglodytes). Exp Anim 53:391–4
- NTP. (2008). NTP-CERHR Monograph on the Potential Human Reproductive and Developmental Effects of Bisphenol A. Washington, DC
- NTP. (2010). Bisphenol A. Washington (DC)
- Peretz J, Vrooman L, Ricke WA, et al. (2014). Bisphenol A and reproductive health: update of experimental and human evidence, 2007–2013. Environ Health Perspect 122:775–86
- Pottenger LH, Domoradzki JY, Markham DA, et al. (2000). The relative bioavailability and metabolism of bisphenol A in rats is dependent upon the route of administration. Toxicol Sci 54:3–18
- Salian S, Doshi T, Vanage G. (2009a). Perinatal exposure of rats to bisphenol A affects the fertility of male offspring. Life Sci 85:742–52
- Salian S, Doshi T, Vanage G. (2009b). Impairment in protein expression profile of testicular steroid receptor coregulators in male rat offspring perinatally exposed to bisphenol A. Life Sci 85:11–18
- Sieli PT, Jašarevic E, Warzak DA, et al. (2011). Comparison of serum bisphenol A concentrations in mice exposed to bisphenol A through the diet versus oral bolus exposure. Environ Health Perspect 119:1260–5
- Stump DG, Beck MJ, Radovsky A, et al. (2010). Developmental neurotoxicity study of dietary bisphenol A in Sprague-Dawley rats. Toxicol Sci 115:167–82
- Taylor J. (2011). Similarity of bisphenol A pharmacokinetics in rhesus monkeys and mice: relevance for human exposure. Environ Health Perspect. 119:422–30
- Teeguarden JG, Hanson-Drury S. (2013). A systematic review of bisphenol A “low dose" studies in the context of human exposure: a case for establishing standards for reporting “low-dose" effects of chemicals. Food Chem Toxicol 62:935–48
- Teeguarden JG, Twaddle NC, Churchwell MI, et al. (2015a). 24-hour human urine and serum profiles of bisphenol A following ingestion in soup: Individual pharmacokinetic data and emographics. Data Brief 4:83–6
- Teeguarden JG, Twaddle NC, Churchwell MI, et al. (2015b). 24-hour human urine and serum profiles of bisphenol A following ingestion in soup: individual pharmacokinetic data and emographics. Data Brief 4:83–6
- Thayer KA, Doerge DR, Hunt D, et al. (2015). Pharmacokinetics of bisphenol A in humans following a single oral administration. Environ Int 83:107–15
- Tominaga T, Negishi T, Hirooka H, et al. (2006). Toxicokinetics of bisphenol A in rats, monkeys and chimpanzees by the LC-MS/MS method. Toxicology 226:208–17
- Vandenberg LN, Gerona RR, Kannan K, et al. (2014). A round robin approach to the analysis of bisphenol A (BPA) in human blood samples. Environ Health 13:25
- Vogel SA. (2009). The politics of plastics: the making and unmaking of bisphenol a “safety". Am J Public Health 99:S559–66
- Völkel W. (2017). Why did researchers not use realistic doses in animal studies of bisphenol A? Arch Toxicol 91:1519–22
- Völkel W, Colnot T, Csanády GA, et al. (2002). Metabolism and kinetics of bisphenol a in humans at low doses following oral administration. Chem Res Toxicol 15:1281–7
- Yang X, Fisher JW. (2014). Unraveling bisphenol A pharmacokinetics using physiologically based pharmacokinetic modeling. Front Pharmacol 5:292
- Zoeller RT, Vandenberg LN. (2015). Assessing dose-response relationships for endocrine disrupting chemicals (EDCs): a focus on non-monotonicity. Environ Health 14:42