
Abstract
The evaluation of drug-mediated cytochrome P450 (P450) induction using human hepatocytes is important for predicting drug interactions. In this study, we prepared hepatocytes from chimeric mice with humanised livers (Hu-Liver mice) and evaluated the expression and inducibility of P450s in these hepatocytes.
Up to 95% of the Hu-Liver cells stained positive for human leukocyte antigen and the mean viability exceeded 85% (n = 10). Monolayer-cultured Hu-Liver cells displayed a similar morphology to cultures of the corresponding human hepatocytes used as transplantation donors.
The mRNA expression levels in Hu-Liver cells of 16 P450 forms belonging to P450 subfamilies 1–4 correlated well with the expression levels of the same enzymes in human hepatocytes. The variations in individual P450 mRNA levels between Hu-Liver cells and the corresponding human hepatocytes were within five-fold for 13 P450 forms.
The production of 6β-hydroxytestosterone in Hu-Liver cells was significantly increased (p < .05) following treatment with the CYP3A inducer, rifampicin.
Hu-Liver cells have characteristics similar to those of human hepatocytes in terms of mRNA expression levels and the inducibility of the various P450 forms. Thus, Hu-Liver cells can potentially be used for in vitro drug-mediated induction assays of human hepatic P450s.
Introduction
Predictions of drug metabolism, kinetics and interactions in humans are considered critical in the development of new drugs as these parameters can cause profound clinical effects, either by enhancing the toxicity of drugs or by reducing their therapeutic efficacy. The cytochrome P450s (P450, a general term for the cytochrome P450 enzymes (EC 1.14.14.1), otherwise abbreviated as CYP) are a superfamily of major drug-metabolising enzymes, responsible for reactions involving the oxidation, reduction and hydrolysis of exogenous and endogenous compounds such as steroid hormones, pollutants and drugs (Guengerich, Citation2006). Based on the key roles of P450s in drug metabolism, the evaluation of P450 induction potency is recommended as part of the standard drug interaction study protocol in the guidelines of both the US Food and Drug Administration (https://www.fda.gov/downloads/Drugs/GuidanceComplianceRegulatoryInformation/Guidances/UCM581965.pdf) and the European Medicines Agency (http://www.ema.europa.eu/docs/en_GB/document_library/Scientific_guideline/2012/07/WC500129606.pdf). Induction potency of drug candidates towards CYP1A2, CYP2B6, CYP3A4, CYP2C8, CYP2C9 and CYP2C19 is assessed at the mRNA level and/or in terms of enzyme activity in plateable, cryopreserved or freshly isolated human hepatocytes. The limited number of primary human hepatocytes obtainable from a single donor impedes their use in studies involving conventional hepatocyte culture or transplantation into chimeric mice. However, the continuous and copious use of hepatocytes of the same origin is a particularly limiting factor in the maintenance of a standard hepatocyte culture.
Many chimeric mouse strains with reconstituted livers containing human hepatocytes have been developed as in vivo models for drug metabolism, pharmacokinetics, drug/chemical toxicity and hepatitis C virus replication (Azuma et al., Citation2007; Kamimura and Ito, Citation2016; Mercer et al., Citation2001; Suemizu et al., Citation2018; Tateno et al., Citation2004). We also developed a chimeric mouse model with a humanised liver (Hu-Liver mice) by transplanting human hepatocytes into mouse albumin enhancer/promoter-driven Herpes simplex virus type 1 thymidine kinase (HSV-TK)-transgenic NOG mice (TK-NOG) (Hasegawa et al., Citation2011). The livers of the Hu-Liver mice were shown to be mature, functional human livers, both in terms of gene expression patterns and human-specific drug-metabolising activities (Hasegawa et al., Citation2011). This Hu-Liver mouse model has been used for studies in various fields, including pharmacokinetics (Nishiyama et al., Citation2015; Utoh et al., Citation2016), metabolism (Kamimura et al., Citation2015, Citation2017) and toxicity (Suemizu et al., Citation2018). In addition, another Hu-Liver chimeric mouse model derived from uPA/SCID mice has since been applied to non-clinical safety and metabolism studies (Foster et al., Citation2014), including the prediction of P450 induction in vivo (Kakuni et al., Citation2013; Katoh et al., Citation2005) and human pharmacokinetics (Sanoh and Ohta, Citation2014).
Analysis of cryopreserved isolated hepatocytes from uPA/SCID chimeric mice revealed that the expression profiles of several P450 mRNAs and the inducibility of the CYP1A2 and CYP3A4 mRNAs were similar to those of cryopreserved primary human hepatocytes (Nishimura et al., Citation2005; Yoshitsugu et al., Citation2006). However, CYP1A2, CYP2C19, CYP2D6 and CYP3A4 activities in fresh human hepatocytes were lower than in fresh hepatocytes from uPA/SCID chimeric mice (Yamasaki et al., Citation2010). The induction of CYP1A2 mRNA by β-naphthoflavone exposure and CYP3A4 mRNA by rifampicin exposure was observed in freshly isolated hepatocytes from uPA/SCID chimeric mice (Kakuni et al., Citation2013; Nishimura et al., Citation2005; Yoshitsugu et al., Citation2006), similar to the results obtained with primary human hepatocytes (Nishimura et al., Citation2009). In this study, we prepared human hepatocytes from Hu-Liver TK-NOG mice and conducted more detailed studies of the mRNA expression levels of sixteen P450 genes belonging to the CYP1–4 families. We evaluated the induction potency of typical P450 inducers based on changes in P450 mRNA expression and metabolite production levels in Hu-Liver cells.
Materials and methods
Chemicals and reagents
β-Naphthoflavone, phenytoin and flumazenil were purchased from Tokyo Kasei Kogyo (Tokyo, Japan). Dimethyl sulfoxide (DMSO), 6-(4-chlorophenyl)imidazo[2,1-b][1,3]thiazole-5-carbaldehyde O-(3,4-dichlorobenzyl)oxime (CITCO), pregnenolone 16α-carbonitrile, rifampicin and 6β-hydroxytestosterone were purchased from Sigma-Aldrich (St. Louis, MO, USA). Omeprazole, phenobarbital and testosterone were purchased from Fujifilm Wako Pure Chemical (Osaka, Japan). Collagen-coated 24-well plates were purchased from Thermo Fisher Scientific (Waltham, MA, USA). Oligonucleotide primers were synthesised by Eurofins Genomics (Tokyo, Japan). Cryopreserved human hepatocytes from donors with informed consent were purchased from Lonza Walkersville, Inc. (35YM-, 30YF- and 2YM-donors; Walkersville, MD, USA), BioreclamationIVT (5YF-donor; Westbury, NY, USA), and Biopredic International (5YM-donor; Rennes, France). All other regents used were of the highest quality commercially available.
Animals and preparation of hepatocytes
All mouse studies were conducted in strict accordance with the Guide for the Care and Use of Laboratory Animals of the Central Institute for Experimental Animals (CIEA), and the experimental protocols were approved by the Animal Care Committee of CIEA (Permit Number: 11029A). All surgeries were performed under isoflurane anaesthesia, and all efforts were made to minimise suffering. The experimental use of commercially available cryopreserved human hepatocytes was approved by the Research Ethics Committee of CIEA. Human hepatocytes were prepared from cryopreserved human hepatocytes using Human Hepatocyte Thawing Medium (Lonza Walkersville) according to the manufacturer’s instructions. Hu-Liver TK-NOG mice were generated using a previously described method (Suemizu et al., Citation2018). There are two factors affecting success when preparing human hepatocyte-engrafted mice. (1) Creating a suitable niche, that is a space for engrafting and proliferating the transplanted human hepatocytes, by first destroying host mouse hepatocytes. In our experience, the serum activity level of alanine aminotransferase (ALT) has to be more than 600 IU/L in the recipient mice. (2) Selecting a suitable hepatocyte batch for preparing the humanised liver mice. The hepatocyte batches used in this study were selected based on an in vivo screening test according to the following criteria: at least three chimeric mice obtained with high (>70%) repopulation out of five recipients of the hepatocyte transplantation (106 cells/head). In recent transplantation experiments using four different donors, 77 out of 134 transplants exhibited a repopulation ratio exceeding 50%. Over the past 3 years, we have checked 24 commercially available cryopreserved human hepatocyte batches purchased from four different companies. Only four batches of hepatocytes met our criteria for in vivo transplantation experiments. Liver cells were isolated from Hu-Liver mice with different chimeric ratios and different donors (detailed donor information in ) using a two-step collagenase perfusion method (Seglen, Citation1976) with slight modifications. Briefly, a 27G butterfly needle was inserted into the posterior vena cava and clamped with adhesive. The portal vein was cut, allowing outflow of solution. The liver was then perfused at 37 °C with 1× Liver Perfusion Medium (Thermo Fisher Scientific) for 7 min at 6 mL/min. The perfusion medium was then changed to 0.15% collagenase medium [360 U/mL collagenase type IV (CLSS4; Worthington Biochemical Corporation, Lakewood, NJ, USA), 140 U/mL collagenase type IV (C1889; Sigma-Aldrich), 0.6 mg/mL CaCl2, 10 mM HEPES (pH 7.4) and 10 mg/mL gentamycin] and perfused for 10 min at 1.5 mL/min. The dissected liver was transferred to a dish containing 50 mL of phosphate-buffered saline (PBS) containing 1% foetal bovine serum (FBS; Thermo Fisher Scientific), and gently agitated to dissociate cells from the digested liver. The liver cells were filtered through 100-μm nylon filters in a closed sterile container (Corning Life Sciences, Woburn, MA, USA) and centrifuged at 50×g for 4 min at 4 °C. The cells were washed twice with 50 mL of ice-cold PBS containing 1% FBS by centrifugation at 50×g for 4 min. Dead cells were removed with 27% Percoll (GE Healthcare, Buckinghamshire, UK) density gradient centrifugation at 60×g for 7 min. The wash was repeated three times at 50×g for 4 min. Following the final spin, the cells were resuspended in Dulbecco’s modified Eagle’s medium (DMEM; Sigma-Aldrich) containing 10% FBS, 44 mM NaHCO3, 1 mM sodium pyruvate and two antibiotics (50 units/mL penicillin G and 50 μg/mL streptomycin; Sigma-Aldrich). The cell numbers and viability of the prepared liver cells (Hu-Liver cells) were determined with the trypan blue exclusion test. Human albumin concentrations in the plasma and cultured medium were measured with a human albumin ELISA quantitation kit (Bethyl Laboratories, Montgomery, TX, USA).
Table 1. Preparation of Hu-Liver cells from chimeric mice with humanised livers.
Flow cytometry analysis
The ratio of human leukocyte antigen (HLA)-expressing-human cells and mouse H-2kd-expressing-mouse cells to the total number of Hu-Liver cells was analysed with fluorescence-activated cell sorting (FACS) as described previously (Higuchi et al., Citation2016). Briefly, cells were stained with monoclonal mouse anti-HLA antibody (clone G46-2.6; BD Biosciences, Franklin Lakes, NJ, USA), monoclonal mouse anti-mouse H-2kd antibody (clone SF1-1.1; BD Biosciences) and propidium iodide to evaluate cell viability with the BD FACSCanto (BD Biosciences). Data were analysed and presented with the BD FACSDiva software program (BD Biosciences) and the FlowJo program (Tree Star, San Carlos, CA, USA).
P450 induction assay
Hu-Liver cells and human hepatocytes were seeded into collagen I-coated 24-well plates (Thermo Fisher Scientific) at 2.5 × 10⁵ cells/well and cultured in DMEM at 5% CO2 and 37 °C. Twenty hours after seeding, the medium was changed to serum-free medium and the cells were incubated for another 24 h. The cells were then incubated separately with one of the following P450 inducers: omeprazole (50 μM), β-naphthoflavone (50 μM), phenobarbital (1 mM), CITCO (0.1 μM), rifampicin (10 μM), pregnenolone 16α-carbonitrile (10 μM), phenytoin (250 μM) or flumazenil (50 μM) for 48 h. All inducers except phenobarbital were dissolved in sterile-filtered DMSO (Hybri-Max, ≥99.7% purity; Sigma-Aldrich) and then added to the culture medium such that the final DMSO concentration was 0.1% (v/v). Phenobarbital was first dissolved in culture medium containing 0.1% DMSO (v/v). Dose-dependent CYP3A4 mRNA induction in human hepatocytes and Hu-Liver cells was tested with the typical inducer, rifampicin (0.83–50 μM). Total cellular RNA was prepared with an RNeasy Mini Kit (Qiagen, Valencia, CA, USA) and stored at −80 °C until further use.
Quantitative reverse transcription PCR
Human P450 mRNA levels in human hepatocytes and Hu-Liver cells were analysed with the real-time reverse transcription-polymerase chain reaction (RT-PCR). First-strand cDNA was synthesised from total cellular RNA using the High-Capacity cDNA Reverse Transcription Kit (Thermo Fisher Scientific) in a 20-µL reaction mix. Quantitative RT-PCR of human P450 mRNA levels was performed with SYBR Green-based detection on the 7500 Fast Real-Time PCR system (Applied Biosystems, Foster City, CA, USA). Primers used for amplification were: 5′-GCTTCTACATCCCCAAGAAAT-3′ and 5′-TCCCACTTGGCCAGGACT-3′ for CYP1A2, 5′-AGCAACAGGCCTTTCAGTT-3′ and 5′-CCCAATGAAGAGGTTCAAC-3′ for CYP2A6, 5′-AATATGGGGACGTCTTCACG-3′ and 5′-TTCCATTGGCAAAGATCACA-3′ for CYP2B6, 5′-AGATCAGAATTTTCTCACCC-3′ and 5′-AACTTCGTGTAAGAGCAACA-3′ for CYP2C8, 5′-CAGATCTGCAATAATTTTTCTC-3′ and 5′-CTTTCAATAGTAAATTCAGATG-3′ for CYP2C9, 5′-ATTGAATGAAAACATCAGGATTG-3′ and 5′-GAGGGTTGTTGATGTCCATC-3′ for CYP2C19, 5′-GGTGTGACCCATATGACATC-3′ and 5′-CTCCCCGAGGCATGCACG-3′ for CYP2D6, 5′-CCATCATCGGGAACCTCTT-3′ and 5′-CCCGAGAACTCGTCCTTGTA-3′ for CYP2E1, 5′-AGCTTGGAGCTTGGTGACAT-3′ and 5′-CTTCTTTGCTCCTTCCATGC-3′ for CYP2J2, 5′-TCTGCCTTTTTTGGGAAATA-3′ and 5′-GGCTGTTGACCATCATAAAAG-3′ for CYP3A4, 5′-AGTGTTCTTTCCTTCACTTTA-3′ and 5′-TTCAACATCTTTCTTGCAAGT-3′ for CYP3A5, 5′-GGCCATTAGTGACCTGAACAA-3′ and 5′-TTCCTCAGTTGGATCACTTGG-3′ for CYP4A11, 5′-CAAGTTCTTCTACAGCTTCCTGG-3′ and 5′-GTGCATGATGTTCACACTCTCA-3′ for CYP4F2, 5′-GCTTTAAGGTCTGGATGGGC-3′ and 5′-GGCTTCAGGAAGCTGTAGAAGAC-3′ for CYP4F3B, 5′-AGTGGTCTCTCCTGGGTCCTA-3′ and 5′-AGGTCGTCCCATTCAATCTCTA-3′ for CYP4F11, 5′-GAAGGCATTGTCAGATGAGGAT-3′ and 5′-AGAAGCTCTTGCACCTCCTGT-3′ for CYP4F12, 5′-GGAGTCAACGGATTTGGT-3′ and 5′-AAGATGGTGATGGGATTTCCA-3′ for glyceraldehyde 3-phosphate dehydrogenase (GAPDH). Primers for the CYP1A2, CYP2A6, CYP2C8, CYP2C9, CYP2C19, CYP2D6 and CYP3A5 genes were designed in a previous report (Katoh et al., Citation2004). None of the primer sets for human P450s showed any cross-reactivity with the cDNA from mouse liver total cellular RNA. The reaction mixtures (10 µL) contained 400 nM of each primer, 5 µL of PowerUp SYBR Green Master Mix (Applied Biosystems), 2 µL of template DNA, and RNase-free water. For all P450 genes except CYP3A4, the thermal cycling conditions were as follows: an initial denaturation for 2 min at 95 °C, followed by 40 cycles of 95 °C for 15 s and 60 °C for 1 min. For CYP3A4, the thermal cycling conditions were as follows: an initial denaturation for 2 min at 95 °C, followed by 40 cycles of 95 °C for 15 s, 57 °C for 15 s and 72 °C for 1 min. Standard curves were created with the absolute amounts (102–107 copies) of a serial ten-fold dilution of purified human P450 cDNAs. The expression level of each P450 mRNA was determined by normalising the raw data to the GAPDH mRNA level.
Measurement of testosterone 6β-hydroxylation activity
Testosterone 6β-hydroxylation activities in human hepatocytes and Hu-Liver cells cultured in 24-well plates were analysed by liquid chromatography coupled with tandem mass spectrometry (LC-MS/MS). The LC-MS/MS system consisted of a Shimadzu Nexera UHPLC system (Kyoto, Japan) coupled with an API QTRAP 5500 triple quadrupole mass spectrometer (AB Sciex; Darmstadt, Germany). After 48 h exposure to rifampicin or 0.1% DMSO, the hepatocytes were incubated with DMEM (500 µL) containing 100 µM testosterone at 37 °C in a humidified atmosphere of 5% CO2 for 60 min. Testosterone was dissolved in DMSO and then added to the culture medium such that the final DMSO concentration was 0.1% (v/v). At the end of the incubation period, the reaction medium (10 μL) was dissolved in 20 μL acetonitrile and 10 μL of the internal standard consisting of 50 ng/mL caffeine. The supernatant (2 μL) obtained by centrifugation (20,000×g, 5 min) was injected into a YMC-Triart C18 column (3 μm, 3.0 mm ×100 mm; YMC, Kyoto, Japan). Binary gradient elution with solvent A (0.1% formic acid in water, v/v) and solvent B (20% methanol) was carried out at a flow rate of 0.3 mL/min as follows: 0–12 min, 20%–80% B; 12–15 min, 100% B; 15–18 min, 20% B. The mass spectrometer was operated in the positive ion electrospray ionisation mode, and the ions were detected in the multiple reaction monitoring mode with a precursor-to-product mass transition of m/z 305.2 to m/z 269.2 for 6β-hydroxytestosterone and m/z 195.1 to m/z 138.0 for caffeine. The main operating parameters were as follows: curtain gas, 30 psi; gas 1, 50 psi; gas 2, 80 psi; dwell time, 250 ms; ion spray voltage, 4.5 kV; ion source temperature, 500 °C; declustering potential, 15 V; collision energy, 19 V.
Data analysis
Linear regression analyses with 95% confidence intervals between expression levels of the P450 mRNAs were analysed with Prism (GraphPad Software; La Jolla, CA, USA). EC50 and Emax for the expression level of CYP3A4 mRNA following rifampicin treatment were estimated from the concentration–response curves fitted to the three-parameter Hill sigmoid equation using the KaleidaGraph program (Synergy Software, Reading, PA, USA). One-way analysis of variance (ANOVA) with Tukey’s post hoc test was performed in Prism to compare testosterone 6β-hydroxylation activities between the control and rifampicin-induced samples. All values represent mean ± standard deviation in triplicate determination or mean in duplicate determination. The coefficient of variation from duplicate experiments was within 20%.
Results and discussion
TK-NOG mice with humanised livers have increasingly attracted attention as a potentially useful model for preclinical drug metabolism and pharmacokinetic studies, as they offer good predictivity of the human pharmacokinetics of P450 substrates (Utoh et al., Citation2016) and show human-specific metabolism (Kamimura et al., Citation2015). Hepatocytes prepared from these mice, termed Hu-Liver cells, are expected to be useful tools for P450 induction assays and for predicting drug metabolism in humans; however, the molecular characteristics of this cell line have not been clarified. In this study, we investigated the expression levels and inducibility of human P450 mRNAs in Hu-Liver cells.
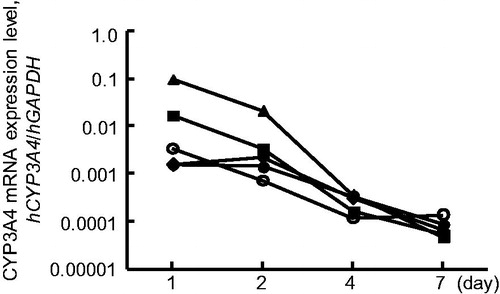
Hu-Liver mice were constructed by transplanting human hepatocytes (from 35YM-, 30YF-, 2YM-, 5YF- and 5YM-donors) into liver-injured TK-NOG mice (Hasegawa et al., Citation2011). A total of 14 Hu-Liver mice (35YM, 5 mice; 30YF, 1 mouse; 2YM, 1 mouse; 5YF, 3 mice; 5YM, 4 mice), with varying chimeric ratios ranging between 19% and 95%, were used as the cell source for preparing fresh human hepatocytes to study in vitro induction of P450 mRNA expression and enzyme activities (). A positive correlation was observed between the estimated chimeric ratio (indicated as RI% and calculated based on plasma levels of human albumin in Hu-Liver mice) and the ratio of HLA-positive cells (r2 = 0.6579, p = .0004), while a negative correlation was found between the same RI% and the ratio of H-2kd positive cells (r2 = 0.6630, p = .0004). In contrast, correlations were not found between RI% and the viability or yield of Hu-Liver cells. These results indicated that while the viability and yield of the prepared liver cells depend on the technical success or failure of liver perfusion, the purity of the HLA-positive cells is completely dependent on the chimeric ratio of the Hu-Liver mice. To prepare high-quality human hepatocytes from Hu-Liver mice, researchers should isolate liver cells with the two-step collagenase perfusion method from highly chimeric TK-NOG humanised liver mice. In Hu-Liver mice with chimeric ratios over 95%, the averaged ratio of HLA-positive cells, H-2kd-positive cells, viability and yield were 93.0% ± 4.0%, 5.4% ± 3.3%, 84.2% ± 7.7% and 6.9 ± 5.8 × 10⁷ cells (0.9–16.4 × 10⁷ cells), respectively, without any treatment to remove the mouse liver cells. With the uPA/SCID chimeric mouse model, Yamasaki et al. succeeded in reducing the amount of mouse hepatocytes contained in crude isolated liver cells from ∼17% to ∼3% using anti-mouse hepatocyte cell surface antigen antibody (Yamasaki et al., Citation2010). Tateno et al. reported that GPT (former name for ALT) activity in the uPA/SCID chimeric mouse model was 154 ± 106 U/L (Tateno et al., Citation2004). The ALT activities in the TK-NOG mouse model (343 ± 138 U/L) were much higher than those in the uPA/SCID model. In the TK-NOG mice model, relatively high ALT activity was observed in highly chimeric Hu-Liver mice, indicating that mouse hepatocytes may be more fragile than human hepatocytes. Both models showed no correlation between ALT activity and RI%. While high ALT activity was a necessary condition for engrafting transplanted human hepatocytes, we think it was not by itself sufficient. Dead mouse hepatocytes can be easily removed by Percoll density gradient centrifugation. Typical images of monolayer cultures of Hu-Liver cells resemble those of human hepatocytes and include cobblestone morphology and bi-nucleated cells (). CYP3A4 expression levels in the Hu-Liver cells and cryopreserved human hepatocytes were dramatically decreased after plating in a time-dependent manner (). Similarly, a culture time-dependent decrease in CYP3A4 expression was observed in fresh human primary hepatocytes (Bowen et al., Citation2000) and uPA/SCID chimeric mice hepatocytes (Nishimura et al., Citation2005). Secretion of human albumin into the culture media was observed to range between 144 and 234 ng/2.5 × 105 cells/24 h in Hu-Liver cells (lots A1, A2, A3, B1 and C1). Human albumin secretion levels in Hu-Liver cells (181 ± 35 ng/2.5 × 105 cells/24 h) were of the same order of magnitude as those secreted by donor A cryopreserved human hepatocytes (171 ng/2.5 × 105 cells/24 h). The ratios of HLA-positive cells to the total number of Hu-Liver cells correlated with the replacement index (RI) values, which were estimated based on the human serum albumin levels in the Hu-Liver mice (). High ratios of HLA-positive cells (average 93%) and high cell yields (average 6.9 × 10⁷ cells) were observed for Hu-Liver cells isolated from six Hu-Liver mice with high RI values (>95%). These results indicated that Hu-Liver mice with high RI values (>95%) should be used to prepare large amounts of high-quality Hu-Liver cells (i.e., with high ratios of HLA-positive cells and high cell yields).
Figure 1. Comparison of the morphology of human hepatocytes and Hu-Liver cells. Phase contrast images show human hepatocytes (lot A) and Hu-Liver cells prepared from a Hu-Liver mouse (A1) at 24 h after plating (scale bar =50 μm).
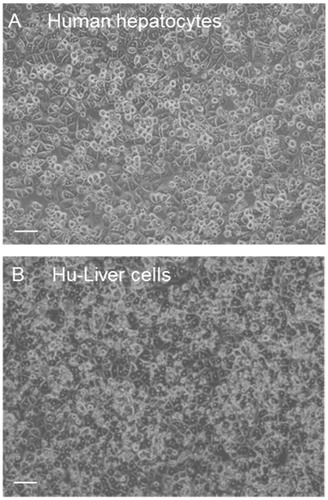
Figure 2. Change in CYP3A4 mRNA levels during week-long culture of Hu-liver cells and human hepatocytes. Data are expressed as the ratio of the CYP3A4 mRNA to GAPDH mRNA. Data represent the mean of duplicate determinations. Open circles, closed triangles, closed squares and closed diamonds show donor A human hepatocytes and Hu-liver cells A2, A3 and A1, respectively.
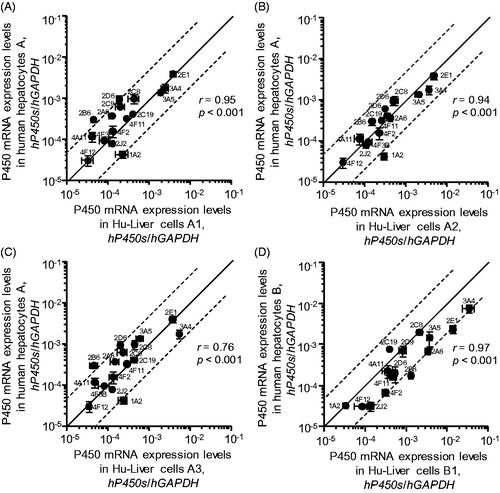
To assess the expression levels of 16 P450 genes belonging to the CYP1–4 families in Hu-Liver cells, quantitative RT-PCR was performed using human P450 gene-specific primers. The mRNA expression levels of the 16 P450s in Hu-Liver cells correlated well with those in the transplantation donor hepatocytes (r > 0.76, p < .001) in two different lots of cryopreserved human hepatocytes and derivative Hu-Liver cells (). Variations in individual P450 mRNA levels between human hepatocytes and Hu-Liver cells ranged within five-fold for most P450s (CYP2A6, CYP2C8, CYP2C9, CYP2C19, CYP2D6, CYP2J2, CYP3A4, CYP3A5, CYP4A11, CYP4F2, CYP4F3B, CYP4F11 and CYP4F12), but the expression levels of CYP1A2 mRNA were ∼40-fold higher in all Hu-Liver cells compared with human hepatocytes. A previous report on another chimeric mice model similarly observed that CYP1A2 mRNA expression in cryopreserved human hepatocytes isolated from the uPA+/+/SCID chimeric mice model was 3.9- to 13.4-fold higher than in primary human hepatocytes (Yoshitsugu et al., Citation2006). Our results indicated that the expression profiles of P450 mRNAs in the Hu-Liver cells were similar to those of human hepatocytes.
Figure 3. Correlation of human P450 mRNA expression levels in human hepatocytes with those in Hu-Liver cells. The expression levels of human CYP1A2, CYP2A6, CYP2B6, CYP2C8, CYP2C9, CYP2C19, CYP2D6, CYP2E1, CYP2J2, CYP3A4, CYP3A5, CYP4A11, CYP4F2, CYP4F3B, CYP4F11 and CYP4F12 mRNAs in human hepatocytes and Hu-Liver cells after culture incubation for 48 hours are shown on the y axis and x axis, respectively. P450 mRNA expression levels showed significant correlation (p < .001) between human hepatocytes and Hu-Liver cells. Data represent the mean ± standard deviation of triplicate determinations. The solid line passing through the origin represents unity and the dashed lines represent five-fold differences above and below unity.
For induction analysis of the CYP1A2, CYP2B6, CYP2C8, CYP2C9, CYP2C19 and CYP3A4 mRNAs, seven lots of Hu-Liver cells from three different lots of cryopreserved human hepatocyte-transplanted Hu-Liver mice were cultured and treated with omeprazole and β-naphthoflavone (CYP1A2) or rifampicin and phenobarbital (CYP2B6, CYP2C8, CYP2C9, CYP2C19 and CYP3A4) for 48 h. The cells were also treated with 0.1% DMSO as a control. A comparison between the control and inducer-treated Hu-Liver cells revealed the induction (>2.0-fold) of CYP3A4 and CYP1A2 mRNAs by these inducers in all lots of Hu-Liver cells, similar to human hepatocytes ( and ). The induction (>2.0-fold) of CYP2B6 mRNA by phenobarbital (∼5.6-fold) and rifampicin (∼2.9-fold) was observed in only two and three lots of Hu-Liver cells, respectively, which might have been due to the low inducibility of CYP2B6 mRNA by phenobarbital and rifampicin in these two particular lots of human hepatocytes. Indeed, induction levels of CYP1A2, CYP2B6 and CYP3A4 mRNAs in eight lots of human hepatocytes were previously observed to vary by lot: CYP1A2 mRNA induction by omeprazole (8.1- to 34-fold), CYP2B6 mRNA induction by phenobarbital (4.4- to 20-fold) and CYP3A4 mRNA induction by rifampicin (3.1- to 33-fold) (Yajima et al., Citation2014). In addition, the mean ± SD of the P450 fold induction values for Hu-liver cells (n = 4) from donor A were approximately consistent (within 1.6-fold) with those of donor human hepatocytes, but some ranges of P450 fold induction values were large: CYP3A4, 6.7 ± 2.4-fold and 6.8 ± 4.6-fold by rifampicin and phenobarbital, respectively; CYP1A2, 15.1 ± 13.6-fold and 15.9 ± 15.8-fold by omeprazole and β-naphthoflavone, respectively; CYP2B6, 1.6 ± 0.2-fold and 1.9 ± 0.4-fold by phenobarbital and rifampicin, respectively. Our results indicated that the inducibility of the CYP1A2, CYP2B6 and CYP3A4 mRNAs in Hu-Liver cells was roughly comparable to that in donor human hepatocytes.
Figure 4. Induction of human CYP1A2, CYP2B6, CYP2C8, CYP2C9, CYP2C19 and CYP3A4 mRNAs in human hepatocytes and Hu-Liver cells by typical human P450 inducers. Induction of human CYP1A2 (A), CYP2B6 (B), CYP2C8 (C), CYP2C9 (D), CYP2C19 (E) and CYP3A4 (F) mRNAs in human hepatocytes and Hu-Liver cells by typical human P450 inducers: omeprazole, CYP1A2; phenobarbital, CYP2B6, CYP2C8, CYP2C9 and CYP2C19; rifampicin, CYP3A4. Each human P450 mRNA level was normalised to the human GAPDH mRNA level. Data represent the mean values of duplicate determinations. Open and closed bars show data for control samples and inducer-treated samples, respectively.
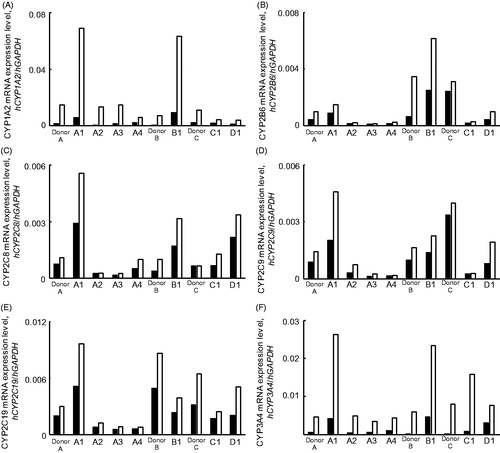
Table 2. Fold induction of human CYP1A2, CYP2B6, CYP2C8, CYP2C9, CYP2C19 and CYP3A4 mRNAs in three lots of human hepatocytes and seven lots of Hu-Liver cells.
Although induction (>2.0-fold) of CYP3A4 mRNA by phenobarbital and rifampicin was observed in all lots of Hu-Liver cells, CYP2C9 and CYP2C19 mRNAs, but not CYP2C8 mRNA, were induced (>2.0-fold) by rifampicin in only three lots and one lot of Hu-Liver cells, respectively. It was previously reported that the mRNA induction levels of CYP2C8, CYP2C9 and to a lesser extent, CYP2C19, resulting from rifampicin and phenobarbital treatment of primary human hepatocytes, were lower than that of CYP3A4 (Gerbal-Chaloin et al., Citation2001). However, another study reported that the CYP2C8 mRNA induction level was comparable to that of CYP3A4 mRNA (>10-fold compared with the control) (Raucy et al., Citation2002). Yet another study using eight lots of human hepatocytes, reported that CYP2C8 and CYP2C9 mRNAs were not induced in five and two hepatocyte lots, respectively, and that CYP2C19 mRNA was not induced by rifampicin in any of the eight human hepatocyte lots (Yajima et al., Citation2014). In addition, the mean ± SD values of P450 fold induction values for Hu-liver cells (n = 4) from donor A were similar to those of human hepatocytes: CYP2C8, 1.6 ± 0.4-fold and 1.7 ± 0.3-fold by phenobarbital and rifampicin, respectively; CYP2C9, 2.0 ± 0.5-fold and 1.5 ± 0.2-fold by phenobarbital and rifampicin, respectively; CYP2C19, 1.6 ± 0.2-fold and 1.4 ± 0.2-fold by phenobarbital and rifampicin, respectively. Although the induction of the CYP2C mRNAs varied by lot of Hu-Liver cells, overall the inducibility of human CYP2C mRNAs in Hu-Liver cells was comparable to that of donor human hepatocytes.
CYP3A4 and CYP1A2 mRNAs were induced in all four lots of Hu-Liver cells from the same donor hepatocytes used to engraft the mice (lots A1, A2, A3 and A4) by rifampicin/phenobarbital and omeprazole/β-naphthoflavone, respectively, but the extent of CYP3A4 and CYP1A2 mRNA induction varied substantially: CYP3A4, 6.7 ± 2.4-fold and 6.8 ± 4.6-fold by rifampicin and phenobarbital, respectively; CYP1A2, 15.1 ± 13.6-fold and 15.9 ± 15.8-fold by omeprazole and β-naphthoflavone, respectively ( and ). The fold induction values of CYP3A4 mRNA levels by rifampicin/phenobarbital were much greater (>7-fold) in the donor B human hepatocytes than in the donor B Hu-Liver cells. The exact mechanism underlying the variation in the extent of P450 mRNA induction in Hu-Liver cells from the same donor human hepatocytes is currently unknown. We speculated that the ratio of HLA-positive cells might have affected certain factors involved in the P450 induction response. Considering that the extent of P450 mRNA induction in lots A4 and B1 of the Hu-Liver cells showed lower ratios of HLA-positive cells that were not comparable to those in donor human hepatocytes, it is likely that a high ratio of human HLA-positive cells among the Hu-Liver cells may be important in determining P450 induction potential in these cells.
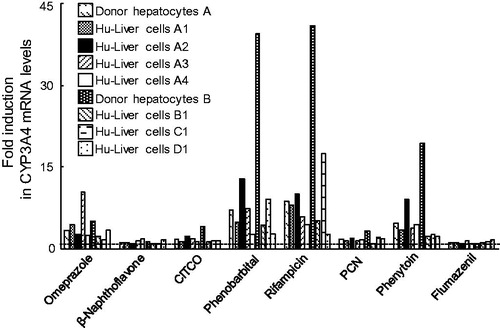
Analysis of CYP3A4 mRNA induction using eight chemicals (omeprazole, β-naphthoflavone, CITCO, phenobarbital, rifampicin, pregnenolone 16α-carbonitrile, phenytoin and flumazenil) indicated that CYP3A4 mRNA was induced (>2.0-fold) by rifampicin, phenobarbital and phenytoin in Hu-Liver cells, similar to human hepatocytes (>4.8-fold) (). Induction (>2.0-fold) of CYP3A4 mRNA by omeprazole, CITCO and pregnenolone 16α-carbonitrile was observed in five, one and one lot of Hu-Liver cells, respectively, and induction (>2.0-fold) by each of these chemicals was also observed in at least one human hepatocyte lot. Induction (>2.0-fold) of CYP3A4 mRNA by β-naphthoflavone and flumazenil (negative control) was not observed in Hu-Liver cells or in human hepatocytes. Interestingly, there are species-based differences in ligand recognition by pregnane X receptor (PXR) between rodents and humans (Liddle and Goodwin Citation2002; Watkins et al., Citation2001). Rifampicin is a potent and selective human PXR activator, whereas pregnenolone 16α-carbonitrile is a more potent activator of rat and mouse PXR than of human PXR (Kocarek et al., Citation1995). CYP3A4 mRNA was substantially induced (>2.0-fold) by rifampicin in all seven lots of Hu-Liver cells, compared with the low inducibility of CYP3A4 by pregnenolone 16α-carbonitrile in the same lots of Hu-Liver cells at the same inducer concentration, similar to the results observed for human hepatocytes (). Induction (>2.0-fold) of CYP3A4 mRNA by rifampicin, phenobarbital, phenytoin and omeprazole in Hu-Liver cells was also consistent with responses reported previously (Luo et al., Citation2002).
Figure 5. Expression levels of CYP3A4 mRNA in human hepatocytes and Hu-Liver cells treated with eight chemical inducers. Human hepatocytes and Hu-Liver cells were treated with omeprazole (50 μM), β-naphthoflavone (50 μM), CITCO (1 μM), phenobarbital (1000 μM), rifampicin (10 μM), pregnenolone 16α-carbonitrile (PCN) (10 μM), phenytoin (250 μM) and flumazenil (50 μM) for 48 h. Flumazenil was used as a negative control for CYP3A4 mRNA induction (Ramachandran et al., Citation2015). Data represent the mean of duplicate determinations. The dashed line represents data (one-fold) from the control sample (0.1% DMSO).
Dose–response data from CYP3A4 mRNA induction by rifampicin in Hu-Liver cells from the same donor human hepatocytes (lots A1, A2 and A3) were fitted using a three-parameter Hill sigmoidal model to determine the EC50 and Emax values. Rifampicin-mediated CYP3A4 mRNA induction response was reproducible in three lots of Hu-Liver cells, with EC50 values of 2.3 ± 1.5 μM and Emax values of 8.8 ± 1.8-fold, roughly comparable to those of human hepatocytes (EC50, 1.1 ± 0.4 μM; Emax, 6.0 ± 1.0-fold) ( and ), although the magnitude of CYP3A4 induction response varied according to the lot used. These parameters of rifampicin-mediated CYP3A4 mRNA induction in Hu-Liver cells were consistent with reported values (EC50, 1.0 ± 0.9 μM; Emax, 57 ± 44-fold) using six lots of human hepatocytes (Vermet et al., Citation2016) and another study with reported values (EC50, 0.12–1.4 μM; Emax, 7.3–16-fold) using three lots of human hepatocytes (Zhang et al., Citation2014). To investigate the induction of CYP3A enzyme activity by rifampicin, testosterone 6β-hydroxylation activities in donor human hepatocytes and derivative Hu-Liver cells were measured after exposure to rifampicin. A comparison of enzyme activities between basal (0.1% DMSO-treated) and 20 μM rifampicin-treated hepatocyte lots showed that CYP3A enzyme activities were significantly increased (3.5 ± 0.7-fold) by rifampicin in Hu-Liver cells, comparable to those in human hepatocytes (>2.0-fold) (). In rifampicin-exposure experiments using human hepatocytes A and Hu-Liver cells A1, A2 and A3, the fold induction values for the testosterone 6β-hydroxylation activities were not consistent with the results from the fold induction values for CYP3A4 mRNA levels ( and ). Although the causal factors for this inconsistency would be unknown in the present study, this phenomenon might come from contribution of basal CYP3A5 enzyme activities involved in fold induction values for testosterone 6β-hydroxylation activities, apparent loss of primary hydroxytestosterone by secondary conjugations and possible post-transcriptional regulation of CYP3A4 by micro-RNAs including miRNA 27 b (Pan et al., Citation2009), through either initiation of mRNA degradation or translational repression. The transcript of mouse Cyp3a11, a major mouse hepatic CYP3A form, was not induced (<2.0-fold) in TK-NOG mouse hepatocytes by exposure to rifampicin at 10 μM (data not shown). These results indicated that CYP3A4 induction potency in Hu-Liver cells was comparable to that of human hepatocytes.
Figure 6. Dose–response curves of CYP3A4 mRNA expression in human hepatocytes and Hu-Liver cells when treated with rifampicin. Expression levels of CYP3A4 mRNA were determined in human hepatocytes of lot A (open circles) and Hu-Liver cell lots A1 (closed circles), A2 (closed triangles) and A4 (closed diamonds) treated with rifampicin concentrations between 0.28 and 50 μM. Solid and dashed lines represent curve-fitting of the data for the human hepatocytes and Hu-Liver cells, respectively. Data represent the mean of duplicate determinations.
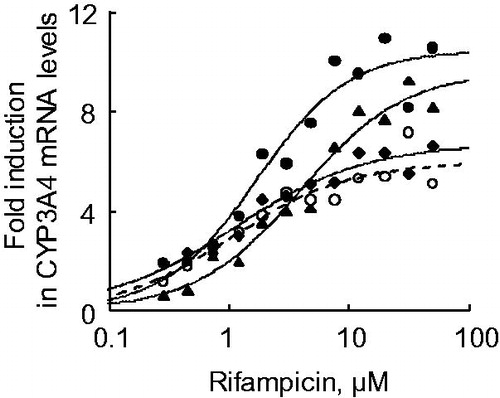
Figure 7. Testosterone 6β-hydroxylation activities in human hepatocytes and Hu-Liver cells treated with rifampicin. Filled and open squares indicate basal (0.1% DMSO-treated) and 20 μM rifampicin-treated hepatocyte lots, respectively. The fold induction in testosterone 6β-hydroxylation activities in human hepatocytes lot A and Hu-Liver cells lots A1, A2 and A3 was 2.5, 2.7, 4.1 and 3.7, respectively. *p < .05; **p < .01; ***p < .001. Data represent the mean ± standard deviation of triplicate determinations.
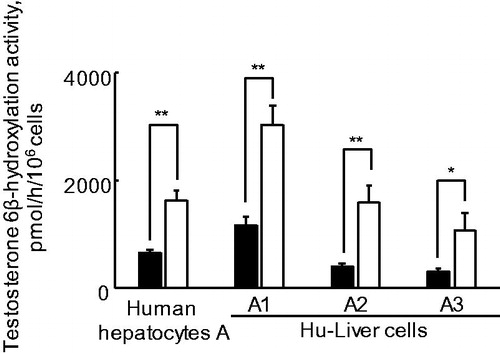
Table 3. EC50 and Emax values for the induction of CYP3A4 mRNA by rifampicin in human hepatocytes and Hu-Liver cells.
In conclusion, Hu-Liver cells have characteristics similar to those of human hepatocytes in terms of typical hepatocyte morphology, P450 mRNA expression levels and induction potential. Hu-Liver cells from TK-NOG chimeric mice can potentially offer significant advantages for in vitro studies over standard cryopreserved human hepatocytes because they allow long-term use of hepatocytes from the same donor by maintaining their drug metabolising enzyme and transporter activities and the ability to respond to prototypical P450 inducers. Further analysis is required to investigate the variable induction responses observed with Hu-Liver cells from the same donor. High quality Hu-Liver cells from Hu-Liver chimeric mice exhibited a high replacement index (>95%), a high ratio of HLA-positive cells, and P450 induction potencies comparable to those of donor human hepatocytes. Considering the on-demand availability of Hu-Liver cells from the same donor hepatocytes, these results suggest that Hu-Liver cells can potentially be used for in vitro induction assays of human hepatic P450s.
Acknowledgements
The authors acknowledge the technical expertise of Ms Minako Sakai, Mr Hiroaki Kato and Mr Yasuhiko Ando and the helpful advice of Dr Mamoru Ito, Dr Yasuyuki Ohnishi and Dr Hidetaka Kamimura. We thank Natasha Beeton-Kempen, PhD, from Edanz Group (http://www.edanzediting.com/ac) for editing a draft of this manuscript and helping to draft the abstract.
Disclosure statement
No potential conflict of interest was reported by the authors.
Additional information
Funding
References
- Azuma H, Paulk N, Ranade A, et al. (2007). Robust expansion of human hepatocytes in Fah–/–/Rag2–/–/Il2rg–/– mice. Nat Biotechnol 25:903–10.
- Bowen WP, Carey JE, Miah A, et al. (2000). Measurement of cytochrome P450 gene induction in human hepatocytes using quantitative real-time reverse transcriptase-polymerase chain reaction. Drug Metab Dispos 28:781–8.
- Foster JR, Lund G, Sapelnikova S, et al. (2014). Chimeric rodents with humanized liver: bridging the preclinical/clinical trial gap in ADME/toxicity studies. Xenobiotica 44:109–22.
- Gerbal-Chaloin S, Pascussi JM, Pichard-Garcia L, et al. (2001). Induction of CYP2C genes in human hepatocytes in primary culture. Drug Metab Dispos 29:242–51.
- Guengerich FP. (2006). Cytochrome P450s and other enzymes in drug metabolism and toxicity. AAPS J 8:E101–11.
- Hasegawa M, Kawai K, Mitsui T, et al. (2011). The reconstituted 'humanized liver' in TK-NOG mice is mature and functional. Biochem Biophys Res Commun 405:405–10.
- Higuchi Y, Kawai K, Kanaki T, et al. (2016). Functional polymer-dependent 3D culture accelerates the differentiation of HepaRG cells into mature hepatocytes. Hepatol Res 46:1045–57.
- Kakuni M, Yamasaki C, Tachibana A, et al. (2013). Chimeric mice with humanized livers: a unique tool for in vivo and in vitro enzyme induction studies. Int J Mol Sci 15:58–74.
- Kamimura H, Ito S. (2016). Assessment of chimeric mice with humanized livers in new drug development: generation of pharmacokinetics, metabolism and toxicity data for selecting the final candidate compound. Xenobiotica 46:557–69.
- Kamimura H, Ito S, Chijiwa H, et al. (2017). Simulation of human plasma concentration-time profiles of the partial glucokinase activator PF-04937319 and its disproportionate N-demethylated metabolite using humanized chimeric mice and semi-physiological pharmacokinetic modeling. Xenobiotica 47:382–93.
- Kamimura H, Ito S, Nozawa K, et al. (2015). Formation of the accumulative human metabolite and human-specific glutathione conjugate of diclofenac in TK-NOG chimeric mice with humanized livers. Drug Metab Dispos 43:309–16.
- Katoh M, Matsui T, Nakajima M, et al. (2004). Expression of human cytochromes P450 in chimeric mice with humanized liver. Drug Metab Dispos 32:1402–10.
- Katoh M, Matsui T, Nakajima M, et al. (2005). In vivo induction of human cytochrome P450 enzymes expressed in chimeric mice with humanized liver. Drug Metab Dispos 33:754–63.
- Kocarek TA, Schuetz EG, Strom SC, et al. (1995). Comparative analysis of cytochrome P4503A induction in primary cultures of rat, rabbit, and human hepatocytes. Drug Metab Dispos 23:415–21.
- Liddle C, Goodwin B. (2002). Regulation of hepatic drug metabolism: role of the nuclear receptors PXR and CAR. Semin Liver Dis 22:115. 22.
- Luo G, Cunningham M, Kim S, et al. (2002). CYP3A4 induction by drugs: correlation between a pregnane X receptor reporter gene assay and CYP3A4 expression in human hepatocytes. Drug Metab Dispos. 30:795–804.
- Mercer DF, Schiller DE, Elliott JF, et al. (2001). Hepatitis C virus replication in mice with chimeric human livers. Nat Med. 7:927–33.
- Nishimura M, Narimatsu S, Naito S. (2009). Evaluation of induction potency of new drug candidates on CYP1A2 and CYP3A4 using real-time one-step RT-PCR in primary cultures of cryopreserved human hepatocytes. Drug Metab Pharmacokinet 24:446–50.
- Nishimura M, Yokoi T, Tateno C, et al. (2005). Induction of human CYP1A2 and CYP3A4 in primary culture of hepatocytes from chimeric mice with humanized liver. Drug Metab Pharmacokinet 20:121–6.
- Nishiyama S, Suemizu H, Shibata N, et al. (2015). Simulation of human plasma concentrations of thalidomide and primary 5-hydroxylated metabolites explored with pharmacokinetic data in humanized TK-NOG mice. Chem Res Toxicol 28:2088–90.
- Pan YZ, Gao W, Yu AM. (2009). MicroRNAs regulate CYP3A4 expression via direct and indirect targeting. Drug Metab Dispos 37:2112–17.
- Ramachandran SD, Vivares A, Klieber S, et al. (2015). Applicability of second-generation upcyte® human hepatocytes for use in CYP inhibition and induction studies. Pharmacol Res Perspect 3:e00161.
- Raucy JL, Mueller L, Duan K, et al. (2002). Expression and induction of CYP2C P450 enzymes in primary cultures of human hepatocytes. J Pharmacol Exp Ther 302:475–82.
- Sanoh S, Ohta S. (2014). Chimeric mice transplanted with human hepatocytes as a model for prediction of human drug metabolism and pharmacokinetics. Biopharm Drug Dispos 35:71–86.
- Seglen PO. (1976). Preparation of isolated rat liver cells. Methods Cell Biol 13:29–83.
- Suemizu H, Kawai K, Murayama N, et al. (2018). Chimeric mice with humanized liver as a model for testing organophosphate and carbamate pesticide exposure. Pest Manag Sci 74:1424–30.
- Tateno C, Yoshizane Y, Saito N, et al. (2004). Near completely humanized liver in mice shows human-type metabolic responses to drugs. Am J Pathol 165:901–12.
- Utoh M, Suemizu H, Mitsui M, et al. (2016). Human plasma concentrations of cytochrome P450 probe cocktails extrapolated from pharmacokinetics in mice transplanted with human hepatocytes and from pharmacokinetics in common marmosets using physiologically based pharmacokinetic modeling. Xenobiotica 46:1049–55.
- Vermet H, Raoust N, Ngo R, et al. (2016). Evaluation of normalization methods to predict CYP3A4 induction in six fully characterized cryopreserved human hepatocyte preparations and HepaRG cells. Drug Metab Dispos 44:50–60.
- Watkins RE, Wisely GB, Moore LB, et al. (2001). The human nuclear xenobiotic receptor PXR: structural determinants of directed promiscuity. Science 292:2329–33.
- Yajima K, Uno Y, Murayama N, et al. (2014). Evaluation of 23 lots of commercially available cryopreserved hepatocytes for induction assays of human cytochromes P450. Drug Metab Dispos 42:867–71.
- Yamasaki C, Kataoka M, Kato Y, et al. (2010). In vitro evaluation of cytochrome P450 and glucuronidation activities in hepatocytes isolated from liver-humanized mice. Drug Metab Pharmacokinet 25:539–50.
- Yoshitsugu H, Nishimura M, Tateno C, et al. (2006). Evaluation of human CYP1A2 and CYP3A4 mRNA expression in hepatocytes from chimeric mice with humanized liver. Drug Metab Pharmacokinet 21:465–74.
- Zhang JG, Ho T, Callendrello AL, et al. (2014). Evaluation of calibration curve-based approaches to predict clinical inducers and noninducers of CYP3A4 with plated human hepatocytes. Drug Metab Dispos 42:1379–91.