
ABSTRACT
“Map overestimation,” or “the contemporaneity problem,” derives from the assumption that settlements identified during surface surveys were occupied throughout individual periods. Inductive and simulation analysis have been used to ascertain the degree of contemporaneity in surface survey data sets, as variation in settlement location is critical for understanding population density and demography, which inform social, economic and political interpretations. This paper revisits the inductive approach to interrogating survey data developed by W. M. Sumner and the simulation model approach developed by R. E. Dewar to explore the survey data from two regions within South Asia’s Indus civilization. This analysis demonstrates the strengths and weaknesses of these approaches. It also highlights the variability in settlement systems in different areas within the Indus civilization and shows that consideration of stability and instability within settlement systems is an important factor when considering dynamics of resilience and sustainability.
Introduction
Archaeological prospection is fundamental to the reconstruction of ancient and more recent landscapes and encompasses methods including aerial image and historic map analysis, remote sensing, data integration, and a range of more or less intrusive surface and sub-surface surveying (Banning Citation2002; Wilkinson Citation2003; Carver Citation2009, 63–112; Lawrence Citation2012; Tapete Citation2018; Green and Petrie Citation2018; Petrie et al. Citation2019). Each aspect of prospection has distinct limitations, and it has long been recognized that chronological resolution is one of the fundamental challenges for surface survey methods, particularly the degree to which it is possible to ascertain which features and sites were contemporaneous (e.g., Adams Citation1965, 124; Plog Citation1974; Schacht Citation1984; Chapman Citation1999). Establishing contemporaneity is critical for assessing synchronic and diachronic variation in settlement location, which is important for assessing population density and demography. All of these factors inform and constrain social, economic, and political interpretations. An important aspect of the interpretation of settlement survey data that is not always considered is the degree to which evidence for contemporaneity informs consideration of stability and instability within settlement systems.
Due to the lack of contextual information, survey data is typically less chronologically precise than excavation data. In some regions of the world, however, styles of material culture changed quickly in the past and have been sufficiently well-studied to enable the attribution of occupation phases at sites identified during surface survey to relatively short periods, in particular cases to spans of one century or less (e.g., Roman Italy [Verreyke and Vermeulen Citation2009] and Minoan Crete [Whitelaw Citation2012]). It is far more common, however, for chronological resolution to be less precise, and material collected might only be attributable to periods that extend for up to five (or more) centuries (e.g., the Near East [Adams Citation1981; Sumner Citation1994; Wilkinson Citation2000, Citation2003], Oaxaca Valley, Mexico [Blanton et al. Citation1982], and South Asia [Joshi, Bala, and Ram Citation1984; Mughal Citation1997; Possehl Citation1999]). Attempts have been made to separate some of these longer spans into shorter blocks (e.g., 100-year intervals [Lawrence Citation2012, figs. 5.41–5.44, 6.38–6.39; Lawrence, Bradbury, and Dunford Citation2012, 355–356]), but these divisions are typically artificial. Although differentiation of shorter time spans of occupation is desirable, the nature of the evidence may mean that this is not feasible. Coarse chronological resolution can be the result of many factors, including both conservatism of material culture in the past and intensity of research in the present, but it can also mask important behavioral dynamics.
Several attempts to interpret settlement data have assumed that if material belonging to a particular period is attested on the surface of a site, then that site was occupied throughout the entire period (e.g., Plog Citation1974; Weiss Citation1977; Schacht Citation1984). There are, however, numerous examples of archaeological settlements that were not occupied for the full duration of every (five hundred year) period identified in surface assemblages. “Map overestimation” (Ammerman Citation1981, 71; Plog and Hantman Citation1990), or “the contemporaneity problem” (Schacht Citation1984), has long been recognized as an issue that produces maximal estimations of the number of sites occupied in individual periods and increases the likelihood that landscapes are “overpopulated” (e.g., Adams Citation1965, 124; see Wossink Citation2009, 49; Lawrence Citation2012, 74–76). Lawrence (Citation2012, 75) has succinctly noted that “the imprecision implicit in the lumping together of sites exhibiting broadly similar ceramic styles masks the possibility that individual sites within a phase may have been occupied at different times.” Ideally, archaeologists want to ascertain the degree to which survey data is a robust and accurate reflection of changing settlement dynamics over time, and with this aim in mind, different approaches have been used to ascertain contemporaneity of occupation within individual periods. Relatively simple inductive methods (based on reasoned probable cause) have occasionally been used to identify sub-phases of occupation within longer chronological spans, largely based on whether settlements appear to have been occupied in consecutive periods (e.g., Sumner Citation1988, Citation1990b, Citation1994). Similar parameters have also been used in more sophisticated attempts to simulate site contemporaneity using statistics (Dewar Citation1991, Citation1994; Kintigh Citation1994; Kouchoukos Citation1998; Wilkinson Citation2000; Wossink Citation2009). Even more sophisticated assessments of temporality are possible with sizable collections of radiocarbon dates (e.g., Bocquet-Appel et al. Citation2009; Timpson et al. Citation2014; Crema Citation2015; Crema et al. Citation2016), but such precision is not possible with surface survey data.
Here, inductive and simulation approaches are used to assess the levels of settlement contemporaneity over time in two regions within the broad geographical expanse occupied by the populations of South Asia’s Indus civilization: Cholistan in eastern Pakistan and the hinterland of the site of Rakhigarhi in northwestern India. The cities and settlements of the urban phase of the Indus civilization (ca. 2600/2500–1900 b.c.) were distributed across the Indus River Basin and adjacent areas in modern Pakistan and India and were contemporaneous with the late Early Dynastic, Akkadian, and Ur III periods in Mesopotamia and the Old Kingdom and First Intermediate period in Egypt (reviewed in Wright Citation2010; Petrie Citation2013, Citation2017). It has been argued that a global climate change event at ca. 4.2 kya (ca. 2200 b.c.) affected all three of these regions and disrupted Indus urbanism (e.g., Weiss Citation2017, 100), though this interpretation is likely too simplistic. The subsistence practices of rural Indus populations appear to have been adapted to the climatic, hydrological, and ecological diversity of the Indus River Basin, suggesting that they may have been resilient and sustainable in the face of such processes (e.g., Petrie et al. Citation2017). The case study regions explored here provide insight into the variation in settlement trajectories that characterize the different regions in the environmentally and culturally diverse context of the Indus River Basin. They also enable exploration of the dynamics of stability and instability in settlement systems in a context that is both variable over short time spans and changeable over longer ones. These findings have important ramifications for how we interpret Indus civilization settlement data and also for how we should assess settlement data more broadly, contemporaneity, and dynamics of stability and instability within settlement systems.
Assessing Transitions and Contemporaneity in Settlement Distribution Data
Excavations often demonstrate that long chronological periods can be divided into coherent sub-phases. However, while period-specific material culture may be distinctive, material used only in individual sub-phases is not always easy to recognize in surface assemblages. Many attempts to identify settlement contemporaneity within individual phases of extended periods have therefore been based on inference and are, of necessity, relatively unsophisticated. Researchers must rely on the data on the periods during which individual sites were occupied and make calculations based on the number of sites occupied during periods of interest. Typically, calculations are then modified based on whether sites were also occupied in the preceding, the succeeding, or both the preceding and succeeding periods.
Sumner’s Inductive Approach to Transitions in Settlement Sequences
William M. Sumner (Citation1972) carried out extensive full-coverage archaeological surveys in the Kur River Basin in Fars in the late 1960s and early 1970s, which revolutionized our understanding of the rise of early complexity and urbanism in highland southwestern Iran. In analyzing the results, he attempted to tackle a range of methodological issues originating from the desire to identify sub-phases within extended chronological periods (Sumner Citation1988, Citation1990b, Citation1994). He developed a method for identifying contemporaneous settlement that made assumptions about the nature of the occupation based on the presence or absence of material which indicate that the site was occupied in other periods (Sumner Citation1988, Citation1990b, Citation1994; also Petrie et al. Citation2009, 195).
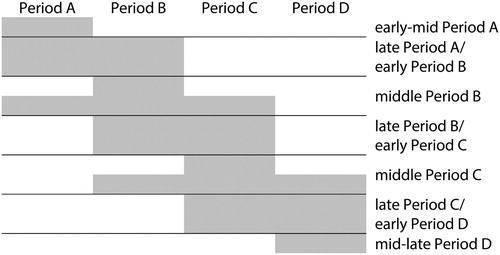
The pre-historic archaeology of the Kur River Basin is divided into periods named after sites or areas where distinctive cultural assemblages were first documented (Sumner Citation1972, Citation1990a). In order to break up the 1000-year long Bakun period (ca. 5000–4000 b.c.), Sumner (Citation1994) suggested that Early Bakun phase sites were those with evidence for occupation during the Bakun and the preceding Shamsabad period; Middle Bakun phase sites were those with only Bakun material or with Shamsabad, Bakun, and the succeeding Lapui period in evidence; and lastly, Late Bakun phase sites were those that have Bakun and Lapui period material. This approach is illustrated graphically in .
Figure 1. Schematic representation of Sumner’s (Citation1994) approach to identifying sub-phases of extended chronological periods (image C. A. Petrie).

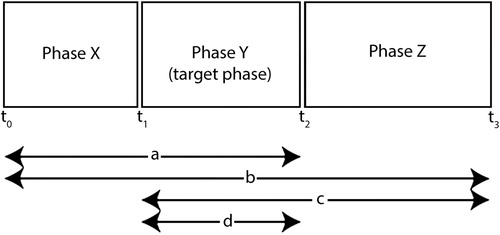
Sumner (Citation1994, 49) was wary of the limitations of his inductive approach, and noted that “the accuracy of this method of constructing contemporaneous settlement systems cannot be demonstrated without a refined ceramic chronology and large surface collections.” Although his approach appears logical when considering the sub-phases of one specific period, problems become apparent when it comes to the identification of sub-phases for occupation in the preceding (in this case, the Shamsabad) and the succeeding (Lapui) periods. For example, using these rules, the number of sites occupied in the Late Shamsabad phase should be the same as those occupied in the Early Bakun phase, as both would have evidence for Bakun and the preceding Shamsabad period occupation. This is illustrated schematically in , which shows that there is no in-built way to differentiate occupation in late Period A and early Period B. This pattern continues into each subsequent phase (e.g., late Period B = early Period C and late Period C = early Period D). Wossink (Citation2009, 49–50) has pointed out that this problem results from the assumptions about occupation during transitions between periods that are built into Sumner’s approach. The implications that this approach to survey data has for the interpretation of data sets with unusual structures are explored below.
Figure 2. Extension of Sumner’s (Citation1994) rules to sequential chronological periods (image C. A. Petrie).
Dewar Model Simulations and the Settlement Contemporaneity Conundrum
While Sumner was interrogating his Bakun period survey data, Robert E. Dewar (Citation1991, 604; Citation1994) set out to create a contemporaneity simulation model to address the assumption made by the majority of archaeological settlement distribution models that “components assigned to each phase or period” are normally “treated as contemporaneous.” He combined this doubt about levels of contemporaneity with the potential that standard archaeological settlement methods have for “double counting,” resulting from villages being abandoned and relocated within a period, and where the same group of people are responsible for the creation of new, similar-sized villages in the same area (Dewar Citation1991, 605). Dewar (Citation1991, 605) was clear that any interpretations derived from such models are open to legitimate criticism and acknowledged that he was not the first to identify these potential problems (e.g., Plog Citation1974; Schacht Citation1984), but distinguished his own approach by arguing that it allowed for single period occupations, which had been less successfully afforded by the earlier attempts. Kintigh (Citation1994) responded to Dewar’s original paper and suggested that a different approach to estimating spans of occupation should be used, but in reply, Dewar (Citation1994) noted that this would result in a conceptually different model and associated statistics and therefore advocated using his model unaltered.
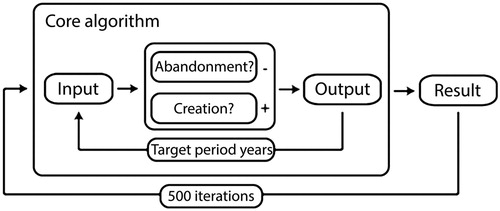
Dewar’s contemporaneity simulation model is similar to Sumner’s approach in requiring the analyst to have access to settlement data for the target period/phase itself and for the periods/phases immediately preceding and succeeding it (). This means that his model cannot be used to assess dynamics of contemporaneity in the first or last phases within a local settlement sequence, but it can be used for all intervening phases.
Figure 3. Schematic of the notation used by the Dewar model (image F. Lynam; after Dewar Citation1991, fig. 3).
Using the data from three consecutive phases, Dewar’s model calculates a mean settlement abandonment rate and an establishment rate for the target phase using Monte Carlo simulations (Dewar Citation1991, 608–609). The model takes the abandonment rate to be equal to (a + d)/p where a equates to the number of sites occupied during both the target and preceding phases, d is equal to the number of sites occupied only during the target phase, and p is the length in years of the target period. For the establishment rate, it uses (c + d)/p, where both d and p are as in the previous equation, and c is equal to the number of sites that were occupied during both the target and the succeeding periods (see ).
Dewar’s model then uses a + b to calculate the initial number of sites occupied at the start of the simulation (i.e., at t1). The core algorithm takes that input and calculates whether it should be increased and/or decreased by 1 by checking the probability of site creation and abandonment using the establishment rate and abandonment rate formulae. It then takes this output and re-enters it into the algorithm as the new input, and does this once for every p years, running the analysis an arbitrary number of times (). Although noting little change after 100 iterations, Dewar (Citation1991, 610) suggested that 500 was a reasonable number. He also argued that the most interesting aspect of the iterative running of the algorithm was the standard deviation of the result (Dewar Citation1991, 610). The range of these values represents what Dewar (Citation1991, 609) called the activity, or flux, of settlement, which was a feature that he argued more accurately represents the dynamism of settlement activity and is something that is absent from the traditional snapshot methods that he critiqued.
Figure 4. The operation of the Dewar model algorithm (image F. Lynam).
Dewar (Citation1991, 612–616) demonstrated the potential impact of his simulation model using Blanton’s 1969 survey in the Ixtapalapa region of the Basin of Mexico (Blanton Citation1972). The most significant result of Dewar’s reanalysis of this dataset was that his model estimates for simultaneous occupations for each of the periods in question were significantly lower than the total count of sites at which any material culture of that period was found (Dewar Citation1991, 612).
Dewar Model Simulation Web App: An Online Portal for Implementing the Dewar Model
In order to create a user-friendly interface for carrying out analysis using the Dewar model, one of the authors (Lynam) created an Open Access web interface using the guidelines provided by Dewar (Citation1991) (). The web authoring and some of the associated analysis presented below were carried out as part of an extended essay for the MPhil in Archaeology at the University of Cambridge in 2011.
Figure 5. Dewar Model Simulation web implementation (image F. Lynam).
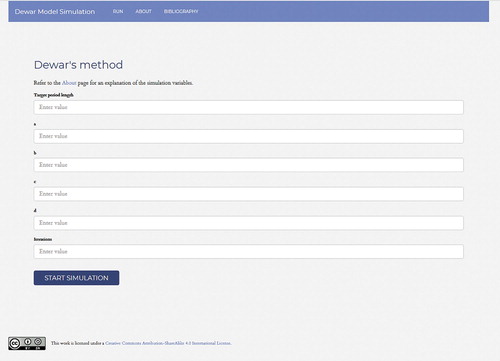
The web app is built on a standard JavaScript-HTML client stack, which means that each simulation initiated by the user is calculated by code that runs within the client’s web browser. The first version of the code base was designed to run on a server operating in the cloud because at the time web clients and their operating system hosts would have struggled to run simulations requiring in the order of 100,000 iterations. With recent advances in processing power and the availability of cheaper memory, running algorithms that involve this number of iterations can be achieved with relative ease by most modern personal computer configurations.
The web app is relatively simple in design. Its sole function is to output a single value representing the calculated simultaneous site occupancy rate alongside its accompanying standard deviation. This is calculated within the runSimulation function, which takes the target period length in years, the a, b, c, and d values as set out in the description of the Dewar model detailed above, and the number of iterations that the user wishes to run the simulation as parameters. This function effectively translates the logic illustrated in into JavaScript code and prints the result as a webpage text output. The simulation can be accessed at https://franklynam.com/dev/dewarmodel. The source code for the project is available for re-use under the Creative Commons Attribution 4.0 International license and downloadable from https://bitbucket.org/franklynamteam/dewarmodel-app.
Sumner’s induction approach and Dewar’s simulation model are both useful methods for interpreting structure within survey data sets, and they can also be used as heuristic devices for assessing the robustness of interpretations of survey data. In this latter respect particularly, Dewar’s model is clearly capable of producing provocative results that provide particular insight into the nature of settlement dynamics across long periods. It is, however, important to consider the nature and limitations of the interpretations it throws up. For instance, its simplicity means that it is not suited to modelling sophisticated scenarios, and Lawrence (Citation2012, 75) has noted that the assumption of a continuous rate of founding and abandonment over time means that Dewar’s model is not able to account for relatively extreme instances of mass abandonment or settlement. The same assessment could be made of Sumner’s inductive approach. As Wossink (Citation2009, 50) has noted, the Dewar and Sumner approaches both make use of the same parameters, but the two methods deploy this data in different ways and produce distinct results. Here, we directly compare the results generated using the Dewar and Sumner methods to interrogate survey data from two regions within South Asia’s Indus civilization. This analysis allows us to assess the implications of the types of data output by each method, which in turn makes it possible to explore and assess dynamics of settlement contemporaneity in different data sets and highlight other dynamics in settlement systems that are revealed.
Interrogating Indus Settlement Distribution Using Simulation and Induction Approaches
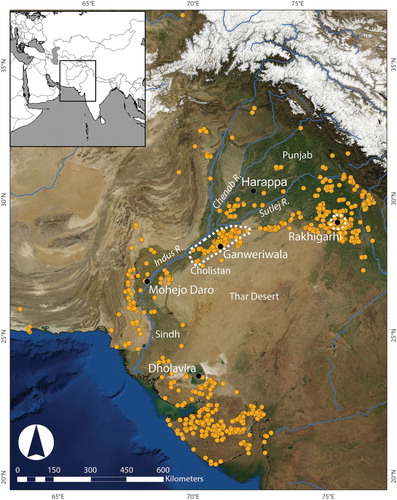
Since the 1950s, there have been a proliferation of archaeological surveys throughout different parts of the Indus River Basin in western South Asia (e.g., Chakrabarti and Saini Citation2009; Dangi Citation2009, Citation2011; Joshi, Bala, and Ram Citation1984; Kumar Citation2009; Mughal Citation1990; Parmar et al. Citation2013; Pawar, Parmar, and Sharan Citation2013; Possehl Citation1999; Sharan, Pawar, and Parmar Citation2013; Singh et al. Citation2008, Citation2010, Citation2011, Citation2018, Citation2019; Stein Citation1942; Suraj Bhan Citation1975; Suraj Bhan and Shaffer Citation1978; Wright et al. Citation2001, Citation2003). These surveys have typically been based around a village to village method that is broadly akin to full-coverage survey approaches, which attempt to survey an entire region and record all of the sites that are discovered (Green and Petrie Citation2018; cf. Sumner Citation1990b). The resulting data has had direct impact upon current interpretations of the Indus civilization (e.g., Chakrabarti Citation1995, Citation1999; Coningham and Young Citation2015; Cork Citation2011; Lal Citation1997; Kenoyer Citation1997; Possehl Citation1999, Citation2002; Wright Citation2010). Important surveys that have been carried out in Cholistan in eastern Pakistan and the area around the Indus urban site of Rakhigarhi in northwestern India will be considered here ().
Figure 6. Map showing the distribution of Indus settlements and the location and extent of the survey regions in Cholistan (at center) and the Rakhigarhi hinterland (at right; image compiled by C. A. Petrie).
Settlement Dynamics in Cholistan
Between 1974 and 1977, M. Rafique Mughal directed an extensive settlement survey of the region of Cholistan, in Punjab, Pakistan (; Mughal Citation1997; also Mughal et al. Citation1996). Today, Cholistan is a barren semi-desert zone delineated by the Thar Desert to the east, the alluvial plains of the Indus, Chenab, and Sutlej Rivers to the west and north, and Sindh province to the south (Mughal Citation1997, 20–21).
Mughal’s team mainly used random surface collection to ascertain their periods of occupation at the sites they identified (Mughal Citation1997, 27–28, 32–33). They supplemented the surface collections by sinking occasional test trenches to have a cursory look at site stratigraphy, which became particularly important for establishing the relative position of Hakra ware (Mughal Citation1997, 32–33), which was in use before the Early Harappan or Kot Diji period. Mughal (Citation1997, 32–33) proposed a date of ca. 3500–3100/3000 b.c. for Hakra ware and used conventionally accepted dates of ca. 3100/3000–2500 b.c. for the Early Harappan period, ca. 2500–2000/1900 b.c. for the Mature Harappan period, and ca. 2000/1900–1500 b.c. for the Late Harappan period, which effectively represent the pre-urban, urban, and post-urban phases in typical Indus chronologies (Possehl Citation1999, Citation2002; Wright Citation2010). None of the periods have been chronologically constrained locally. Mughal’s team paid particular attention to tracing settlement along the relict channels of the Ghaggar-Hakra River (Mughal Citation1997, 21–22), which is the subject of ongoing debate concerning its morphology, date, historical identity, and archaeological importance (e.g., Clift et al. Citation2012; Danino Citation2010; Giosan et al. Citation2012; Lal Citation2002; Saini et al. Citation2009; Singh et al. Citation2017).
Although there are numerous publications on the results of the Cholistan survey (see Mughal Citation1997), the final publication was designed to incorporate data on all of the sites found during the survey, including the site name, associated cultural assemblage(s), size of the area covered, type of site (camp site, industrial, etc.), and location (Mughal Citation1997, 139–156; Supplemental Material 1). It also included summary tables assessing site size frequency in various ways (Mughal Citation1997, tables 11–14). Additional sites in the region were published in a report on a more extensive archaeological survey of Pakistani Punjab (Mughal et al. Citation1996), and sites in Cholistan identified by Sir M. Aurel Stein (Citation1943) were included in Gregory Possehl’s (Citation1999, appendix A) collated list of sites. These publications include sites dating to all cultural periods documented in the region, but the majority of sites had occupation dated to the Hakra and the Early, Mature, and Late Harappan periods. A summary of the total site count for Cholistan, the total area of all sites, and a calculation of the average area/site per period is shown in (full details in Supplemental Material 1).
Table 1. Summary of the Cholistan survey data (compiled from Stein Citation1943; Mughal Citation1997, tables 1–10, 139–148; Mughal et al. Citation1996, appendix I; Possehl Citation1999, appendix A).
Size data on a number of sites is not presented in the publications. Specifically, two of the sites listed as containing Hakra material, one site listed as containing Early Harappan material, and three sites listed as containing Mature Harappan material have no associated site size data. If the major urban site of Ganweriwala is excluded from the Mature Harappan calculations, the average site area is 5.6 ha.
Mughal (Citation1997, 31–62, 139–148, tables 1–10) assigned periods and maximum occupation extents to the sites compiled in his catalogue and also attributed sites to typologies based on interpreted use. These categories included temporary camp sites, industrial sites, settlements with kilns, residential settlements, and cemeteries (Mughal Citation1997, 53, table 11). Mughal’s (Citation1997, 59, table 11) inclusion of a camp site category is of particular importance for our overall understanding of Indus settlement, as it showed the first indications that portions of the population engaged in pastoral and potentially nomadic lifeways, particularly during the Hakra and Late Harappan periods. The Cholistan data support the claim that there were substantial numbers of small/rural sites, but Cork (Citation2011, 172) made the prescient point that the numbers of sites may be misleading because there is no differentiation within very long chronological phases.
The settlement distribution dataset from Cholistan provides sufficient information to calculate estimated simultaneous site occupancy rates for the region during the Early, Mature, and Late Harappan periods, as they are flanked by data from both preceding and subsequent periods. The Late Harappan period is somewhat problematic, as Mughal suggests that it was followed by a hiatus of around 400 years before the emergence of the Painted Grey Ware (or PGW) period sites at the end of the second millennium b.c. (Mughal Citation1997, 35). For the purposes of this analysis, the PGW period is assumed to directly succeed the Late Harappan occupation, but, as will be seen below, the settlement data itself suggests that a specific type of displacement occurred between these two periods in Cholistan.
lists the inputs calculated using the complete Cholistan dataset, and the results of the Dewar simulation model are shown in . The calculations of settlement contemporaneity in the Early Harappan period use the following parameters: a = sites occupied in the Hakra Ware and Early Harappan periods; b = sites occupied in the Hakra Ware, Early Harappan, and Mature Harappan periods; c = sites occupied in the Early Harappan and Mature Harappan periods; and, d = sites occupied in the Early Harappan period only. The calculations of settlement contemporaneity in the Mature Harappan period use the following algorithm parameters: a = Early Harappan and Mature Harappan periods; b = Early Harappan, Mature Harappan, and Late Harappan periods; c = Mature Harappan and Late Harappan periods; and, d = Mature Harappan period only. For the calculations of settlement contemporaneity in the Late Harappan period, the algorithm parameters are as follows: a = Mature Harappan and Late Harappan periods; b = Mature Harappan, Late Harappan, and PGW periods; c = Late Harappan and PGW periods; and, d = Late Harappan period only. also includes calculations for the total occupied area and a standard deviation for each period, which should be considered with caution, as it is not clear which sites were occupied at any one time. Wossink (Citation2009, 54–55) suggests performing simulations for each site size class, but this has not been attempted here because of the limited number of sites occupied in consecutive periods. The site size statistics are included simply to provide a means of comparing data from different periods within Cholistan and to make speculative comparisons with the data from the area of Rakhigarhi.
Table 2. Dewar model input variables (after Mughal Citation1997).
Table 3. Estimates for contemporary occupation in the Cholistan region derived using the Dewar model. The average site counts and standard deviations were calculated by averaging the results of 20 individual simulations that were run through the MC calculation with 100,000 iterations.
There is a dramatic difference between the number of sites attributed to each of the Early, Mature, and Late Harappan periods () and the number of sites likely to have been occupied contemporaneously, as calculated using the Dewar model (; ). This is a product of both the logic behind the Dewar model and the specifics of the settlement data, which attest to minimal continuity of occupation between each of the three Indus periods, as highlighted by the low numbers for parameters a, b, and c shown in . For example, of the 57 sites reported as having Early Harappan material, only two also included Hakra Ware material, and three different sites contained Mature Harappan material (). No sites were occupied in all three of the Early, Mature, and Late Harappan periods, which is significant, as the rules of the Dewar model stipulate that the existence of a site for an entire period is only guaranteed if it also shows evidence of occupation in the preceding and subsequent periods (Dewar Citation1991, 608; Citation1994; see also Kintigh Citation1994). The lack of continued occupation is an important aspect of the data.
Figure 7. Comparison between Mughal’s Cholistan survey results and the outputs of the Dewar model and the Sumner estimates analysis. Site counts shown on y-axis.
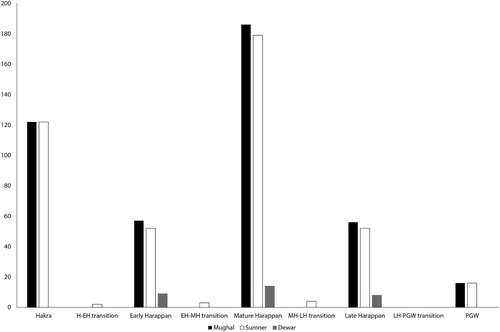
Dewar (Citation1994, 150) and Wossink (Citation2009, 51–52) both note that the Dewar model is unable to detect multiple phases of occupation within a single period, and Wossink (Citation2009, 53) argued that this creates a “floating reconstruction of contemporaneous sites.” Importantly, abandonment and resettlement within the same period has been identified at cognate settlements excavated in northwest India (Petrie et al. Citation2016). This factor is significant for the Cholistan data, as the lack of Early Harappan sites that were also occupied in the preceding and succeeding periods ensures that the model attributes the majority of the sites to only a single sub-phase within the overall Early Harappan period. The results of the analysis thus suggest that of the 57 sites that Mughal lists, fewer than ten were occupied at any one time during the Early Harappan period, with the simulation estimating the number between 2.471 and 9.249 (rounded to 2–9; 4–16%). These patterns are repeated for the Middle and Late Harappan periods. Of the 186 sites occupied in the Middle Harappan period, the simulation estimates simultaneous occupation at between 3.793 and 14.267 sites (rounded to 4–14; 2–7.5%), and of the 56 sites occupied in the Late Harappan period, the simulation estimates simultaneous occupation at between 1.825 and 8.035 sites (rounded to 2–8; 4–14%). Taken together, the output from the Dewar model for these three periods suggests that contemporaneous occupation at any point during each period was significantly lower than the total number of sites for any one period (). It is notable that the figures cited here are different to those listed by Petrie et al. (Citation2017, 13), as more sites have been added to the data set.
If we use the criteria outlined by Sumner (Citation1994) to assess the settlement dynamics of the same sites and the same periods (as per ), we again see a different pattern (), which is also distinct from the results of the Dewar analysis shown in . Sumner’s approach shows marked shifts from concentrations of occupation in the middle of each period (e.g., early-mid Hakra ware phase: 122 sites; the mid-Early Harappan phase: 52 sites; mid-Mature Harappan: 179; mid-Late Harappan: 52 sites) to minimal occupation in the transitional periods (late Hakra/early Early Harappan: 2 sites; late-Early/early Mature Harappan: 3 sites; late-Mature/early Late Harappan: 4 sites) ().
Table 4. Sumner estimates of period-wise occupation.
The ostensibly transitional sites shown in are also identified in the Dewar model parameters shown in and highlight the limited continuity of occupation between periods in Cholistan (). The Sumner approach therefore challenges the traditional interpretation in a similar way to the Dewar model, with both analyses serving to highlight underlying issues within the dataset, which will be explored further below.
Settlement Dynamics on the Plains of Northwestern India
The plains of northwest India have been subjected to archaeological surveys of varying intensity since the early 1970s (e.g., Suraj Bhan Citation1975; Suraj Bhan and Shaffer Citation1978). A reconnaissance of known sites in 2008 demonstrated that there are significant errors in the published locations, that knowledge of site distribution and density is dictated by the intensity and extent of previous surveys, and that large numbers of sites of all periods have not been recorded (Singh et al. Citation2008; Petrie et al. Citation2017). These limitations prompted two targeted surveys under the auspices of the Land, Water, and Settlement project. The first focused on settlement distribution in the hinterland of the Indus urban site of Rakhigarhi (the Rakhigarhi Hinterland Survey, or RHS [Singh et al. Citation2010]), while the second focused on the settlement distribution around the Ghaggar-Hakra paleochannel in northern Haryana and southern Punjab (the Ghaggar Hinterland Survey [Singh et al. Citation2011]). Other researchers have since carried out surveys in neighboring areas (e.g., Parmar et al. Citation2013; Pawar, Parmar, and Sharan Citation2013; Sharan, Pawar, and Parmar Citation2013). A reassessment of a sub-set of the settlement data for northwestern India has identified important patterns but also highlights ongoing problems caused by inaccuracy in site location and attribution, as well as incomplete coverage (Green and Petrie Citation2018). Surveys have also now been carried out by the TwoRains project in the areas between and around the Land, Water, and Settlement surveys (Singh et al. Citation2018, Citation2019). Here we will consider the results of the Rakhigarhi Hinterland Survey as a means of providing a contrast to the data from Cholistan ().
The Rakhigarhi Hinterland Survey data provides evidence for occupation in the Early, Mature, and Late Harappan periods, as well as the PGW period, and while it is broadly cognate with the data from Cholistan, it lacks evidence for Hakra Ware period occupation (, Supplemental Material 2; Singh et al. Citation2010). Petrie et al. (Citation2017, 14) have pointed out that there is no clear evidence for a large paleochannel on the surface in the vicinity of Rakhigarhi, but many of the sites dating to the different Indus periods are in a linear arrangement, suggesting that there may be a watercourse that is now hidden beneath the subsurface (see also Singh et al. Citation2010, 46). The survey data suggests that the area around Rakhigarhi was first occupied during the Early Harappan phase (Singh et al. Citation2010), and there is also evidence for Early Harappan occupation on at least one of the mounds at Rakhigarhi (Nath Citation1998, Citation1999, Citation2001). The expansion of Rakhigarhi into an urban center in the Mature Harappan period appears to have partly depopulated the surrounding area, including the abandonment of sites that would have lain upstream and downstream from Rakhigarhi along the putative watercourse (Singh et al. Citation2010, 46, figs. 3–4). Many sites in these areas were re-occupied in the post-urban Late Harappan period (Singh et al. Citation2010, 46). In contrast to the Cholistan data, a significant number of the Indus settlements in the hinterland of Rakhigarhi were occupied in consecutive periods. These data appear to indicate broad continuity in occupation over time from the pre-urban through urban to post-urban phases, with little change in the overall population within the hinterland of Rakhigarhi (; Petrie et al. Citation2017, 14). As for the Cholistan data, there is evidence that the major change in settlement distribution in the Rakhigarhi area appears to come with the PGW period. The alignment of sites that are oriented on Rakhigarhi in all of the Indus periods disappears, and the main concentration of settlement in the PGW period appears to shift to the southeast, where there is a complex network of modern canals (Singh et al. Citation2010, 46, fig. 6).
Table 5. Summary of the RHS survey data (Singh et al. Citation2010).
The patterns in the survey data for the hinterland of Rakhigarhi make it a useful candidate for comparison and contrast to Cholistan. Both regions have been subject to extensive survey and appear to have concentrations of settlement around an urban-scale center. However, each is environmentally distinct and situated in a different rainfall zone (Petrie Citation2017; Petrie et al. Citation2017), so each has the potential to reveal different insights into the development of Indus urbanism. It should be emphasized, however, that the area surveyed in Cholistan is much larger, so it is not appropriate to directly compare the raw numbers of sites in each region, but it is feasible to compare patterns in the data. The period-wise data from the Rakhigarhi Hinterland Survey are shown in .
The inputs for the Dewar model as calculated for the Rakhigarhi Hinterland Survey data are listed in , and the results are given in . It is not possible to produce a simulation for the Early Harappan period. The calculations of settlement contemporaneity in the Mature Harappan period use the following parameters: a = sites occupied in the Early Harappan and Mature Harappan periods; b = sites occupied in the Early Harappan, Mature Harappan, and Late Harappan periods; c = sites occupied in the Mature Harappan and Late Harappan periods; d = sites occupied in the Mature Harappan period only. The calculations of settlement contemporaneity in the Late Harappan period use the following parameters: a = Mature Harappan and Late Harappan periods; b = Mature Harappan, Late Harappan, and PGW periods; c = Late Harappan and PGW periods; d = Late Harappan period only.
Table 6. Dewar model input variables for the RHS survey (after Singh et al. Citation2010).
Table 7. Estimates for contemporary occupation in the RHS survey region derived using the Dewar model. The average site counts and standard deviations were calculated by averaging the results of 20 individual simulations that were run through the MC calculation with 100,000 iterations.
The analysis of the Rakhigarhi Hinterland Survey data using the Dewar model reveals a significantly high degree of contemporaneity of occupation at settlements during the urban Mature Harappan period, with 10.18–13.82 (rounded to 10–14) of the 17 settlements occupied at any one time (59.8–81.2%). However, the model suggests that there was a dramatic decrease in site contemporaneity during the post-urban period, with only 6.04–13.24 (rounded to 6–13) of the 33 settlements in occupation at any one time (18.3–40.1%) (). Keeping in mind the differences in the size of the area surveyed, it is notable that these summative statistics are markedly different to those for Cholistan. As for Cholistan, the figures cited here are different to those listed by Petrie et al. (Citation2017, 13), as more sites have been added to the data set.
Figure 8. Comparison between the Rakhigarhi Hinterland Survey (RHS) results and the outputs of the Dewar model and the Sumner estimates analysis. Site counts shown on y-axis.
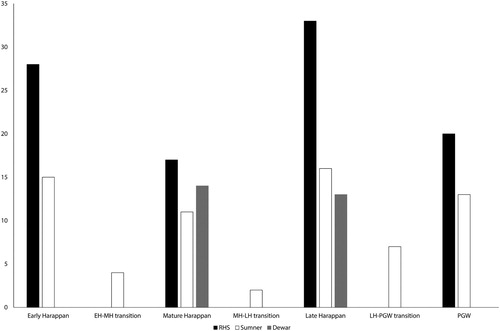
If we use the criteria outlined by Sumner (Citation1994) for the Rakhigarhi Hinterland Survey data, we see a different pattern once again. These data are summarized in . The mid-phase occupations in each period are the most abundant (early-mid Early Harappan: 15 sites; mid-Mature Harappan: 11 sites; mid-Late Harappan: 16 sites), whereas the transitional phases have fewer sites (late-Early/early Mature Harappan: 4 sites; late-Mature/early Late Harappan: 2 sites; late Late Harappan/early PGW: 7 sites) ().
Table 8. Sumner estimates of period-wise occupation for the RHS survey region.
It is notable that the number generated for the mid-Mature Harappan sub-phase () using the Sumner method is within the range of the mean simultaneous occupation generated by the Dewar model (). There is an increase in the number of sites occupied during the mid-Late Harappan period, which reflects an overall increase in the number of sites in that period. However, the Dewar model suggests that not all of these sites were occupied simultaneously within that phase, which is backed up by the Sumner analysis that suggests that only half of the 33 known sites were occupied. As with the Cholistan data, the distinctive patterns that are shown by the analyses for the Rakhigarhi Hinterland Survey data highlight underlying issues with the dataset, which will be explored further below.
Contemporaneity, Stability, and Instability in Indus Settlement Systems
The results generated by the Dewar model simulations and the Sumner inductive analysis are significant for our understanding of the Cholistan and Rakhigarhi Hinterland Survey data and have implications for the stability and instability of settlement in each context. In addition to being data from different regions, the Cholistan data set is over three times the size of the Rakhigarhi Hinterland Survey data, and the area that it encompasses is more substantial. Furthermore, the level of interpretation for the Cholistan data is considerably more developed, as the dataset has been in hand for over 40 years, while the Rakhigarhi Hinterland Survey data is still being assessed, so there are differences in the degree to which the new results impact existing interpretations.
Extant Interpretations
Based on the density of sites in the region, Possehl (Citation1997, 462; see Cork Citation2011, 185) argued that Cholistan was the most important area of settlement concentration in the Mature Harappan period. Mughal accepted his survey data at face value, and his interpretations were based on the assumption that each settlement was occupied throughout each of the periods attested in their surface material. Significantly, Mughal (Citation1997, 26; Cork Citation2011, 160) postulated that the Hakra River ceased to flow perennially sometime in the latter half of the 3rd millennium b.c., and that by the mid-2nd millennium b.c., the flow had become so minimal as to result in the devastation of the region’s viability as a zone of agricultural exploitation.
In considering settlement size, Mughal (Citation1997, 55–59, tables 13–14) proposed a four-tier hierarchy (with six categories: village [small < = 5 ha and large 5.1–10 ha], town [small 10.1–20 ha and large 20.1–30 ha], small city [30.1–40 ha], large city [> = 80 ha]) for the region, which was in keeping with prevailing approaches to settlement pattern analyses (e.g., Adams Citation1981; Flannery Citation1998; see also Chakrabarti Citation1995, 29–31, 81; Cork Citation2011, 155–192). While Mughal did not explicitly use the word “state” to describe the patterns that he observed, his discussion leaves little doubt as to his favored interpretation, where Cholistan is thus seen as an important “core centre of the Harappan culture” (Citation1997, 57). The periods preceding and succeeding the urban Mature Harappan period were seen as being either formatively or derivatively related to this central phase (Mughal Citation1997, 57–58).
Several scholars have followed Mughal’s interpretation of a four-tier division, with Wright (Citation2010, 132, 137) noting that the central place model supplemented by that of the city-state are best used to describe the distribution and structure of settlement in what she refers to as the urban Indus phase. Kenoyer (Citation1991, 351; Citation1997) has similarly referred to a four-part settlement division, with the tier one sites being greater than 50 ha in size, tier two being 10–50 ha, tier three being 5–10 ha, and the final tier four sites being less than 5 ha. Cork (Citation2011) used rank-size analysis to interrogate settlement patterns across the Indus civilization and characterized the Cholistan Early Harappan rank-size pattern as being very convex in form, indicating a structure based on independent mid-sized towns (Cork Citation2011, 185). He pointed out that, spatially, mid-sized towns in Cholistan are clustered around each other, and he suggested that this might indicate a need for advanced food redistribution systems to subsidize the needs of the urban populations (Cork Citation2011, 190). Cork (Citation2011, 191) also suggested that the proximity of these mid-sized sites might point towards a specialization of site function, as has been suggested for sites around Uruk in Mesopotamia. The pattern becomes a primo-convex curve during the Mature and Late Harappan periods, which Cork (Citation2011, 185) argued indicates one of two possible scenarios: a large primate center with some regional control or a primate system with regional control superimposed onto a system of independent mid-sized towns.
Village-sized sites increased in number and the percentage of occupied area that they comprise from the Hakra to Mature Harappan periods, while the town-sized sites decreased in both these categories during the same periods (Mughal Citation1997, 57, table 14). The exception is the site of Ganweriwala, which appears in the Mature Harappan period and at ca. 81 ha fits the role of the large first-tier urban city site, though its extent has subsequently been questioned (Kenoyer Citation2008, 188; Petrie Citation2013, 91). Mughal saw his four-tier model as being most in evidence during this Mature Harappan period, but he conceded that perhaps a three-tier system might better suit the Hakra, Early Harappan, and even the Mature Harappan periods, if the small village and large village categories were combined into a single analytical unit (Mughal Citation1997, 58). The importance of smaller settlements is suggested by the data in , which shows that the Mature Harappan period had a combined settled area of 1117.76 ha, and the average site size was 6.01 ha.
Mughal (Citation1997, 55–59, table 11) also made a specific point of identifying camp sites and sites with evidence of industrial activity and sought to explain the changing ratios of these types throughout the periods. Referring only to the data included in his 1997 publication, he noted a sharp decline in the number of camp sites with the shift to the Early Harappan (from 52.52% in the Hakra Ware period to 7.50%) and a resurgence of such sites in the Late Harappan (26%) (Mughal Citation1997, 55–59, table 11). Sites with industrial activity showed a different pattern, increasing from a minimal occurrence in the Hakra Ware period (two sites, 2.02%) to comprising the majority of sites in the Mature Harappan period (112 sites, 64.36%), where a substantial proportion are purely industrial (79 sites, 45.40%) (Mughal Citation1997, 54–55, table 11).
The data produced by the Ragkhigarhi Hinterland Survey (Singh et al. Citation2010) has been subject to far less interpretation, as it is integrated into the fabric of ongoing field research projects that continue to carry out survey in the surrounding region (e.g., Green and Petrie Citation2018; Singh et al. Citation2018, Citation2019). Building on the initial preliminary report (Singh et al. Citation2010), several observations about these data have been put forward (Petrie Citation2017; Petrie et al. Citation2017), but no detailed analysis of site size and occupied area has yet been published, and the figures included here are preliminary. Furthermore, it is not possible to discuss the presence or absence of camp/industrial sites or settlement hierarchy in a sophisticated way. However, it is possible to compare the relative figures for total and average occupied area and the way that those figures are modified by the Dewar model calculations.
The urban center of Rakhigarhi appears to have been first occupied in the Early Harappan period and increased in size during the Mature Harappan period but was depopulated and then abandoned by the start of the Late Harappan period (Nath Citation1998, Citation1999, Citation2001; Singh et al. Citation2010, table 1; Nath, Garge, and Law Citation2014; Shinde et al. Citation2013). Petrie et al. (Citation2017, 14) have noted that the Rakhigarhi Hinterland Survey data suggests that there was little change in the overall population within the hinterland of Rakhigarhi during the Indus periods and no substantial increase in the Late Harappan period, at least in this part of the plain (see ).
Petrie et al. (Citation2017, 14) have also pointed out that the pattern of settlement within the area of the Rakhigarhi Hinterland Survey contrasts to prevailing views that suggest a significant increase in settlement numbers on the plains of northwestern India during this period (Kumar Citation2009; Madella and Fuller Citation2006; Wright Citation2010, 317–318). Green and Petrie (Citation2018) have reaffirmed the likelihood that the Late Harappan period saw settlement numbers increase overall across northwestern India, suggesting that the increase occurred outside the hinterland of Rakhigarhi.
Implications of the Dewar Simulation and the Sumner Inductive Analysis
Assessing the Sumner inductive and Dewar simulation results presented here against the extant interpretations highlights the utility and limitations of both methods. While Dewar’s model helps to overcome map overestimation and the contemporaneity problem, which have the potential to skew estimates of past demography, it can only provide an estimate as to the number of contemporary sites during a set period. It cannot determine which settlements were contemporary, where they were located spatially, or what their extent might be, all of which are important criteria for settlement pattern analysis. This limitation means that any new insights will only be abstract, rather than concrete. There are similar problems with the Sumner approach, which provides a logic for identifying transitional phases but is susceptible to map overestimation because of the rules it uses for identifying mid-period occupations.
The Sumner inductive and Dewar simulation analysis data suggest that it may be misleading to assume that the large numbers of settlements recorded for each phase in Cholistan represent concentrated and dense settlement. Rather, the modeled data for contemporaneity, and the fact that there was little continuity of occupation between periods at individual settlements, suggest that Cholistan may have been characterized by an unstable settlement system with only a subset of settlements being occupied at any one time during each Indus period (Petrie et al. Citation2017, 13).
By suggesting that many of the sites in Cholistan were not occupied contemporaneously, the Dewar model results challenge Cork’s (Citation2011, 172) discussion of clustering during the Hakra and Early Harappan phases. Clusters of sites might represent the movements of the same group of people around the same region during one period (Petrie et al. Citation2017, 13). We can similarly apply this interpretation to the proliferation of camp sites, particularly where there are clusters of sites around one modern village (e.g., Khiplewal I, II, and III, which are all Hakra period sites). Although the total settled area of the 186 sites occupied in the Mature Harappan period was 1117.76 ha, with an average site size of 6.01 ha, the Dewar model suggests that only 4–14 of these sites might have been occupied simultaneously. These numbers indicate that the area contemporaneously occupied was 54.27 ha +/- 31.47 ha (see ), which is difficult to rationalize, as this was the period when the potentially ca. 81 ha site of Ganweriwala was occupied. The abstracted Dewar model data for Cholistan are clearly provocative, but also clearly must be tested on the ground through careful assessment of the surface assemblages.
Instability in the Cholistan settlement system may have been a product of various factors. An increasing number of paleoclimate proxy records from the surrounding region suggest changes in winter and summer rainfall during the mid-Holocene (e.g., Dixit, Hodell, and Petrie Citation2014; Dixit et al. Citation2014, Citation2018; Giesche et al. Citation2019). Mughal (Citation1997, 25) suggested that the flow of water in the Sutlej system previously flowed into the Ghaggar-Hakra channel, which may have become seasonal as early as the 3rd millennium b.c. and dried up altogether by the mid-2nd millennium b.c. There has been debate about the nature of water flow in the Ghaggar-Hakra hydrological system and the dates at which it changed. Remote sensing analysis has highlighted that this system was very complex (e.g., van Dijk et al. Citation2016; Orengo and Petrie Citation2017, Citation2018), and Optically-Stimulated Luminescence (OSL) dates from northwestern India suggest cessation of major river flow between ∼15–12 kya and ∼8 kya (Singh et al. Citation2017). However, other dates suggest parts of the system were active in later periods (e.g., Durcan et al. Citation2017; Saini et al. Citation2009; Saini and Mujtaba Citation2010; also Clift et al. Citation2012; Durcan Citation2012; Giosan et al. Citation2012; Maemoku et al. Citation2012). Petrie et al. (Citation2017; Petrie Citation2017) have suggested that it is possible that ephemeral flow continued as a result of the monsoon rain in the catchment, and this is demonstrated by historical floods in the early 19th century a.d. (Mughal Citation1997, 131, 134; after Punjab States Gazetteer Citation1908) and references to flood diversions on historical Survey of India maps.
Stein (Citation1942, 173, 181; Durcan Citation2012, 260; Mughal Citation1997, 26; Possehl Citation1999, 372–384) suggested that an inland delta might have been present around Fort Derawar at some time during the past. Durcan (Citation2012, 260–261) expanded this insight by drawing attention to the similarities of this potential inland delta and the operation of floodout systems, such as those described in central Australia and elsewhere by Tooth (Citation1999, Citation2005, Citation2012). In such situations, water moves from areas with confining upstream terraces and crosses an emergence point after which floodouts occur as the water spreads out and braids across a plain and dissipates (e.g., Tooth Citation2005, 638, fig. 3). A braided hydrological system would have been susceptible to the frequent avulsions during the periods of flooding that occur during monsoon rains (Petrie et al. Citation2017, 13). If the environment was as marginal as it appears, settled populations may have required strategies involving mobility between settlement locales to survive a constantly shifting hydrology. Petrie et al. (Citation2017, 13; Petrie Citation2017) have suggested that individual families or kin groups might have needed to spread their members between multiple settlements. In different years or generations, individuals or groups might have moved between settlements to access available water in times of shortage or stress.
The Sumner inductive and Dewar simulation analysis results for the Rakhigarhi Hinterland Survey region are markedly different to those for Cholistan, suggesting that there was considerable continuity of settlement between periods, which in turn indicates that there was relative stability in the settlement system within this region. This stability is emphasized by looking at the data for the total settled area in the Mature Harappan period, which is 208 ha, and the average site size of 12.24 ha (). The Dewar model results suggest that 10–14 of the 17 Mature Harappan sites might have been occupied simultaneously, which indicates that the majority of the settlements were occupied throughout the period, potentially comprising a total area of 146.9 ha +/- 22.28 ha, or 59.8–81.2% of the total. A major change appears to have occurred in the Late Harappan period, however, with only 6–13 of the 33 settlements occupied at any one time, potentially comprising only 63.1 +/- 23.58 ha, or 18.3–40.1% of the total settled area of 216 ha, being occupied at any one point. These statistics suggest a significant change within the settlement system around Rakhigarhi between the two periods, with the implication being that there was more mobility of the population during the post-urban period, which contrasts to what appears to be a stable settlement system in the Mature Harappan period. This finding is partly a product of the model and partly due to the data, as there is continuity in occupation at a number of sites between the Mature and Late Harappan periods, but less continuity of occupation between the Late Harappan and PGW period (attributes b and c in ). As noted above, the PGW period occupation shows a more substantial shift, with only seven of the sites occupied in the Late Harappan period continuing into the subsequent period, and significant numbers of new settlements appearing to the southeast of the main area of Indus period occupation (Singh et al. Citation2010, fig. 6). Remote sensing analysis has attested to the existence of a complex network of paleochannels in the area around Rakhigarhi (Orengo and Petrie Citation2017, 2018), and preliminary geomorphological analysis has suggested that this area was situated on a braided river system. The nature of this system is currently being assessed through targeted geomorphological research.
Conclusions and Implications
The differences between the settlement dynamics that operated during the Indus periods in Cholistan and the area around Rakhigarhi that have been identified here have important ramifications for the ways that each set of data can be used to inform our understanding of Indus landscapes and urbanism. Cholistan has long been regarded as a core area for Indus settlement, but the Dewar and Sumner data suggest that the region may have been characterized by an unstable settlement system requiring mobility of the population between settlements. In contrast, the area around Rakhigarhi appears to have been characterized by a more stable settlement system in the Early and Mature Harappan periods, but saw an increase in population mobility during the Late Harappan period, with further changes in the PGW period.
The suggestion that settlement in Cholistan was unstable is provocative, but, beyond what is outlined here, we currently lack the data to determine whether it is credible. It is essential to understand the rationale for why such a settlement system might have been in place, and the hydrology of Cholistan and its proximity to the Thar Desert are likely to be critical factors. The nature of monsoon rainfall and its impact upon the hydrology of the Ghaggar/Hakra river system is regarded as an important factor for explaining change in Indus settlement, and Petrie et al. (Citation2017, 12) have suggested that it may not have been perennial during the Holocene. This interpretation has implications for both settlement systems in both regions considered here.
Instability in the Cholistan settlement system may have been a product of the type of braided river system susceptible to frequent small-scale avulsions during periods of flooding that appears to have watered the region, which seems to have been distinct from the system operating around Rakhigarhi. Living in such an environment may have required settled populations to be relatively mobile, and there may have been high population mobility between settlement locales. Such practices suggest that Indus populations were adapted to a diverse environment and have implications for the sustainability and resilience of those adaptations (Petrie et al. Citation2017, 13; Petrie Citation2017). There is considerable scope for learning more about the lifeways of the people living in these settlements through future investigation of local subsistence practices and examination of the local geomorphology and hydrology. Although Rakhigarhi did not sit along the most readily visible channel in the Ghaggar/Hakra river system, there was clearly some form of channel in the area of the settlement (Orengo and Petrie Citation2017, Citation2018). The continuity of settlement from the Early to Mature and even to some degree into the Late Harappan period suggest that the hydrology of this area was relatively reliable and stable during the Indus periods, though the settlement system appears to have seen some change with the shift to the Late Harappan period and further change with the PGW period.
The reassessments of settlement dynamics and contemporaneity presented here clearly have implications for our interpretation and understanding of Indus civilization settlement systems, but also of settlement systems more generally. This analysis reaffirms the usefulness of the Dewar model simulations and the Sumner inductive analysis approaches as ways of exploring survey data in new ways, and both have the potential to extract more information from that data. Particularly, these approaches provide insight into how settlement distributions change and offer important additions to the toolkit of descriptive statistics that can be used to interrogate survey data. The approach and results presented here are in accord with similar analyses attempted by Wossink (Citation2009) and Lawrence (Citation2012). Importantly, Wossink (Citation2009) builds a specific case for the development of specialized pastoralism in northern Mesopotamia during a similar period where climate and climate change were important parameters. It may be prudent to explore further models for behavior and lifeways in Cholistan that explore the demographics of mobility of sedentary communities and the relationship between sedentary and pastoral communities operating at different levels of attachment and independence. Understanding of the dynamics of settlement systems, and particularly their stability and instability, is critical for interpreting a range of processes, particularly when it comes to human response to environmental change and assessments of resilience and sustainability.
Supplemental Material
Download Zip (66.5 KB)Acknowledgements
This paper has had an extended gestation period, following its initial development as an extended essay written by the second author while he was an MA student at the University of Cambridge in 2011, under the supervision of the first author. The scope has been substantially expanded, and incorporates the analysis of data generated by the Land, Water, and Settlement project, which was co-directed by the first author and Prof. R. N. Singh of the Department of AIHC and Archaeology at Banaras Hindu University (http://www.bhu.ac.in/aihc/). We would like to thank Prof. Singh for his long-lasting and on-going support. This paper was finalized under the aegis of the TwoRains project, which has been primarily funded by the European Research Council under the European Union's Horizon 2020 research and innovation program (grant agreement no. 648609), but has also received support from DST/UKIERI, the British Academy, and the McDonald Institute for Archaeological Research. We would like to thank Dr. Julie Durcan for drawing our attention to the literature on flood-outs and Prof. M. Rafique Mughal and Drs. Francesc Conesa, Enrico Crema, and Adam Green for their constructive comments on drafts of this paper. All errors or deficiencies remain our responsibility.
Disclosure Statement
No potential conflict of interest was reported by the author(s).
Notes on Contributors
Cameron A. Petrie (Ph.D. 2003, University of Sydney) is Reader in South Asian and Iranian Archaeology at the University of Cambridge. He has conducted research on the archaeology of India, Pakistan, and Iran, focusing on the investigation of complex societies and the relationships between humans and their environments.
Frank Lynam (Ph.D. 2015, Trinity College Dublin) has worked in the information technology and services industries. He has a range of field research and publication experience, particularly on the archaeology of Crete.
ORCID
Cameron A. Petrie http://orcid.org/0000-0002-2926-7230
Frank Lynam http://orcid.org/0000-0002-1194-0749
References
- Adams, R. M. 1965. Land behind Baghdad: a History of Settlement on the Diyala Plains. Chicago: Chicago University Press.
- Adams, R. M. 1981. Heartland of Cities: Surveys of Ancient Settlement and Land Use on the Central Floodplain of the Euphrates. Chicago: Chicago University Press.
- Ammerman, A. J. 1981. “Surveys and Archaeological Research.” Annual Review of Anthropology 10: 63–88.
- Banning, E. B. 2002. Archaeological Survey. New York: Springer, Plenum.
- Blanton, R. E. 1972. “Prehispanic Adaptation in the Ixtapalapa Region, Mexico.” Science 175 (4028): 1317–1326.
- Blanton, R. E., S. Kowalewski, G. Feinman, and J. Appel. 1982. Monte Alban’s Hinterland Part 1: The Prehispanic Settlement Patterns of the Central and Southern Parts of the Valley of Oaxaca, Mexico. Memoirs of the Museum of Anthropology 15. Ann Arbor: University of Michigan.
- Bocquet-Appel, J.-P., S. Naji, M. Vander Linden, and J. K. Kozlowski. 2009. “Detection of Diffusion and Contact Zones of Early Farming in Europe from the Space-Time Distribution of 14C Dates.” Journal of Archaeological Science 36 (3): 807–820.
- Carver, M. 2009. Archaeological Investigation. Abingdon: Routledge.
- Chakrabarti, D. K. 1995. The Archaeology of Ancient Indian Cities. Oxford, New York: Oxford University Press.
- Chakrabarti, D. K. 1999. India: an Archaeological History. Oxford, New York: Oxford University Press.
- Chakrabarti, D. K., and S. Saini. 2009. The Problem of the Saraswati River and the Archaeological Geography of Haryana and the Indian Punjab. Delhi: Aryan Books.
- Chapman, J. 1999. “Archaeological Proxy-Data for Demographic Reconstructions: Facts, Factoids or Fiction?” In Reconstructing Past Population Trends in Mediterranean Europe (3000 BC–AD 1800), edited by J. Bintliff and K. Sbonias, 65–76. The Archaeology of Mediterranean Landscapes 1. Oxford: Oxbow Books.
- Clift, P. D., A. C. Carter, L. Giosan, J. A. Durcan, G. A. T. Duller, M. G. Macklin, A. Alizai, A. R. Tabrez, M. Danish, S. VanLaningham, and D. Q. Fuller. 2012. “U-Pb Zircon Dating Evidence for a Pleistocene Sarasvati River and Capture of the Yamuna River.” Geology 40: 211–214.
- Coningham, R. A. E., and R. Young. 2015. The Archaeology of South Asia. Cambridge, New York: Cambridge University Press.
- Cork, E. 2011. Rethinking the Indus Civilization. Oxford: BAR/Archaeopress.
- Crema, E. R. 2015. “Time and Probabilistic Reasoning in Settlement Analysis.” In Mathematics in Archaeology, edited by J. A. Barcelo and I. Bogdanovic, 314–337. Boca Raton: CRC Press.
- Crema, E. R., J. Habu, K. Kobayashi, and M. Madella. 2016. “Summed Probability Distribution of 14C Dates Suggests Regional Divergences in the Population Dynamics of the Jomon Period in Eastern Japan.” PloS ONE 11 (4): e0154809.
- Dangi, V. 2009. ““Archaeology of the Ghaggar Basin: Settlement Archaeology of Meham Block, Rohtak, Haryana, India.” Linguistics, Archaeology and the Human Past Occasional Paper 8: 1–111.
- Dangi, V. 2011. “Explorations along the Ghaggar River and Sirhind Nala in Haryana and Punjab.” Man and Environment 36 (2): 66–87.
- Danino, M. 2010. The Lost River: On the Trail of the Sarasvati. Delhi: Penguin.
- Dewar, R. E. 1991. “Incorporating Variation in Occupation Span into Settlement-Pattern Analysis.” American Antiquity 56 (4): 604–620.
- Dewar, R. E. 1994. “Contending with Contemporaneity: A Reply to Kintigh.” American Antiquity 59 (1): 149–152.
- Dixit, Y., D. A. Hodell, and C. A. Petrie. 2014. “Abrupt Weakening of the Summer Monsoon in Northwest India ∼4100 Year ago.” Geology 42: 339–342.
- Dixit, Y., D. A. Hodell, R. Sinha, and C. A. Petrie. 2014. “Abrupt Weakening of the Indian Summer Monsoon at 8.2 kyr B.P.” EPSL 391: 16–23.
- Dixit, Y., D. A. Hodell, A. Giesche, S. K. Tandon, F. Gázquez, H. S. Saini, L. Skinner, S. A. I. Mujtaba, V. Pawar, R. N. Singh, and C. A. Petrie. 2018. “Intensified Indian Summer Monsoon and the Urbanization of the Indus Civilization in Northwest India.” Scientific Reports 8: 4225.
- Durcan, J. A. 2012. “Luminescence Dating of Sediments in Punjab, Pakistan: Implications for the Collapse of the Harappan Civilization.” Ph.D. diss., Aberystwyth University, Aberystwyth.
- Durcan, J. A., D. S. G. Thomas, S. Gupta, V. Pawar, R. N. Singh, and C. A. Petrie. 2017. “Holocene Landscape Dynamics in the Ghaggar-Hakra Palaeochannel Region at the Northern Edge of the Thar Desert, Northwest India.” Quaternary International (online).
- Flannery, K. V. 1998. “The ground plans of archaic states.” In Archaic States, edited by G. M. Feinman and J. Marcus, 15–57. Santa Fe, NM: SAR Press.
- Giesche, A., M. Staubwasser, C. A. Petrie, and D. A. Hodell. 2019. “Winter and Summer Monsoon Strength over the 4.2 ka BP Event in Foraminifer Isotope Records from the Indus River Delta in the Arabian Sea.” Climate of the Past 15: 73–90.
- Giosan, L., P. D. Clift, M. G. Macklin, D. Q. Fuller, S. Constantinescu, J. A. Durcan, T. Stevens, G. A. T. Duller, A. R. Tabrez, K. Gangal, R. Adhikari, A. Alizai, F. Filip, S. VanLaningham, and J. P. M. Syvitski. 2012. “Fluvial Landscapes of the Harappan Civilization.” Proceedings of the National Academy of Sciences of the United States of America 109 (26): E1688–94.
- Green, A. S., and C. A. Petrie. 2018. “Landscapes of Urbanisation and de-Urbanization: Integrating Site Location Datasets from Northwest India to Investigate Changes in the Indus Civilization’s Settlement Distribution.” Journal of Field Archaeology 43 (4): 284–299.
- Joshi, J. P., M. Bala, and J. Ram. 1984. “The Indus Civilization: a Reconsideration on the Basis of Distributional Maps.” In Frontiers of the Indus Civilization, edited by B. B. Lal and S. P. Gupta, 511–30. New Delhi: Books and Books.
- Kenoyer, J. M. 1991. “The Indus Valley Tradition of Pakistan and Western India.” Journal of World Prehistory 5 (4): 331–385.
- Kenoyer, J. M. 1997. “Early City-States in South Asia: Comparing the Harappan Phase and the Early Historic Period.” In The Archaeology of City States: Cross-Cultural Approaches, edited by D. L. Nichols, 51–70. Washington D.C.: Smithsonian Institution.
- Kenoyer, J. M. 2008. “Indus Urbanism: new perspectives in its origin and character.” In The Ancient City: New Perspectives in the Old and New World, edited by J. Marcus and J. A. Sabloff, 85–109. Santa Fe: SAR.
- Kintigh, K. W. 1994. “Contending with Contemporeneity in Settlement-Pattern Studies.” American Antiquity 59 (1): 143–148.
- Kouchoukos, N. 1998. “Landscape and Social Change in Late Prehistoric Mesopotamia.” Ph.D. diss., Yale University, New Haven.
- Kumar, M. 2009. “Harappan Settlements in the Ghaggar-Yamuna Divide.” Linguistics, Archaeology and the Human Past Occasional Paper 7: 1–75.
- Lal, B. B. 1997. The Earliest Civilization of South Asia. Delhi: Aryan.
- Lal, B. B. 2002. The Sarasvati Flows on: the Continuity of Indian Culture. Delhi: Aryan Books.
- Lawrence, D. 2012. “Early Urbanism in the Northern Fertile Crescent: A Comparison of Regional Settlement Trajectories and Millennial Landscape Change.” Ph.D. diss., Durham University, Durham.
- Lawrence, D., J. Bradbury, and R. Dunford. 2012. “Chronology, Uncertainty and GIS: a Methodology for Characterising and Understanding Landscapes of the Ancient Near East.” eTopoi: Journal for Ancient Studies Special Volume 3: 1007–1037.
- Madella, M., and D. Q. Fuller. 2006. “Palaeoecology and the Harappan Civilization of South Asia: a Reconsideration.” Quaternary Science Reviews 25 (11–12): 1283–1301.
- Maemoku, H., Y. Shitaoka, T. Natomo, and H. Yagi. 2012. “Geomorphological constraints on the Ghaggar River regime during the mature Harappan period.” In Climates, Landscapes, and Civilizations, edited by L. Giosan, D. Q. Fuller, K. Nicoll, R. K. Flad, and P. D. Clift, 97–106. Washington, DC: American Geophysical Union.
- Mughal, M. R. 1990. “The Decline of the Indus Valley Civilisation and the Late Harappan Period in the Indus Valley.” Lahore Museum Bulletin 3 (2): 1–17.
- Mughal, M. R. 1997. Ancient Cholistan, Archaeology and Architecture. Rawalpindi: Ferozsons.
- Mughal, M. R., F. Iqbal, M. A. Khan, and M. Hassan. 1996. “Archaeological Sites and Monuments in Punjab.” Pakistan Archaeology 29 (Special Number): 1–474.
- Nath, A. 1998. “Rakhigarhi: a Harappan Metropolis in the Sarasvati-Drishadvati Divide.” Puratattva 28: 39–45.
- Nath, A. 1999. “Further Excavations at Rakhigarhi.” Puratattva 29: 46–49.
- Nath, A. 2001. “Rakhigarhi: 1999-2000.” Puratattva 31: 43–45.
- Nath, A., T. Garge, and R. Law. 2014. “Defining the Economic Space of Harappan Rakhigarhi: an Interface of Local Subsistence Mechanism and Geologic Provenience Studies.” Puratattva 44: 83–100.
- Orengo, H. A., and C. A. Petrie. 2017. “Large-scale, Multi-Temporal Remote Sensing of Palaeo-River Networks: A Case Study from Northwest India and its Implications for the Indus Civilization.” Remote Sensing 9: 735.
- Orengo, H. A., and C. A. Petrie. 2018. “Multi-Scale Relief Model (MSRM): A new Algorithm for the Analysis of Subtle Topographic Change in Digital Elevation Models.” Earth Surface Processes and Landforms 43 (6): 1361–1369.
- Parmar, N., A. Sharan, V. Pawar, and V. Kumar. 2013. “Harappan Settlement System and Economic Status in the Semi Arid Zone, Bhiwani District, Haryana.” Heritage Journal of Multidisciplinary Studies in Archaeology 1: 515–538.
- Pawar, V., N. Parmar, and A. Sharan. 2013. “Harappan Civilization: Emerging Picture in Hanumangarh District, Rajasthan.” Heritage Journal of Multidisciplinary Studies in Archaeology 1: 475–485.
- Petrie, C. A. 2013. “South Asia.” In The Oxford Handbook of Cities in World History, edited by Peter Clark, 83–104. Oxford: Oxford University Press.
- Petrie, C. A. 2017. “Crisis, What Crisis? Adaptation, Resilience and Transformation in the Indus Civilization.” In Crisis to Collapse the Archaeology of Social Breakdown, edited by J. Driesin and T. Cunningham, 1–32. Louvain: AEGIS.
- Petrie, C. A., J. Bates, T. Higham, and R. N. Singh. 2016. “Feeding Ancient Cities in South Asia: Dating the Adoption of Rice, Millet and Tropical Pulses in the Indus Civilization.” Antiquity 90 (354): 1489–1504.
- Petrie, C. A., H. A. Orengo, A. S. Green, J. R. Walker, A. Garcia, F. Conesa, J. R. Knox, and R. N. Singh. 2019. “Mapping Archaeology While Mapping an Empire: Using Historical Maps to Reconstruct Settlement Landscapes in India and Pakistan.” Geosciences 9 (1): 11.
- Petrie, C. A., R. N. Singh, J. Bates, Y. Dixit, C. A. I. French, D. A. Hodell, P. J. Jones, C. Lancelotti, F. Lynam, S. Neogi, A. K. Pandey, D. Parikh, V. Pawar, D. I. Redhouse, and D. P. Singh. 2017. “Adaptation to Variable Environments, Resilience to Climate Change: Investigating Land, Water and Settlement in Indus Northwest India.” Current Anthropology 58 (1): 1–30.
- Petrie, C. A., L. R. Weeks, D. T. Potts, and K. Roustaei. 2009. “Perspectives on the Cultural Sequence of Mamasani.” In The Mamasani Archaeological Project Stage One: A Report on the First two Seasons of the ICAR – University of Sydney Joint Expedition to the Mamasani District, Fars Province, Iran, edited by D. T. Potts, K. Roustaei, C. A. Petrie, and L. R. Weeks, 169–196. Oxford: Archaeopress.
- Plog, F. T. 1974. The Study of Prehistoric Change. New York: Academic Press.
- Plog, S., and J. L. Hantman. 1990. “Chronology Construction and the Study of Prehistoric Cultural Change.” Journal of Field Archaeology 17 (4): 439–456.
- Possehl, G. L. 1997. “The Transformation of the Indus Civilization.” Journal of World Prehistory 11 (4): 425–472.
- Possehl, G. L. 1999. Indus Age: the Beginnings. Philadelphia: University of Pennsylvania Press.
- Possehl, G. L. 2002. The Indus Civilization: a Contemporary Perspective. Walnut Creek: AltaMira Press.
- Government of India. 1908. Punjab States Gazetteers, Volume XXXVI A; Bahawalpur State 1904. Lahore: Punjab Government.
- Saini, H. S., and S. A. I. Mujtaba. 2010. “Luminescence Dating of the Sediments from a Buried Channel Loop in Fatehabad Area, Haryana: Insight into Vedic Saraswati River and its Environment.” Geochronometria 37: 29–35.
- Saini, H. S., S. K. Tandon, S. A. I. Mujtaba, N. Pant, and R. Khorana. 2009. “Reconstruction of Buried Channel-floodplain Systems of the Northwestern Haryana Plains and their Relation to the ‘Vedic’ Saraswati.” Current Science 97 (11): 1634–1643.
- Schacht, R. M. 1984. “The Contemporaneity Problem.” American Antiquity 49 (4): 678–695.
- Sharan, A., V. Pawar, and N. Parmar. 2013. “An Archaeological Reconnaissance of the Proto-Historic Settlements in Mansa District, Punjab.” Heritage Journal of Multidisciplinary Studies in Archaeology 1: 500–514.
- Shinde, V., A. S. Green, N. Parmar, and P. D. Sable. 2013. “Rakhigarhi and the Harappan Civilization: Recent Work and new Challenges.” Bulletin of the Deccan College Research Institute 72/73: 43–53.
- Singh, A., K. J. Thomsen, R. Sinha, J.-P. Buylaert, A. Carter, D. F. Mark, P. J. Mason, A. L. Densmore, A. S. Murray, M. Jain, D. Paul, and S. Gupta. 2017. “Counter-intuitive Influence of Himalayan River Morphodynamics on Indus Civilization Urban Settlements.” Nature Communications 8: 1617.
- Singh, R. N., A. S. Green, L. M. Green, A. Ranjan, A. Alam, and C. A. Petrie. 2018. “Between the Hinterlands: Preliminary Results from the TwoRains Survey in Northwest India 2017.” Man and Environment 43 (2): 84–102.
- Singh, R. N., A. S. Green, A. Alam, and C. A. Petrie. 2019. “Beyond the Hinterlands: Preliminary Results from the TwoRains Survey in Northwest India 2018.” Man and Environment 44 (1): 33–51.
- Singh, R. N., C. A. Petrie, C. A. I. French, A. S. Goudie, R. Tewari, A. K. Singh, R. Sinha, S. Srivastava, S. Yadav, and V. K. Singh. 2008. “Settlements in Context: Reconnaissance in Western Uttar Pradesh and Haryana.” Man and Environment 33 (2): 71–87.
- Singh, R. N., C. A. Petrie, V. Pawar, A. K. Pandey, S. Neogi, M. Singh, A. K. Singh, D. Parikh, and C. Lancelotti. 2010. “Changing Patterns of Settlement in the Rise and Fall of Harappan Urbanism: Preliminary Report on the Rakhigarhi Hinterland Survey 2009.” Man and Environment 35 (1): 37–53.
- Singh, R. N., C. A. Petrie, V. Pawar, A. K. Pandey, and D. Parikh. 2011. “New Insights into Settlement along the Ghaggar and Its Hinterland: A Preliminary Report on the Ghaggar Hinterland Survey 2010.” Man and Environment 36 (2): 86–106.
- Stein, M. A. 1942. “A Survey of Ancient Sites Along the ‘Lost’ Sarasvati River.” Geographical Journal 99 (4): 173–82.
- Stein, M. A. 1943. An Archaeological Tour along the Ghaggar-Hakra River, 1940-42. American Documentation Institute Microfilm ADI-4861.
- Suraj Bhan. 1975. Excavation at Mitathal (1968) and Other Explorations. Kurukshetra: Kurukshetra University.
- Suraj Bhan, and J. G. Shaffer. 1978. “New Discoveries in Northern Haryana.” Man and Environment 2: 59–68.
- Sumner, W. M. 1972. “Cultural Development in the Kur River Basin, Iran: an Archaeological Analysis of Settlement Patterns.” Ph.D. diss., University of Pennsylvania, Pennsylvania.
- Sumner, W. M. 1988. “Prelude to the Proto-Elamite Anshan: the Lapui Phase.” Iranica Antiqua 23: 23–43.
- Sumner, W. M. 1990a. “An Archaeological Estimation of Population Trends Since 6000 BC in the Kur River Basin, Fars Province, Iran.” In South Asian Archaeology 1987, Volume I, edited by M. Taddei and P.-F. Callieri, 3–16. Rome: IsMEO.
- Sumner, W. M. 1990b. “Full-Coverage Regional Archaeological Survey in the Near East: An Example from Iran.” In The Archaeology of Regions: A Cast for Full-Coverage Survey, edited by S. K. Fish and S. A. Kowalewski, 87–115. Washington DC: Smithsonian Institution Press.
- Sumner, W. M. 1994. “The Evolution of Tribal Society in the Southern Zagros Mountains, Iran.” In Chiefdoms and Early States in the Near East: The Organisational Dynamics of Complexity, edited by G. Stein and M. Rothman, 47–65. Monographs in World Prehistory 18. Madison: Prehistory Press.
- Tapete, D. 2018. “Remote Sensing and Geosciences for Archaeology.” Geosciences 8: 41.
- Timpson, A., S. Colledge, E. R. Crema, K. Edinborough, T. Kerig, K. Manning, M. G. Thomas, and S. Shennan. 2014. “Reconstructing Regional Demographies of the European Neolithic using ‘Dates as Data’: A new Case-Study using an Improved Method.” Journal of Archaeological Science 52: 549–557.
- Tooth, S. 1999. “Floodouts in Central Australia.” In Varieties of Fluvial Form, edited by A. J. Miller and A. Gupta, 219–247. London: Wiley and Sons.
- Tooth, S. 2005. “Splay Formation along the Lower Reaches of Ephemeral Rivers on the Northern Plains of Arid Central Australia.” Journal of Sedimentary Research 75: 636–649.
- Tooth, S. 2012. “Arid Geomorphology: Changing Perspectives on Timescales of Change.” Progress in Physical Geography 36: 262–284.
- van Dijk, W. M., A. L. Densmore, A. Singh, S. Gupta, R. Sinha, P. J. Mason, S. K. Joshi, N. Nayak, M. Kumar, S. Shekhar, D. Kumar, and S. P. Rai. 2016. “Linking the Morphology of Fluvial fan Systems to Aquifer Stratigraphy in the Sutlej-Yamuna Plain of Northwest India.” Journal of Geophysics Research: Earth Surface 121: 201–222.
- Verreyke, H., and F. Vermeulen. 2009. “Tracing Later Roman Rural Occupation in Adriatic Central Italy.” American Journal of Archaeology 113 (1): 103–120.
- Weiss, H. 1977. “Periodization, Population and Early State Formation in Khuzistan.” In Mountains and Lowlands: Essays in the Archaeology of Greater Mesopotamia, edited by L. D. Levine and T. C. Young, Jr., 347–369. Malibu: Undena Publications.
- Weiss, H. 2017. “4.2 ka BP Megadrought and the Akkadian Collapse.” In Megadrought and Collapse: From Early Agriculture to Angkor, edited by H. Weiss, 93–160. New York: Oxford.
- Whitelaw, T. M. 2012. “Collecting classical cities: prospects and problems.” In Archaeological Survey and the City, edited by P. Johnson and M. Millett, 70–106. Oxford: Oxbow Books.
- Wilkinson, T. J. 2000. “Regional Approaches to Mesopotamian Archaeology: The Contribution of Archaeological Surveys.” Journal of Archaeological Research 8 (3): 219–267.
- Wilkinson, T. J. 2003. Archaeological Landscapes of the Near East. Tucson: University of Arizona Press.
- Wossink, A. 2009. Challenging Climate Change: Competition and Cooperation among Pastoralists and Agriculturalists in Northern Mesopotamia (c. 3000-1600 BC). Leiden: Sidestone Press.
- Wright, R. P. 2010. The Ancient Indus: Urbanism, Economy and Society. Cambridge: Cambridge University Press.
- Wright, R. P., J. Schuldenrein, M. A. Khan, and M. R. Mughal. 2001. “The Emergence of Satellite Communities along the Beas Drainage: Preliminary Results from Lahoma Lal Tibba and Chak Purbane Syal.” South Asian Archaeology 1: 327–336.
- Wright, R. P., J. Schuldenrein, M. A. Khan, and S. Malin-Boyce. 2003. “The Beas River Landscape and Settlement Survey: Preliminary Results From the Site of Vainiwal.” In South Asian Archaeology 2003, edited by U. Franke-Vogt and H. J. Weisshar, 101–110. Aachen: Linden Soft.