
ABSTRACT
Satellite observations of the Antarctic surface since the 1990s, coupled with geophysical surveys of the flow and form of its giant ice sheet, have revealed accelerating loss of ice to the oceans. This, coupled with a reduction in floating sea ice surrounding the continent and the occurrence of unprecedented heatwaves, point to a continent being changed irreversibly by fossil-fuel burning and the global heating that results. A changing Antarctic continent will have global consequences, including sea level rise of possibly more than 1 meter in this century (and much more afterward) and by a reduced ability to naturally reflect incoming solar energy—which would lead to further heating by absorption on land and at sea as the ice pack retreats.
The continent of Antarctica was only discovered a little over 200 years ago, in 1820, by three independent teams from Russia, Great Britain, and the USA. Yet in those two centuries, our knowledge of the frozen continent has expanded enormously, thanks to use of the latest advances in science and technology, dating back to the earliest years. This approach has continued to the present day, helping to reveal the topography of Antarctica below the ice, how ice sheets work, the effects of greenhouse gases, and changes in sea level rise. Thanks to this work, we have a better idea of Antarctic extreme events—and, hopefully, how to protect Antarctica.
While the history of early Antarctic exploration is often characterized by the international “race to the Pole,” and the bravery and hardship it required without (what we would now consider) adequate clothing, nutrition, and support, the British expeditions were fully scientific in their mission and objectives. Ernest Shackleton’s Nimrod expedition of 1907–1909 included a successful traverse to the southern magnetic Pole, and Captain Robert Falcon Scott’s 1912 Terra Nova expedition included work on geology, meteorology, oceanography, marine biology, and terrestrial ecology. Indeed, because they were the very first, many of the measurements and observations that Scott and his team carried out are still useful today.
In 1957–58, a world that had been at war little more than a decade earlier came together to measure the planet as part of the International Geophysical Year, or IGY. Antarctic exploration was a major component of the IGY, with tractor-driven traverses powering across the continent—allowing seismic measurements to quantify the thickness of ice (over 4 kilometers in places, or a little under 2.5 miles) and to prove that Antarctica was indeed a single land mass. As part of that event, the US built and staffed a research station at the South Pole, that has been continuously occupied ever since.
While great discoveries were made about Antarctica, it was only in the late 1960s that a suitable technology to efficiently measure the ice thickness and subglacial land was invented and deployed. Using aircraft, researchers were able to acquire “profiles” of the subglacial topography by transmitting radio waves downwards into the cold ice which then reflected off the ice-sheet bed. This technique allowed a UK team led by Gordon Robin to explore about 40 percent of the continent by 1980. Sixty years since the first “radio-echo sounding” work, the subglacial topography of Antarctica has finally been ascertained, at least to a first order of detail (Siegert and Fountain Citation2023; Frémand et al. Citation2023). Antarctica beneath the ice is a complex continent of mountains, lowlands, valleys, and trenches—many of which have been formed and influenced by past geological and glaciological changes. (See ).
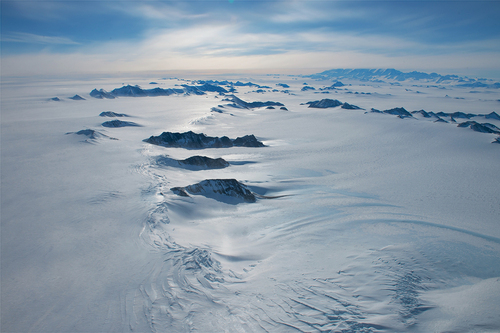
Figure 1. Nunataks—or mountain peaks projecting up above a surface of inland ice and snow—show up clearly in this aerial image of Ellsworth Land in West Antarctica. All images taken by Pete Bucktrout / British Antarctic Survey in December 2011.
These subglacial topographic measurements have proven vital to making numerical models of the Antarctic ice sheet. Ice sheet models allow the flow and form of the ice sheet to be calculated, from which predictions of how it may change in future can be based. Models can also help us understand how and why the Antarctic ice sheet has changed in the past.
How ice sheets work
Ice will deform under large stresses applied for extended periods of time. Consequently, all glaciers and ice sheets experience the flow of ice through deformation.
Antarctica has the world’s largest ice sheet by an order of magnitude (Greenland’s being next-largest), and it has the highest average elevation of any continent by virtue of the very thick ice that covers it. Ice accumulates at the center of Antarctica, at a place known to researchers as “the ice divide,” and it flows to the margins via enhanced flow units that merge to form ice streams—which flow hundreds of meters per year and become rivers of ice that channel mass to the grounded edge of the ice sheet. (See ).
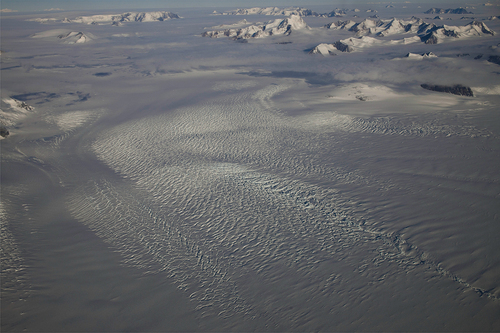
Figure 2. An ice stream flowing from the Ellsworth Mountains towards Filchner Ronne Ice Shelf in West Antarctica. Image by Pete Bucktrout / British Antarctic Survey.
Here, the ice floats, forming ice shelves, often several hundred meters in thickness. The early explorers called these “barriers” because the 30-meter wall of ice above the water line was impossible to penetrate by ship.
The enhanced flow in ice streams occurs because water is generated at the bed, causing either direct sliding over rock or the deformation of water-saturated sediments. Around 50 percent of the Antarctic bed is known to be wet, and this water flowing under the pressure of the ice has led to the creation of over 600 subglacial lakes (Livingstone et al. Citation2022) and even rivers beneath the ice (Dow et al. Citation2022; Wingham et al. Citation2006).
All this occurs despite the fact that in the center of East Antarctica, the average accumulation of ice is less than two centimeters per year—or less than one inch. It obviously has taken considerable time to build an ice sheet the size of Antarctica. (See ).
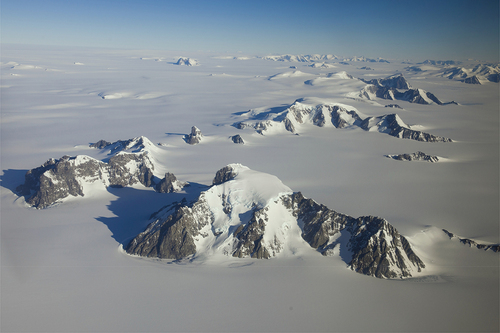
Figure 3. The Ellsworth Mountains are some of the highest in Antarctica, and get their name from American polar explorer Lincoln Ellsworth, who discovered them during his flight across the continent in 1935. Born into a prominent family in Illinois, Lincoln’s father was a noted donor to polar exploration. (He was also responsible for building one of the first skyscrapers in Chicago, known as the Ellsworth Building). Image by Pete Bucktrout / British Antarctic Survey.
Greenhouse gases and ice sheet change
We know that Antarctica has changed in the past because of the information held in the deep ice cores that researchers have taken there. Since the late 1960s, Russian and French scientists have extracted a column of ice greater than 4 kilometers in length from Vostok Station. Because these Antarctic ice cores contain air—in the form of a sample of the atmosphere from the time the ice that entombed was snow on the surface—each ice core resembles a time capsule, allowing the Earth’s air to be sampled in small quantities from the present day to nearly 1 million years ago at the ice base. (Older ice gets squeezed out or melted).
The ice samples show that periods of global cooling—otherwise known as ice ages—are associated with an atmospheric carbon dioxide concentration of around 180 parts per million. Interglacials—periods of relative warmth—occur with a carbon dioxide level of about 280 parts per million. Ice ages are paced by small changes to the Earth’s orbit, leading to alterations in incoming solar energy, which lead via feedback processes to global events. The most significant feedback involves carbon dioxide levels, which globalize and amplify the effect of orbital changes.
Before industrialization, the atmospheric carbon dioxide concentration was around 280 parts per million, as it had been in previous interglacials. Today, because of fossil-fuel burning it now stands at around 424 parts per million—higher than it has ever been since the end of the Pliocene epoch, 2.6 million years ago. During the Pliocene, the world was 3 to 4 degrees Celsius (about 5.4 to 7.2 degrees Fahrenheit) warmer than today, and the sea level was at times more than 20 meters higher than now (about 65.5 feet). Whether the present level of carbon dioxide will cause a return to the extreme conditions of Pliocene Earth is a major theme in the field of earth sciences, as the changes it would bring to the present natural world would cause human civilization to change substantially (Siegert, Haywood, et al. Citation2020).
The ice cover in Antarctica has been persistent for around 34 million years, when declining global greenhouse gasses and the opening of the Drake Passage separated Antarctica from South America, isolating it climatically and plunging it into the deep freeze.
Our knowledge of “deep geological” time in Antarctica—the Pliocene started about 5.3 million years ago—comes from the rock record, accessed via deep drilling around the margins of the continent in marine sediments. Airborne geophysical measurements, ice sheet modeling, sediment cores, and ice core studies demonstrate that the Antarctic ice sheet has expanded and contracted on numerous occasions in that time. As carbon dioxide levels increase further, analogies with the past go ever further back. There have been times more than 34 million years ago when Antarctica, while still positioned geographically at the Pole, contained no ice at all, due to the blanketing effect of ultra-high greenhouse gas levels. For example, an event called the “Paleocene-Eocene Thermal Maximum” around 55 million years ago saw high amounts of volcanic activity and atmospheric carbon dioxide concentrations of over 1,000 parts per million, and global temperatures around 12 degrees Celsius (roughly about 21.6 degrees Fahrenheit) greater than today.
Clearly, the past explains to us that the greater the carbon dioxide level, the greater the Antarctic change will be.
This matters for two obvious reasons. First, radio-echo sounding surveys have revealed that the volume of ice locked away in Antarctica equates to over 60 meters (nearly 197 feet) in global sea-level terms.
Second, as the ice retreats both on land and sea (in the form of a decline in the amount of sea-ice on the ocean, and of snow and ice on the ground), a formerly white reflective surface is replaced by a dark surface that absorbs solar energy—leading to further warming.
These influences and effects are not new. At the last ice age, only 20,000 years ago, global cooling of around 5 degrees Celsius (roughly about 9 degrees Fahrenheit) and a carbon dioxide level of 180 ppm led to the buildup of massive ice sheets mostly in the Northern Hemisphere, and sea level to be approximately 130 meters (426 feet) lower than today. In the following 10,000 years, a carbon dioxide increase of 100 parts per million caused these ice sheets to melt and sea level to rise by the same amount. This sea-level rise occurred at a rate of roughly about 1.3 meters (about 4.3 feet) per century on average—sometimes less and sometimes more—until the cessation of significant ice loss by about 10,000 years ago (Siegert Citation2001). But as noted, the rate could be much, much faster; in one warming event about 14,200 years ago—known as “Meltwater Pulse 1A”—the sea level rose by approximately 4 to 6 meters per century (roughly about 13 to 19.6 feet), and 16 to 25 meters (52.5 to 82 feet) in total (Siegert Citation2001).
Sea-level rise wasn’t the only problem, however. So much fresh water was transferred to the ocean that it changed the saltiness of the sea. This is a crucial effect, because the oceans store and transfer heat around the planet through a process linked to its salinity. In the North Atlantic, very dense salty water forms, causing it to sink and be replaced by warmer water from the South. This kickstarts the thermohaline circulation, leading to relatively warm conditions in the United Kingdom relative to the same latitude on the American east coast. Occasionally, however, deglaciation of a colossal ice sheet across Canada and the northernmost United States led to a great increase in the amount of freshwater entering the ocean, causing interruptions to the thermohaline process and leading to periods of rapid cooling. These changes were both significant (plus or minus 5 degrees Celsius, or about 9 degrees Fahrenheit) and rapid (within a few decades); they demonstrate the global interconnectivity of processes that have planetary consequences when the climate is pushed into a new state.
Satellite measurements of Antarctica
So how is Antarctica changing today? A number of satellites launched since the early 1990s allow us to measure the surface of the ice sheet, using either radar or lidar (Otosaka et al. Citation2023). The results of over 30 years of observations are striking in two ways.
First, they show that, in general, ice loss in Antarctica today is six times more than it was just 30 years ago. While the Antarctic contribution to 20 centimeters (just under 8 inches) of sea level change since industrialization began around 1850 is negligible, its contribution today is significant and will be ever more so in future. This 20 centimeters is essentially caused by the ocean warming and expanding (around 10 centimeters, or about 4 inches) and the melting of small valley glaciers (the other 10 centimeters). But today, the contribution to sea level rise by the glaciers and the polar ice sheets is greater than the thermal expansion of the ocean, and the ice sheet loss is now greater than the glaciers. This matters greatly, because as the last ice age (and Meltwater Pulse 1A) tells us, when the ice sheets melt, the sea level can rise by meters and not just centimeters.
Second, the distribution of mass loss is not even. It is concentrated in a couple of key areas, within the Amundsen Bay region of West Antarctica—where the Thwaites Glaciers is found—and the Totten Glacier region in East Antarctica.
In both cases, these glaciers have massive ice catchments and lie on a bed that is suppressed substantially below the sea level. In these places, it is ocean warmth that is melting the ice. As we know from Greenland glaciers that terminate in water, they can retreat rapidly onto land when the water warms, and then stop retreating.
The problem with both the Thwaites and the Totten glaciers is that there is no upstream land to retreat to—only deeper and deeper terrain which encourages accelerated and unstoppable retreat. This “marine ice sheet instability” hypothesis is now being tested in Antarctica, and some believe it may have already begun (Joughin, Smith, and Medley Citation2014). If the Thwaites glacier retreats, it will lead to the deglaciation of the whole West Antarctic ice sheet and cause around 3.5 meters (just under 11.5 feet) of global sea level rise.
If the Totten Glacier retreats, the consequences could be even greater.
And if marine ice sheet instability isn’t bad enough, there’s another hypothesis of concern: “marine ice cliff instability,” which is where floating ice shelves that border the grounded ice in Antarctica collapse suddenly, as has happened on several occasions, leading to a vertical wall of ice at the ice sheet edge. If that wall is greater than 100 meters (328 feet) tall, it will not be able to support itself mechanically, and so it will collapse. In this way, collapse of floating ice shelves could lead to ice sheet loss without the need for ocean-driven melting. In combination, marine ice sheet instability and marine ice cliff instability could force ice sheet retreat far more rapidly than observed to date (DeConto et al. Citation2021).
Predicting sea-level rise
Numerical ice sheet modeling is the only means to predict how ice sheets will react to continued fossil-fuel burning and global heating. The 6th Assessment Report of the Intergovernmental Panel on Climate Change (IPCC) used results from modeling to estimate that it is “likely” that sea level will rise by between 0.5 and 1 meters (between about 1.6 feet and 3.3 feet) by 2100. As Siegert, Alley, et al. (Citation2020) point out, “likely” is IPCC speak for being 66 percent certain. That means there is a 1-in-3 chance of sea level being outside that range by 2100. As there is very little chance of sea level being less than 0.5 meters this century, it means an unlikely but non-ignorable chance of it being greater than 1 meter, and indeed much higher thereafter.
There are several reasons why we can’t quantify sea level rise more accurately. A first is that we don’t know the level of warming, because as it depends on how well the world’s countries decarbonize. The quicker we do so, the lower the level of warming and the less rapid ice-sheet loss will be. The “zero emissions commitment” shows that global warming can effectively be halted within a few decades of achieving net zero emissions (Palazzo Corner et al. Citation2023). Under a high-emissions scenario and failure to decarbonize, sea level rise of more than 1 meter by 2100 is possible.
A second reason we can’t predict sea-level rise more accurately is that despite the efforts of polar explorers, much of Antarctica remains to be measured. This is especially true where the ice loss is greatest, because these regions are remote and challenging to access. Consequently, our knowledge of the region’s subglacial topography—a critical boundary condition for ice-sheet models—is sub-optimal and results are compromised.
A third confounding factor to making accurate predictions is that the Southern Ocean—which supplies heat to the ice edge—is very poorly sampled and understood. As a result, our ability to understand, let alone predict, how warm ocean water can find its way to the ice interface is restricted to quite broad processes.
A fourth problem: Ice sheet models themselves could stand to be improved, and their resolution increased to the level at which ice-loss processes occur. At present, we need to parameterize key processes, which when applied to predictions of sea level lead to built-in limitations.
These challenges are solvable, however. The last 30 years have seen tremendous progress in ice-sheet modeling (Pattyn et al. Citation2017), ice sheet measurements (Frémand et al. Citation2023), and ice-sheet observations (Otosaka et al. Citation2023). Continued progress in all three will surely lead to an improved ability to model ice-sheet change and sea-level rise (Siegert and Pearson Citation2021). The upcoming 4th International Polar Year (2032–33), 75 years since the International Geophysical Year, could be the moment of international collaboration on an issue of significant global consequence.
Antarctic extreme events
So what does all this mean? In a nutshell, we shouldn’t underestimate the seriousness of Antarctic change.
Thirty years ago, Antarctic scientists were driven by adventure and curiosity about an undiscovered land. They still are to some degree, but the changes observed in recent decades point to another motivation: We must understand how and why Antarctica is changing because the world will feel its effects.
These changes are unlikely to be gradual and smooth. In the last few years, Antarctica has witnessed a series of “extreme events” caused by fossil-fuel burning (Siegert et al. Citation2023). In March 2022, the world’s largest recorded heatwave occurred across East Antarctica, in which a river of warm air from Australia punched through the polar atmospheric vortex and onto the continent, raising temperatures by about 38.5 degrees Celsius—about 69 degrees Fahrenheit—above the March average.
In 2023, Antarctic sea ice was at all-time lows for over six months, leading to exposure of an ocean surface of 5 to 10 times the UK area to absorb solar energy rather than reflect it. In February 2014, several Antarctic ice shelves recorded substantial surface melting, leading to waterfalls off some of them. Such melting was unheard of a few decades ago.
In the years 1995, 2002, and 2022, major ice shelves collapsed suddenly, due to surface melt-induced holes in the ice, compromising the structural integrity of these floating slabs of ice. Collapse happened within days and led to the speed-up of the movement of the upstream grounded ice that was otherwise being supported. In late Austral summer 2023, enhanced snowfall occurred on the Antarctic Peninsula, due to an influx of warm moist air from the North.
Antarctica was once considered an isolated, desolate and unchanging extreme environment. More accurately, it’s now considered to be a place of change, connected to the planet with potential consequences for all of us.
How to protect Antarctica
The sooner we decarbonize, the more we can reduce Antarctic change and global consequences (Rintoul et al. Citation2018; Siegert et al. Citation2019). While some change is now sadly inevitable, we can avoid the more disastrous consequences that would result under unabated fossil fuel burning (Palazzo Corner et al. Citation2023).
Controversially, the prospect of cutting back on our fossil-fuel use has led some to consider physical “intervention” or “geoengineering” strategies in Antarctica to protect the world. Some examples of these very speculative technological fixes include artificially freezing sea ice to increase reflectivity, placing a barrier within the ocean to prevent ocean heat from reaching the ice, or drilling into the deep polar ice sheet to take out basal water and reduce the flow of ice.
To some, geoengineering offers a means to lower the effects of global warming under high emissions. To others, including myself, they offer a false hope which only encourages continued fossil fuel burning.
None of the geoengineering ideas to date look achievable within the geographical- and time-scales of the global heating problem we face, if at all. Critically, any work in Antarctica requires a permit offered by an Antarctic Treaty signatory, after a comprehensive environmental evaluation has been written. Such evaluations are complex and must describe fully the environmental impact of the work. Signatories to the Environmental Protocol to the Antarctic Treaty have pledged to “comprehensively” protect the Antarctic environment. Any geoengineering intervention would likely be in conflict with this environmental protocol, meaning that even if a geoengineering idea could work on a continent-wide scale (a very questionable prospect, especially in such a difficult and remote locale), it would be unlikely to obtain a permit from a reputable nation.
Our best and only way to protect Antarctica is to rapidly and deeply decarbonize to net zero by mid-century. The benefits of doing so would be global, and our future generations will be the beneficiaries.
Disclosure statement
No potential conflict of interest was reported by the author(s).
Funding
This research received no specific grant from any funding agency in the public, commercial, or not-for-profit sectors.
Additional information
Funding
Notes on contributors
Martin Siegert
Martin Siegert is vice president (Cornwall) at the University of Exeter. Previously he was a professor at Imperial College London and director of the Grantham Institute for Climate Change and the Environment. Before that he was head of the School of GeoSciences at the University of Edinburgh. He is a glaciologist with over 30 years’ experience in both polar regions. In 2013 he was awarded the Martha T Muse Prize in Antarctic Science and Policy, and in 2007 he was elected as a Fellow of the Royal Society of Edinburgh.
References
- DeConto, R. M., D. Pollard, R. B. Alley, I. Velicogna, E. Gasson, N. Gomez, S. Sadai, et al. 2021. “The Paris Climate Agreement and Future Sea-Level Rise from Antarctica.” May 5. Nature 593 (7857): 83–89. https://doi.org/10.1038/s41586-021-03427-0.
- Dow, C., N. Ross, H. Jeofry, K. Siu, and M. J. Siegert. 2022. “Widespread, Continuous Impact of a 400 Km Antarctic Subglacial River on Basal Environments and Ice Shelf Systems.” October 27. Nature Geoscience. https://doi.org/10.1038/s41561-022-01059-1.
- Frémand, A. C., P. Fretwell, J. A. Bodart, H. D. Pritchard, A. Aitken, J. L. Bamber, R. Bell. 2023. “Antarctic Bedmap Data: FAIR Sharing of 60 Years of Ice Bed, Surface and Thickness Data.” Earth System Science Data 15 (7): 2695–2710. July 17. https://doi.org/10.5194/essd-15-2695-2023.
- Joughin, I., B. E. Smith, and B. Medley. 2014. “Marine Ice Sheet Collapse Potentially Under Way for the Thwaites Glacier Basin, West Antarctica.” Science 344 (6185, May 16): 735–738. https://doi.org/10.1126/science.1249055.
- Livingstone, S. J., Y. Li, A. Rutishauser, R. J. Sanderson, K. Winter, J. A. Mikucki, H. Björnsson. 2022. “Global Synthesis of Subglacial Lakes and Their Changing Role in a Warming climate.” January 4. Nature Reviews Earth and Environment 3 (2): 106–124. https://doi.org/10.1038/s43017-021-00246-9.
- Otosaka, I. N., A. Shepherd, E. R. Ivins, N.-J. Schlegel, C. Amory, M. R. van den Broeke, M. Horwath. 2023. “Mass Balance of the Greenland and Antarctic Ice Sheets from 1992 to 2020.” Earth System Science Data 15 (4): 1597–1616. April 20. https://doi.org/10.5194/essd-15-1597-2023.
- Palazzo Corner, S., M. Siegert, B. Fox-Kemper, T. Frölicher, A. Gallego-Sala, J. Haigh, G. Hegerl, et al. 2023. “The Zero Emissions Commitment and Climate Stabilization.” Frontiers in Science 1: 1170744. https://doi.org/10.3389/fsci.2023.1170744 .
- Pattyn, F., L. Favier, S. Sun, and G. Durand. 2017. “Progress in Numerical Modeling of Antarctic Ice-Sheet Dynamics.” Current Climate Change Reports 3 (3): 174–184. July 21. https://doi.org/10.1007/s40641-017-0069-7.
- Rintoul, S. R., S. L. Chown, R. DeConto, M. England, H. Fricker, V. Masson-Delmotte, T. Naish, M. J. Siegert, and J. C. Xavier. 2018. “Antarctica and the Southern Ocean in 2070: What Future Will We Choose?” Nature 558: 233–241. https://doi.org/10.1038/s41586-018-0173-4.
- Siegert, M. J. 2001. Ice Sheets and Late Quaternary Environmental Change. Chichester, UK: John Wiley.
- Siegert, M. J., R. B. Alley, E. Rignot, J. Englander, and R. Corell. 2020. “21st Century Sea-Level Rise Could Exceed IPCC Predictions for Strong-Warming Futures.” December 18. One Earth 3 (6): 691–703. https://doi.org/10.1016/j.oneear.2020.11.002.
- Siegert, M. J., A. Atkinson, A. Banwell, M. Brandon, P. Convey, B. Davies, R. Downie. 2019. “The Antarctic Peninsula Under a 1.5°C Global Warming Scenario.” June 28. Frontiers in Environmental Science 7: 102. https://doi.org/10.3389/fenvs.2019.00102.
- Siegert, M. J., M. J. Bentley, A. Atkinson, T. J. Bracegirdle, P. Convey, B. Davies, R. Downie. 2023. “Antarctic Extreme Events.” Frontiers in Environmental Science 11: 1229283. August 8. https://doi.org/10.3389/fenvs.2023.1229283.
- Siegert, M. J., and A. S. Fountain. 2023. “Evolution of the Antarctic Continent and Its Ice Sheet,” In Cambridge History of the Polar Regions, edited by A. Howkins and P. Roberts, 55–78. Cambridge University Press. https://doi.org/10.1017/9781108555654.003.
- Siegert, M. J., A. Haywood, D. Lunt, T. van de Flierdt, and J. Francis. 2020. “What Ancient Climates Tell Us About High Carbon Dioxide Concentrations in Earth’s Atmosphere.” Grantham Institute Briefing Note, 13. Imperial College London. https://doi.org/10.25561/79292.
- Siegert, M. J., and P. Pearson. 2021. “Reducing Uncertainty in 21st Century Sea-Level Predictions and Beyond.” Frontiers in Environmental Science 9 (September 30): 751978. https://doi.org/10.3389/fenvs.2021.751978.
- Wingham, D. J., M. J. Siegert, A. P. Shepherd, and A. S. Muir. 2006. “Rapid Discharge Connects Antarctic Subglacial Lakes.” April 1. Nature 440 (440): 1033–1036. https://doi.org/10.1038/nature04660.