
 ?Mathematical formulae have been encoded as MathML and are displayed in this HTML version using MathJax in order to improve their display. Uncheck the box to turn MathJax off. This feature requires Javascript. Click on a formula to zoom.
Abstract
D-Fagomine is an iminosugar found in nature that lowers blood glucose peak after meal and reduces fat-induced weight gain and insulin resistance. The immediate precursor of D-fagomine is accessible straightforward via D-fructose-6-phosphate aldolase catalyzed aldol addition of dihydroxyacetone to Cbz-N-3-aminopropanal (Cbz = benzyloxycarbonyl). In this work, the performance and kinetics of the abovementioned reaction catalyzed by FSA A129G variant was studied. The reaction was investigated in two reactors; batch reactor and microreactor, and kinetic parameters were estimated from the steady state experiments in the batch reactor. This enzyme has improved stability, better Km value for Cbz-N-3-aminopropanal and lower retro-aldol activity in comparison with previously studied aldolase variants FSA A129S and A129S/A165G. Mathematical model for both reactors was developed and validated experimentally.
Introduction
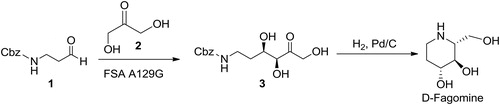
C–C bond formation is one of the crucial reactions in organic synthesis (Clapés et al., Citation2010; Windle et al., Citation2014). Among the methods available for performing this reaction, aldol addition is a privileged methodology for the bottom up synthesis of polyfunctionalized molecules such as carbohydrates and amino acids (Mahrwald, Citation2004a, Citation2004b, Citation2013). Aldolases catalyze this reaction in nature typically involving a ketone, as nucleophile, and an aldehyde, as electrophile (Schürmann and Sprenger, Citation2001; Clapés and Garrabou, Citation2011; Oroz-Guinea and García-Junceda, Citation2013; Roldán et al., Citation2017). Aldolases are gaining a great interest in the synthesis of bioactive chiral carbohydrates, amino acids, etc. (Clapés and Joglar, Citation2013; Guérard-Hélaine et al., Citation2014; Soler et al., Citation2014; Citation2015; Hernández et al., Citation2015; Szekrenyi et al., Citation2015; Roldán et al., Citation2017; Saravanan et al., Citation2017; Hernández et al., Citation2018). This is due to their high efficiency, selectivity, and control over the configurations of the formed stereogenic centers. Furthermore, they can operate under mild conditions and in aqueous solutions (Müller, Citation2012; Müller et al., Citation2013; Schmidt et al., Citation2016; Clapés, Citation2016a, Citation2016b). Another great advantage of using enzymes for C–C bond formation is their ability to form new C–C bonds with structurally different substrates as opposed to their natural substrates (Garrabou et al., Citation2009; Brovetto et al., Citation2011; Hernández et al., Citation2015; Szekrenyi et al., Citation2015; Güclü et al., Citation2016; Hernández et al., Citation2017; Roldán et al., Citation2017; Saravanan et al., Citation2017; Hernández et al., Citation2018). D-Fructose-6-phosphate aldolase from E. coli (FSA), first reported by Schürmann and Sprenger (Citation2001), catalyzes the equilibrium reaction between dihydroxyacetone (2) and aldehyde. In this paper a novel FSA aldolase variant, FSA A129G (Szekrenyi et al., Citation2014), was investigated in the reaction of aldol addition of 2 to Cbz-N-3-aminopropanal (1) to furnish a precursor of the iminosugar D-fagomine (Scheme 1). D-Fagomine is an iminosugar found in nature with the ability to lower blood glucose peak after meal by inhibiting intestinal disaccharidases and to reduce low-grade inflammation mediated fat-induced weight gain and insulin resistance probably by maintaining the adequate proportions of intestinal microbiota (Gómez et al., Citation2012; Amézqueta et al., Citation2013; Ramos-Romero et al., Citation2014). In preliminary experiments, FSA A129G showed a superior performance in the aforementioned reaction as compared to the previously reported variants FSA A129S and A129S/A165G (Sudar et al., Citation2013b).
Scheme 1. FSA A129G catalyzed aldol addition of 2 to 1 to furnish a precursor of the iminosugar D-fagomine (3).
To describe an enzymatic biotransformation with a mathematical model, kinetics of the process need to be evaluated (Vasić-Rački et al., Citation2011, Citation2003b). Every compound in the reaction medium, together with the biocatalyst stability in the reactor, has an effect on the reaction rate and this effect should be defined for a proper mathematical description (Vasić-Rački et al., Citation2011). Once developed, a mathematical model and simulations can be very useful to optimize and improve a process, as well as to evaluate the biocatalyst performance. They can be used for development and process design (Zimmermann et al., Citation2007), identification of the optimal reactor type for a given process (Vasić-Rački et al., Citation2003a; Findrik et al., Citation2010), scale-up (Tufvesson et al., Citation2010), identification of the process cost structure (Mathys et al., Citation1999), environmental assessment (Biwer et al., Citation2005), etc. Using mathematical modeling and simulations reduces the required experimental effort and the cost of process design and scale-up (Brass et al., Citation1997; Heitzig et al., Citation2014). Usually, mathematical modeling is used for optimizing complex reactions and thus clear optimization targets need to be defined to optimize the process conditions for several targets (Zimmermann et al., Citation2007; Findrik et al., Citation2010; Ringborg and Woodley, Citation2016).
In this work FSA A129G was kinetically characterized and compared with two previously studied aldolases, FSA A129S and FSA A129S/A165G (Sudar et al., Citation2013b), in terms of substrate conversion, maximum reaction rate and Michaelis constants, i.e. affinity towards 1, 2, and aldol adduct (3), as well as in terms of operational stability. Mathematical model of the aldol addition was established for batch reactor and microreactor and validated experimentally.
Materials and methods
Chemicals
Dihydroxyacetone (2), hydrochloric acid (HCl), triethanolamine (TEA), trifluoroacetic acid (TFA), acetonitrile, and methanol were purchased from Sigma Aldrich (Germany). Cbz-N-3-aminopropanal (1), the aldol adduct (3S,4R)-6-[(benzyloxycarbonyl)amino]-5,6-dideoxyhex-2-ulose (3) and FSA A129G were produced and characterized by the Biotransformation and Bioactive Molecules Group at Institute of Advanced Chemistry of Catalonia IQAC-CSIC (Spain) (Castillo et al., Citation2009).
HPLC analysis
HPLC (Shimadzu, Japan) analysis was applied to determine the concentration of 1 and 3 on Lichrospher® (Phenomenex) 250 × 4 mm (5 μm) column, at 30 °C and 215 nm. The method for the analysis was isocratic. Mobile phase consisted of 66% v/v of solution A and 34% v/v of solution B at 1.2 cm3 min−1. Mobile phase A: 0.1% v/v trifluoroacetic acid (TFA) in water; mobile phase B: 0.095% TFA in acetonitrile/80:20. Retention times of 3 and 1 were 3.9 and 7.8 min, respectively. Samples were diluted in methanol and centrifuged before analysis for 2 min at 14,000 rpm to precipitate the enzyme.
FSA activity measurements
Enzyme activity was measured using the initial reaction rate method. Experiments were carried out in batch reactor (0.5 cm3) at 1000 rpm. 50 mmol dm−3 TEA HCl buffer, pH 7.5, with 10% v/v of ethyl acetate was the reaction medium. Linear slope was estimated from the changes of concentration of 3 in time when substrate conversion was less than 10%. Volume activities were calculated from this slope using EquationEquation 1(1)
(1) .
(1)
(1)
(2)
(2)
Specific activity was calculated from the volume activities using EquationEquation 2(2)
(2) .
One Unit of FSA A129G activity was defined as the amount of enzyme required for the synthesis of one μmol of 3 in 1 min at 25 °C and in 50 mmol dm−3 TEA HCl buffer, pH 7.5, with ethyl acetate (10% v/v). Since 1 is insoluble in water, a co-solvent (ethyl acetate) had to be added to the reaction mixture.
Influence of different pH and organic solvents on enzyme activity
pH dependence of FSA A129G activity was measured in the range from 7.0 to 8.6 using the previously described activity measurement method. The effect of two co-solvents; i.e. ethyl acetate and acetonitrile, on FSA A129G activity was studied in the reaction medium consisting of 50 mM TEA HCl buffer, pH 7.5 and 5–50% v/v of co-solvent.
Enzyme kinetics
Aldol addition reaction kinetics was investigated using the initial reaction rate method. Since the aldol addition is an equilibrium reaction, both forward and reverse reaction were investigated. The dependence of the initial reaction rate on the concentration of each substrate was investigated independently. This was done in a manner that the concentration of 1 was varied while 2 was kept constant and vice versa. The dependence of the initial reaction rate on the concentration of 3 was studied by keeping the concentration of 1 and 2 constant while 3 was varied. In the retro-aldol reaction, the influence of concentration of 3, 1, and 2 on the reaction rate was investigated (1 and 2 keeping 3 constant). Enzyme kinetics were measured in batch reactor (0.5 cm3) at 1000 rpm. 50 mmol dm−3 TEA HCl buffer, pH 7.5, with 10% v/v of ethyl acetate was the reaction medium. Enzyme concentration (0.84 mg cm−3) was the same in all experiments. Kinetic parameters were estimated from the gathered results by non-linear regression method (see Chapter 2.9. Mathematical model and data handling).
Batch reactor experiments
Aldol addition of 2 to 1 was performed in batch reactor (1 cm3 reactor) at 1000 rpm. The reaction medium was 50 mmol dm−3 TEA HCl buffer, pH 7.5, with ethyl acetate (10% v/v). Various initial substrate and enzyme concentrations were used in these experiments and FSA A129G activity was followed.
A repetitive batch reactor experiment was performed in which substrates 1 and 2 were added twice in the same reaction mixture after achieving maximum substrate conversion. Additional enzyme was not added. Initial conditions were the same as in the batch experiments and the concentrations of newly added substrates were the same as in the beginning of the experiment. The volume of the subsequently added substrates was as low as possible to keep the volume of the reaction mixture nearly constant.
Microreactor experiments
Two microreactors (Micronit Microfluidics B.V., Netherlands) were used in this work; two tubular plug flow microreactors made of borosilicate glass. One microreactor had the volume of 4 µl (microchannel width × depth of 250 × 50 μm) and smooth microchannel walls and the second one had the volume of 13 µl (microchannel width × depth of 150 × 150 μm) and rough microchannel walls. Both microreactors had two inlets, and one outlet for collecting samples. Stainless steel holder (Micronit Microfluidics B.V.) was used to provide a leak-free connection. Reaction solution was pumped to the microreactor by using syringe pumps (PHD 4400 Syringe Pump Series, Harvard Apparatus, Holliston, MA, USA) with stainless steel syringes (8 cm3, Harvard Apparatus).
Since 1 is insoluble in water, a co-solvent had to be added to the reaction mixture. As ethyl acetate does not mix well with water, acetonitrile was used instead. Aldehyde was dissolved in 50 mmol dm−3 TEA HCl buffer, pH 7.5 with acetonitrile (10% v/v) and pumped to one inlet of the microreactor. Enzyme and 2, in the same buffer, were pumped to the second inlet. The initial substrate and enzyme concentrations are given in figure legends and are referring to the concentrations in the microreactor. The solutions pumped to the microreactor were diluted two-fold, since the ratio of the two solutions at the inlets was 50:50. Various residence times were investigated and, after achieving stationary state, samples were collected, and analyzed on HPLC. For each residence time, three samples were collected. FSA A129G activity was followed in these experiments according to the method described in the chapter FSA activity measurements.
Enzyme operational stability
FSA A129G activity was followed during the reactions to assess its operational stability. The samples from batch reactor at different time intervals or from microreactor at different residence times were used to start separate batch reactions of aldol addition of 2 to 1. Concentrations of 1 and 2 in these batch experiments were 100 and 200 mmol dm−3, respectively, and all other conditions are defined in the chapter FSA activity measurements.
Mathematical model and data handling
Mathematical model of the investigated reaction includes kinetic and mass balance equations. The reaction rate of aldol addition reaction, r1, is described by double substrate Michaelis–Menten equation (EquationEquation 3(3)
(3) ).
(3)
(3)
The reaction rate of the retro-aldol reaction, r2, is described by Michaelis–Menten equation with competitive product (1) inhibition (EquationEquation 4(4)
(4) ).
(4)
(4)
Mass balance equations for the substrates (1 and 2) and product (3) in the batch reactor are presented by EquationEquations 5–7.
(5)
(5)
(6)
(6)
(7)
(7)
In order to describe the aldol addition in a microreactor, the microreactor was approximated with two parallel ideal plug flow reactors in a steady state (Tušek et al., Citation2013) and diffusion between them is described by Fick’s first law. The mass balance equations of the substrates, product, and enzyme in the microreactor were developed, based on this approximation, and are presented by EquationEquations 8–15.
for 1:
(8)
for 2:
for 3:
for enzyme:
In EquationEquations 8–15 v is the linear velocity (cm/s), z represents microchannel length (cm) and W is the microchannel width (cm). D1/B = 6.28 × 10⁻⁵ cm2 s−1, D2/B = 11.05 × 10⁻⁵ cm2 s−1, D3/B = 5.61 × 10⁻⁵ cm2 s−1 and DFSAA129G/B = 0.39 × 10⁻⁵ cm2 s−1 are the diffusion coefficients for 1, 2, 3, and FSA A129G, respectively. Diffusion coefficients for 1, 2, and 3 were calculated using the Scheibel empirical correlation (EquationEquation 16(16)
(16) ) (Scheibel, Citation1954).
(16)
(16)
In EquationEquation 16(16)
(16) , A signifies the solute and B the solvent, VA is the molar volume (cm3 mol−1) of the liquid solute at its normal boiling point, ηB is the viscosity of the solvent (cP) and T is temperature (K). Molar volumes of the used compounds do not exist in literature and they were calculated using predictive modules in ACD/ChemSketch. Molar volumes are 181.30, 70.10, and 223.90 cm3 mol−1 for 1, 2, and 3, respectively.
For the estimation of diffusion coefficient of the enzyme, Young correlation was used (EquationEquation 17(17)
(17) ) (Young et al., Citation1980).
(17)
(17)
M is the molecular mass of the enzyme (g mol−1), which is 257,000 g mol−1 for aldolase (Schürmann and Sprenger, Citation2001). All other symbols from this equation are explained earlier.
Kinetic parameters were estimated by non-linear regression methods (simplex and least squares fit) incorporated in SCIENTIST software (SCIENTIST handbook, Citation1986–1995) using the obtained experimental data. The same software was used to simulate the reaction in the reactor experiments.
Results and discussion
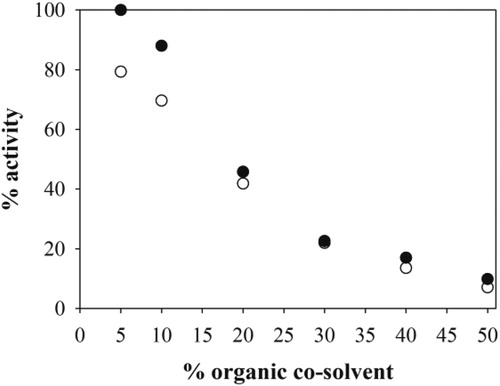
D-Fructose-6-phosphate aldolase variant, FSA A129G (Szekrenyi et al., Citation2014), was investigated for the aldol addition of 2 to 1. Preliminary experiments showed (data not reported) that this variant improved the reaction performance for this aldol addition reaction, although, unexpectedly it increased also the activity and reaction performance for glycolaldehyde additions (Szekrenyi et al., Citation2014). The influence of pH (7.0–8.6) on enzyme activity was investigated. The results showed a typical bell-like dependence (). The highest enzyme activity was obtained in 50 mmol dm−3 TEA HCl buffer pH 7.5. These conditions were further used for kinetic measurements and other experiments. Since 1 has limited solubility in water, the presence of an organic co-solvent in the reaction media was needed. Hence, the effect of co-solvent, ethyl acetate or acetonitrile, on FSA A129G activity was evaluated in the range of 5–50% v/v (). Increasing the concentration of co-solvent caused a significant decrease of enzyme activity and thus only lower concentration (5 and 10% v/v) were used in all further experiments to assure the balance between maximum enzyme activity and solubility of 1. The highest enzyme activity was obtained in ethyl acetate (), which was used for all kinetic measurements and experiments in the batch reactor. This co-solvent was not suitable for the use in microreactor because a stable parallel or segmented flow could not be achieved (Sudar et al., Citation2013a) and thus the experiments in microreactor were carried out with acetonitrile. The aldolase retains 80% of its activity in 5% of acetonitrile and 100% in ethyl acetate (). Furthermore, the selection of organic solvent does not influence the equilibrium substrate conversion at concentrations below 10% v/v, consistent with the results shown in our previous work (Sudar et al., Citation2013a).
Figure 1. pH dependence of FSA A129G (50 mmol dm−3 TEA HCl buffer pH 7.0, 7.5, 8.0, 50 mmol dm−3 glycine NaOH pH 8.6, 25 °C, γFSA = 0.84 mg cm−3, c2 = 201.1 mmol dm−3, c1 = 100.2 mmol dm−3).
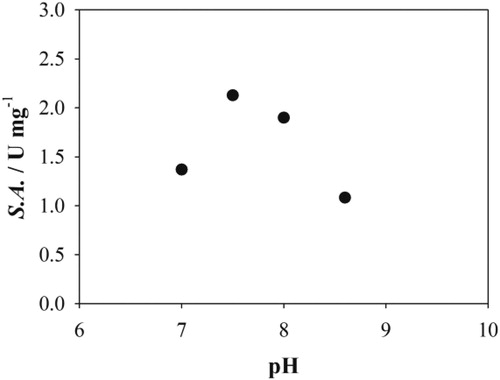
Figure 2. The influence of organic solvents on aldolase activity (50 mmol dm−3 TEA HCl buffer pH 7.5, 25 °C, γFSA = 0.84 mg cm−3, c2 = 201.1 mmol dm−3, c1 = 100.2 mmol dm−3) (black circles – ethyl acetate, white circles – acetonitrile).
Enzyme kinetics
Aldolase kinetics was investigated in the batch reactor. From the gathered experimental data (), kinetic parameters were estimated () and they showed that the maximum reaction rate of the retro-aldol, Vm2, was higher than that of the synthesis direction, Vm1. The enzyme showed lower Km value toward 1 (Km1) and 2 (Km2) than toward 3 (Km3) and also the inhibition of the retro-aldol reaction with 1 occurs (Ki1). Kinetic parameters for FSA A129S and FSA A129S/A165G showed the same effect () (Sudar et al., Citation2013b). Comparing FSA A129G with FSA A129S and FSA A129S/A165G, in terms of maximum reaction rates, revealed that FSA A129G was 1.8-fold more active than the FSA A129S/A165G and 3.6-fold less active than FSA A129S. The enzyme shows higher Km2 value than FSA A129S and FSA A129S/A165G, but lower Km1 value. In the retro-aldol direction, Km3 and Vm2 of FSA A129G were lower than those of FSA A129S and FSA A129S/A165G. Also, the inhibition of the retro-aldol reaction by 1 for FSA A129G was similar to that for FSA A129S but lower than that for FSA A129S/A165G () (Sudar et al., Citation2013b).
Figure 3. The kinetics of the aldol addition and the retro-aldol reaction in the batch reactor (50 mmol dm−3 TEA HCl buffer, pH 7.5, 25 °C, γFSA = 0.84 mg cm−3, 10% v/v of ethyl acetate, Vr = 0.5 cm3, 1000 rpm). Dependence of the initial reaction rate of the forward reaction on the concentration of A. 1 (fixed concentration of 2 was 80.10 mmol dm−3), B. 2 (fixed concentration of 1 was 108.2 mmol dm−3), C. 3 (fixed concentration of 1 and 2 were 108.2 mmol dm−3 and 82 mmol dm−3, respectively). Dependence of the initial reaction rate of the retro-aldol reaction on the concentration of D. 3, E. 2 (fixed concentration of 3 was 300 mmol dm−3), F. 1 (fixed concentration of 3 was 300 mmol dm−3) (black circles – experimental data, line – mathematical model).
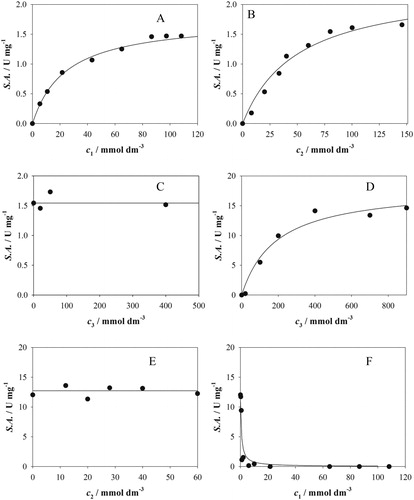
Table 1. Kinetic parameters of the aldol addition of 2 to 1 catalyzed by FSA A129G, FSA A129STable Footnote* and FSA A129S/A165GTable Footnote* in batch reactor.
Aldol addition in batch reactor
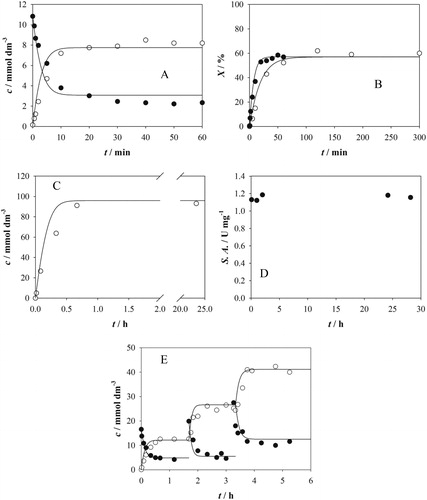
Aldol addition of 2 to 1 was performed in a batch reactor. Various initial conditions were tested for validation of the developed mathematical model. The simulations followed the changes of concentrations of 1 and 3 well, regardless of the initial substrate or enzyme concentration (). Although Vm2 was higher than Vm1 (), the equilibrium is shifted to the formation of 3 due to lower values of Km1 and Km2 than Km3 and owing to the inhibition of the retro-aldol reaction by 1. shows the substrate conversion of two reactions carried out at similar initial concentrations of substrates but at different initial enzyme concentrations. These results indicated, as expected, that the higher the enzyme concentration, the faster the maximum substrate conversion was achieved. On increasing the substrate concentration from 10 to 100 mmol dm−3 the maximum conversion of 1 rose from 76% () to 86% (). Similar behavior was found for FSA A129S and FSA A129S/A165G variants (Sudar et al., Citation2013b). Enzyme activity monitoring during these experiments indicate that FSA A129G was stable during 28 hours of reaction (). This was an improvement as compared with FSA A129S and FSA A129S/A165G variants, since in both cases the activity decreased during reaction; after 28 hours FSA A129S lost 87% of its activity and FSA A129S/A165G lost 27% after 24 hours (Sudar et al., Citation2013b). Since the enzyme investigated in this work was stable during at least 28 hours, a repetitive batch experiment was performed (). After maximum substrate conversion was achieved in the reactor, additional substrates were added two-fold to the reaction mixture to observe if the enzyme in the reactor will be able to continue the catalysis. (). The results indicate that the enzyme can be used in consecutive batches, which enables better utilization of the biocatalyst.
Figure 4. Aldol addition of 2 to 1 catalyzed by FSA A129G in the batch reactor (50 mmol dm−3 TEA HCl buffer, pH 7.5, 10% v/v of ethyl acetate, 25 °C, Vr = 1 cm3, 1000 rpm). A. c1 = 10.83 mmol dm−3, c2 = 10.0 mmol dm−3, γFSA = 10.0 mg cm−3, B. comparison of substrate conversion in two aldol addition reactions carried out at different enzyme concentrations (black circles: c1 = 6.7 mmol dm−3, c2 = 10.0 mmol dm−3, γFSA = 5.0 mg cm−3, white circles: c1 = 7.8 mmol dm−3, c2 = 10.0 mmol dm−3, γFSA = 2.1 mg cm−3), C. c1 = 108.1 mmol dm−3, c2 = 110.0 mmol dm−3, γFSA = 8.4 mg cm−3, D. change of enzyme activity during the reaction in presented in C, 10 µl sample from the batch reactor to start the reaction, 10% v/v of ethyl acetate, Vr = 0.5 cm3, 1000 rpm, c1 = 104.2 mmol dm−3, c2 = 200.9 mmol dm−3. E. repetitive batch reaction (c1 = 16.6 mmol dm−3, c2 = 15.23 mmol dm−3, γFSA = 5.0 mg cm−3, 1 and 2 were added three times).
Aldol addition in microreactor
The aldol addition of 2 to 1 was carried out in two microreactors, one with smooth microchannel walls and 4 µl-volume, and one with rough microchannel walls and 13 µl-volume. A simulation showed good agreement between the model and the collected data in both microreactors (). The two microreactors differ in their inner dimensions and microchannel structure, but the results indicate that these differences did not affect the outcome of the reaction regarding the maximum conversion of 1. This was because, at the highest residence times investigated in this work, the diffusion of all reaction components is complete almost at the beginning of the microchannel and the reaction was, from that point on, kinetically controlled. When lower residence times (i.e. less than 1 min) were used and, therefore, the diffusion of the components was not complete, the maximum substrate conversion was not achieved. Furthermore, since the reaction is kinetically controlled at the range of residence times investigated, the maximum substrate conversion in both microreactor (, black circles) and batch reactor () was achieved at similar residence/reaction time at the same initial substrates and enzyme concentration. Using lower enzyme concentration, the substrate conversion was also lower with similar initial concentration of the substrates (, white circles). Consistent with what was observed in the batch reactor, it would probably take longer residence time for obtaining the maximum conversion of 1 at lower enzyme concentration.
Figure 5. Aldol addition of 2 to 1 catalyzed by FSA A129G in microreactor (50 mmol dm−3 TEA HCl buffer, pH 7.5, 5% v/v of acetonitrile, 25 °C). A. 4 µl microreactor, c1 = 9.6 mmol dm−3, c2 = 6.9 mmol dm−3, γFSA = 10.0 mg cm−3, B. change of enzyme activity during the reaction in microreactor presented in A, 10 µl sample from the microreactor to start the reaction, 10% v/v of ethyl acetate, Vr = 0.5 cm3, 1000 rpm, c1 = 100.95 mmol dm−3, c2 = 201.3 mmol dm−3, C. 13 µl microreactor, black circles: c1 = 11.9 mmol dm−3, c2 = 6.55 mmol dm−3, γFSA = 10.0 mg cm−3, white circles: c1 = 7.4 mmol dm−3, c2 = 5.00 mmol dm−3, γFSA = 1.0 mg cm−3, D. change of enzyme activity during the reaction in microreactor presented in C (black circles), 10 µl sample from the microreactor to start the reaction, 10% v/v of ethyl acetate, Vr = 0.5 cm3, 1000 rpm, c1 = 106.6 mmol dm−3, c2 = 200.6 mmol dm−3.
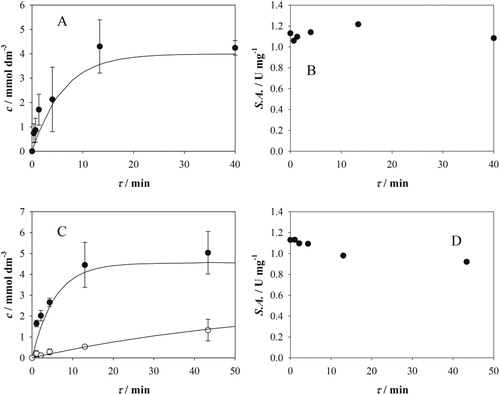
FSA A129G activity was also monitored at the microreactor outlet (, black circles). In microreactor with 4 µl-volume (), the enzyme retained its activity even at the highest residence times (40 min), whereas in microreactor with 13 µl-volume (), the enzyme lost 18 percent of its activity at the highest residence time. In both cases FSA A129G was more stable than FSA A129S and A129S/A165G: they lost 57 and 86% of their activity, respectively, in microreactor at residence time of 60 min (Sudar et al., Citation2013a). Since enzyme concentration in the experiment in was relatively high and the loss of activity was low, it had no influence on the maximum substrate conversion achieved at the highest residence time (). This was also observed from the mathematical model simulations even though enzyme activity decrease was not included.
It is well documented (Ehrfeld et al., Citation2000; Haswell et al., Citation2001; Žnidaršič-Plazl and Plazl, Citation2009; Tušek et al., Citation2012) that microreactors can have a beneficial effect on the time necessary to achieve maximum substrate conversion resulting from better mass transfer. However, in this study this was not the case because the process was kinetically controlled. A similar residence/reaction time was needed for obtaining the maximum conversion of 1 in both microreactor and batch reactor. Thus, the preferred reactor type for this aldol addition reaction catalyzed by FSA A129G was the batch reactor due to its simplicity and the fact that the enzyme maintains its activity during at least 28 hours.
Conclusion
In this work aldolase variant FSA A129G was investigated in the reaction of aldol addition of 2 to 1. The developed mathematical model was validated on independent set of experiments carried out in two reactors: batch reactor and microreactor. FSA A129G catalyzes successfully the reaction in both batch reactor and microreactor and similar residence/reaction time was needed to obtain maximum conversion of 1. The use of a microreactor did not have any beneficial effect on the reaction performance, but on the contrary, the enzyme showed a decrease in its activity at longer residence times in one type of microreactor (13 µl). On the other hand, FSA A129G was stable for 28 hours without any loss of activity in the batch reactor and hence, it was possible to carry out a repetitive batch reaction. Thus, it was concluded that the preferred reactor type for this reaction is the batch reactor. When comparing this enzyme with two previously investigated aldolase variants, FSA A129S and FSA A129S/A165G, regardless of the maximum reaction rates, its superior stability in the batch reactor makes it a better choice as a catalyst for the investigated aldol addition reaction.
| Nomenclature | ||
| c | = | molar concentration, mmol dm−3 |
| DA/B | = | diffusion coefficient, cm2 s−1 |
| Ki | = | inhibition constant, mmol dm−3 |
| Km | = | Michaelis constant, mmol dm−3 |
| qv | = | flow rate, cm3 h−1 |
| r1 | = | reaction rate of enzyme in the aldol addition reaction, mmol dm−3 min−1 |
| r2 | = | reaction rate of enzyme in the retro-aldol reaction, mmol dm−3 min−1 |
| S.A. | = | specific activity, U mg−1 |
| t | = | reaction time, min |
| T | = | temperature, K |
| VA(B) | = | molar volume, cm3 mol−1 |
| Venz | = | enzyme volume, cm3 |
| Vm1 | = | maximum reaction rate of the aldol addition reaction, U mg−1 |
| Vm2 | = | maximum reaction rate of the retro-aldol reaction, U mg−1 |
| Vr | = | reactor volume, cm3 |
| V.A. | = | volume activity, U cm−3 |
| W | = | microchannel width, cm |
| X | = | substrate (aldehyde) conversion, % or - |
| z | = | microchannel length, cm |
| γ | = | mass concentration, mg cm−3 |
| η | = | viscosity, cP |
| v | = | linear velocity, cm s−1 |
| τ | = | residence time, min |
| Cbz | = | benzyloxycarbonyl |
| FSA | = | d-fructose-6-phosphate aldolase |
| HCl | = | hydrochloride acid |
| HPLC | = | high performance liquid chromatography |
| TEA | = | triethanolamine |
| TFA | = | trifluoroacetic acid |
| 1 | = | Cbz-N-3-aminopropanal |
| 2 | = | dihydroxyacetone |
| 3 | = | aldol adduct |
Acknowledgments
The Croatian Ministry of Science Education and Sports and Spanish National Research Council financed this work in the Frame of the ERA-IB project: EIB. 10.012.MicroTechEnz. The support of the Ministerio de Economía y Competitividad (MINECO), the Fondo Europeo de Desarrollo Regional (FEDER) (grant no. CTQ2015-63563-R, and ERA-IB MICINN PIM2010EEI-00607) is acknowledged. Authors thank COST Action CM0701 and Susana Amézqueta for the assessment of purity of the Bioglane S.L.N.E. materials used in this work.
References
- Amézqueta, S., Galan, E., Vila-Fernandez, I., Pumarola, S., Carrascal, M., Abian, J., Ribas-Barba, L., Serra-Majem, L., and Torres, J. L. (2013). The presence of D-fagomine in the human diet from buckwheat-based foodstuffs, Food Chem., 136, 1316–1321.
- Biwer, A. P., Zuber, P. T., Zelić, B., Gerharz, T., Bellmann, K. J., and Heinzle, E. (2005). Modeling and analysis of a new process for pyruvate production, Ind. Eng. Chem. Res. Res., 44, 3124–3133.
- Brass, J. M., Hoeks, F. W. J. M. M., and Rohner, M. (1997). Application of modeling techniques for the improvement of industrial bioprocesses, J. Biotechnol., 59, 63–72.
- Brovetto, M., Gamenara, D., Méndez, P. S., and Seoane, G. A. (2011). C-C bond-forming lyases in organic synthesis, Chem. Rev. Rev., 111, 4346–4403.
- Castillo, J. A., Parella, T., Inoue, T., Sprenger, G. A., Joglar, J., and Clapés, P. (2009). Synthesis of d-fagomine by aldol addition of dihydroxyacetone to N-Cbz-3-aminopropanal catalysed by d-fructose-6-phosphate aldolase. In Practical Methods for Biocatalysis and Biotransformations, eds Whittall, J. and Sutton, P. W., 212–217, John Wiley & Sons, Ltd, Chichester.
- Clapés, P. (2016a). Enzymatic C-C bond formation. In Organic Synthesis Using Biocatalysis, eds Goswami, A. and Stewart, J. D., 285–337, Academic Press, Amsterdam.
- Clapés, P. (2016b). Recent advances in enzyme-catalyzed aldol addition reactions. In Green Biocatalysis, Patel, R., 267–306, John Wiley & Sons, Inc, New Jersey.
- Clapés, P., Fessner, W. D., Sprenger, G. A., and Samland, A. K. (2010). Recent progress in stereoselective synthesis with aldolases, Curr. Opin. Chem. Biol., 14, 154–167.
- Clapés, P., and Garrabou, X. (2011). Current trends in asymmetric synthesis with aldolases, Adv. Synth. Catal., 353, 2263–2283.
- Clapés, P., and Joglar, J. (2013). Enzyme-catalyzed aldol additions. In Modern Methods in Stereoselective Aldol Reactions, eds. Mahrwald, R., 475–527, Wiley-VCH, Weinheim.
- Ehrfeld, W., Hessel, V., and Löwe, W. (2000). Microreactors – New Technology for Modern Chemistry, Wiley-VCH, Weinheim.
- Findrik, Z., Presečki, A. V., and Vasić-Rački, Đ. (2010). Mathematical modeling of maltose hydrolysis in different types of reactor, Bioprocess Biosyst. Eng., 33, 299–307.
- Garrabou, X., Castillo, J. A., Guérard-Hélaine, C., Parella, T., Joglar, J., Lemaire, M., and Clapés, P. (2009). Asymmetric self- and cross-aldol reactions of glycolaldehyde catalyzed by D-fructose-6-phosphate aldolase, Angew. Chem. Int. Ed. Engl., 48, 5521–5525.
- Gómez, L., Molinar-Toribio, E., Calvo-Torras, M. Á., Adelantado, C., Juan, M. E., Planas, J. M., Cañas, X., Lozano, C., Pumarola, S., Clapés, P., and Torres, J. L. (2012). D-Fagomine Lowers postprandial blood glucose and modulates bacterial adhesion, Br. J. Nutr., 107, 1739–1746.
- Güclü, D., Szekrenyi, A., Garrabou, X., Kickstein, M., Junker, S., Clapés, P., and Fessner, W.-D. (2016). Minimalist protein engineering of an aldolase provokes unprecedented substrate promiscuity, ACS Catal., 6, 1848–1852.
- Guérard-Hélaine, C., Debacker, M., Clapés, P., Szekrenyi, A., Hélaine, V., and Lemaire, M. (2014). Efficient biocatalytic processes for highly valuable terminally phosphorylated C5 to C9 D-ketoses, Green Chem, 16, 1109–1113.
- Haswell, S. J., O'Sullivan, B., and Styring, P. (2001). Kumada-Corriu reactions in a pressure-driven microflow reactor, Lab Chip., 1, 164–166.
- Heitzig, M., Linninger, A. A., Sin, G., and Gani, R. (2014). A computer-aided framework for development, identification and management of physiologically-based pharmacokinetic models, Comput. Chem. Eng., 71, 677–698.
- Hernández, K., Joglar, J., Bujons, J., Parella, T., and Clapés, P. (2018). Nucleophile promiscuity of engineered class II pyruvate aldolase YfaU, from E. coli. Angew. Chem. Int. Ed. Engl, 57(14), 3583–3587.
- Hernández, K., Parella, T., Petrillo, G., Usón, I., Wandtke, C. M., Joglar, J., Bujons, J., and Clapés, P. (2017). Intramolecular benzoin reaction catalyzed by benzaldehyde lyase from Pseudomonas fluorescens biovar I, Angew. Chem. Int. Ed. Engl., 56, 5304–5307.
- Hernández, K., Zelen, I., Petrillo, G., Usón, I., Wandtke, C. M., Bujons, J., Joglar, J., Parella, T., and Clapés, P. (2015). Engineered L-serine hydroxymethyltransferase from Streptococcus thermophilus for the synthesis of α,α-dialkyl-α-amino acids, Angew. Chem. Int. Ed. Engl., 54, 3013–3017.
- Mahrwald, R. (2004a). Modern Aldol Reactions, Vol. 1. Enolates, organocatalysis, biocatalysis and natural product synthesis, Wiley-VCH, Weinheim.
- Mahrwald, R. (2004b). Metal catalysi. In Modern Aldol Reactions. Vol. 2, Wiley-VCH, Weinheim.
- Mahrwald, R. (2013). Modern Methods in Stereoselective Aldol Reactions, Wiley-VCH, Weinheim.
- Mathys, R. G., Schmid, A., and Witholt, B. (1999). Integrated two-liquid phase bioconversion and product-recovery processes for the oxidation of alkanes: Process design and economic evaluation, Biotechnol. Bioeng. Bioeng., 64, 459–477.
- Müller, M. (2012). Recent developments in enzymatic asymmetric C-C bond formation, Adv. Synth. Catal., 354, 3161–3174.
- Müller, M., Sprenger, G. A., and Pohl, M. (2013). CC bond formation using ThDP-dependent lyases , Curr. Opin. Chem. Biol., 17, 261–270.
- Oroz-Guinea, I., and García-Junceda, E. (2013). Enzyme catalysed tandem reactions, Curr. Opin. Chem. Biol., 17, 236–249.
- Ramos-Romero, S., Molinar-Toribio, E., Gómez, L., Pérez-Jiménez, J., Casado, M., Clapés, P., Piña, B., and Torres, J. L. (2014). Effect of (D)-fagomine on excreted enterobacteria and weight gain in rats fed a high-fat high-sucrose diet, Obesity, 22, 976–979.
- Ringborg, R. H., and Woodley, J. M. (2016). The application of reaction engineering to biocatalysis, React. Chem. Eng., 1, 10–22.
- Roldán, R., Sanchez-Moreno, I., Scheidt, T., Hélaine, V., Lemaire, M., Parella, T., Clapés, P., Fessner, W. D., and Guérard-Hélaine, C. (2017). Breaking the dogma of aldolase specificity: Simple aliphatic ketones and aldehydes are nucleophiles for fructose-6-phosphate aldolase, Chem. Eur. J., 23, 5005–5009.
- Saravanan, T., Junker, S., Kickstein, M., Hein, S., Link, M. K., Ranglack, J., Witt, S., Lorilliere, M., Hecquet, L., and Fessner, W. D. (2017). Donor promiscuity of a thermostable transketolase by directed evolution: Efficient complementation of 1-deoxy-D-xylulose-5-phosphate synthase activity, Angew. Chem. Int. Ed. Engl., 56, 5358–5362.
- Scheibel, E. G. (1954). Correspondence. Liquid diffusivities. Viscosity of gases, Ind. Eng. Chem., 46, 2007–2008.
- Schmidt, N. G., Eger, E., and Kroutil, W. (2016). Building bridges: Biocatalytic C-C-bond formation toward multifunctional products, ACS Catal., 6, 4286–4311.
- Schürmann, M., and Sprenger, G. A. (2001). Fructose-6-phosphate aldolase is a novel class I aldolase from Escherichia coli and is related to a novel group of bacterial transaldolases, J. Biol. Chem., 276, 11055–11061.
- SCIENTIST handbook. (1986–1995). Micromath, Salt Lake City, UT.
- Soler, A., Garrabou, X., Hernández, K., Gutiérrez, M. L., Busto, E., Bujons, J., Parella, T., Joglar, J., and Clapés, P. (2014). Sequential biocatalytic aldol reactions in multistep asymmetric synthesis: Pipecolic acid, piperidine and pyrrolidine (homo)iminocyclitol derivatives from achiral building blocks, Adv. Synth. Catal., 356, 3007–3024.
- Soler, A., Gutiérrez, M. L., Bujons, J., Parella, T., Minguillon, C., Joglar, J., and Clapés, P. (2015). Structure-guided engineering of D-fructose-6-phosphate aldolase for improved acceptor tolerance in biocatalytic aldol additions, Adv. Synth. Catal., 357, 1787–1807.
- Sudar, M., Findrik, Z., Vasić-Rački, Đ., Clapés, P., and Lozano, C. (2013a). Aldol addition of dihydroxyacetone to N-Cbz-3-aminopropanal catalyzed by two aldolases variants in microreactors, Enzyme Microb. Technol., 53, 38–45.
- Sudar, M., Findrik, Z., Vasić-Rački, Đ., Clapés, P., and Lozano, C. (2013b). Mathematical model for aldol addition catalyzed by two D-fructose-6-phosphate aldolases variants overexpressed in E. coli, J. Biotechnol., 167, 191–200.
- Szekrenyi, A., Garrabou, X., Parella, T., Joglar, J., Bujons, J., and Clapés, P. (2015). Asymmetric assembly of aldose carbohydrates from formaldehyde and glycolaldehyde by tandem biocatalytic aldol reactions, Nature Chem., 7, 724–729.
- Szekrenyi, A., Soler, A., Garrabou, X., Guérard-Hélaine, C., Parella, T., Joglar, J., Lemaire, M., Bujons, J., and Clapés, P. (2014). Engineering the donor selectivity of D-fructose-6-phosphate aldolase for biocatalytic asymmetric cross-aldol additions of glycolaldehyde, Chem. Eur. J., 20, 12572–12583.
- Tufvesson, P., Fu, W., Jensen, J. S., and Woodley, J. M. (2010). Process considerations for the scale-up and implementation of biocatalysis, Food Bioprod. Process., 88, 3–11.
- Tušek, A., Šalić, A., Kurtanjek, Ž., and Zelić, B. (2012). Modeling and kinetic parameter estimation of alcohol dehydrogenase-catalyzed hexanol oxidation in a microreactor, Eng. Life Sci., 12, 49–56.
- Tušek, A. J., Tišma, M., Bregović, V., Ptičar, A., Kurtanjek, Ž., and Zelić, B. (2013). Enhancement of phenolic compounds oxidation using laccase from trametes versicolor in a microreactor, Biotechnol. Bioproc. Eng., 18, 686–696.
- Vasić-Rački, Đ., Bongs, J., Schörken, U., Sprenger, G. A., and Liese, A. (2003). Modeling of reaction kinetics for reactor selection in the case of L-erythrulose synthesis, Bioprocess Biosyst. Eng., 25, 285–290.
- Vasić-Rački, Đ., Findrik, Z., and Vrsalović Presečki, A. (2011). Modeling as a tool of enzyme reaction engineering for enzyme reactor development, Appl. Microbiol. Biotechnol., 91, 845–856.
- Vasić-Rački, Đ., Kragl, U., and Liese, A. (2003b). Benefits of enzyme kinetics modelling, Chem. Biochem. Eng. Q., 17, 7–18.
- Windle, C. L., Muller, M., Nelson, A., and Berry, A. (2014). Engineering aldolases as biocatalysts, Curr. Opin. Chem. Biol., 19, 25–33.
- Young, M. E., Carroad, P. A., and Bell, R. L. (1980). Estimation of diffusion coefficients of proteins, Biotechnol. Bioeng., 22, 947–955.
- Zimmermann, V., Hennemann, H.-G., Daussmann, T., and Kragl, U. (2007). Modelling the reaction course of N-acetylneuraminic acid synthesis from N-acetyl-D-glucosamine-new strategies for the optimisation of neuraminic acid synthesis, Appl. Microbiol. Biotechnol., 76, 597–605.
- Žnidaršič-Plazl, P., and Plazl, I. (2009). Modelling and experimental studies on lipase-catalyzed isoamyl acetate synthesis in a microreactor, Process Biochem., 44, 1115–1121.