Abstract
In New Zealand and worldwide, growers are increasingly being required to demonstrate that their nutrient management does not have adverse effects on the environment. Since routine direct measurements of nitrogen (N) losses at an appropriate scale are currently unfeasible, a modelling tool that can be used to assess losses, both actual and potential, from farming systems is therefore needed. We present the upgraded N balance module for cropping systems (OVCrop) developed to be incorporated into the OVERSEER® Nutrient Budgets model. It presents an easy-to-use interface, requiring few but meaningful inputs, with the minimum flexibility needed to describe management of real farming systems. Following the developmental guidelines of OVERSEER® Nutrient Budget, OVCrop is designed to provide the long-term annual average of N leaching from any user-defined cropping rotation. OVCrop has been parameterized based on process-based model simulations for typical farm systems and environments of New Zealand. The intended use of the OVCrop is to help on-farm nutrient management and to demonstrate future compliance to N leaching regulations. OVCrop is a robust tool, simple enough to be used by people with a low to medium level of expertise, such as farmers and regional councils.
Introduction
The need for a nitrogen balance tool
Agriculture is an important sector of New Zealand's economy, contributing to about 50% of New Zealand's export earnings (Statistics New Zealand Citation2007). Its competitiveness in the world market has been maintained by significant gains in productivity, mostly driven by land-use intensification. This intensification has been sustained by practices such as the use of fertilizers and irrigation, which also increases the potential for nutrient losses. Limiting such losses is highly desirable as they represent an economic cost to growers and may also cause environmental damage.
The impact of agricultural activities on the environment is a matter of increasing public concern in New Zealand and worldwide (Kroeze et al. Citation2003; Oenema et al. Citation2003; Parliamentary Commissioner for the Environment Citation2004; Shepherd & Chambers Citation2007; Skinner Citation2007). Land-use regulation in New Zealand is largely output driven, that is, the legislations focuses on the effects of a land activity rather than on the impact of nutrient inputs to that land. As a result of these regulations, growers are increasingly being required to demonstrate that their management does not have adverse effects on the environment (Öborn et al. Citation2003; Dragten & Thorrold Citation2005; Agricultural Nitrogen Managers Group Citation2006). Few regional councils in New Zealand are proposing guidelines with strict nutrient management practices, with limits on nitrogen (N) concentration in the leachate under farming systems. These initiatives, and similar others around the world, raise an important issue: how to assess the effects of current management as well as alternatives in order to demonstrate compliance to such guidelines.
There is a need therefore for tools that can be used to assess nutrient losses, both actual and potential, from farming systems. Routine direct measurements of N losses at an appropriate scale are currently not feasible. They are time consuming, costly, and present high variability at farm scale. It is not surprising therefore, that the use of computer models for assessing and monitoring nutrient losses is gaining recognition as a more suitable alternative to measurements (Ledgard et al. Citation2004; Veihe et al. Citation2006; Langeveld et al. Citation2007; Monaghan et al. Citation2007; Delgado et al. Citation2008).
Current tools and necessary developments
Any tool required for monitoring and compliance should be simple enough to be used by people with a low to medium level of expertise, such as farmers and regional councils, and should be operated using easily gathered input data. The most widely accepted farm-scale nutrient budgeting tool developed for New Zealand conditions is the OVERSEER® Nutrient Budgets modelFootnote1 (Ledgard et al. Citation1999; Wheeler et al. Citation2003 ,Citation2006). The OVERSEER® Nutrient Budgets model (hereafter referred to as ‘Overseer’) has been widely used in the pastoral sector for predicting the N balance of farming systems. Overseer is built using quasi-empirical relationships and internal databases based on research conducted in New Zealand. The model estimates the nutrient inputs and outputs at paddock or farm scale and presents these as a nutrient budget. The model assumes that best management practices are followed and produces estimates of long-term averages on an annual basis. This approach allows a relatively simple-to-use interface with inputs and outputs familiar to most end-users (farmers, consultants, regional councils, etc.). The Overseer model was developed initially to aid with nutrient management in pastoral farms from a production perspective (Ledgard et al. Citation1999). Later it has been updated and used for improving nutrient-use efficiency, evaluating some mitigation options, and estimating nutrient outputs to the environment (Ledgard et al. Citation2001; Wheeler et al. Citation2006 ,Citation2009). Although Overseer has horticulture and cropping modules, they have not been as widely tested or updated as frequently as the pastoral module.
To estimate fairly the nutrient balance of cropping systems, a sub-annual time-step has to be used to capture adequately the effect of the various cultural and management events. Cropping systems are dynamic, with dramatic disparity in both the timing and extent of crop status (soil cover, root depth, N uptake pattern) and management events (tillage, irrigation and fertilizer) over the year. This system also involves multiple crops within a rotation. These factors may vary substantially between paddocks and years, depending on the rotation and management applied. The timing of fertilizer and irrigation applications in relation to the plant demand has an important influence on the nutrient balance of cropping systems, and therefore estimation of nutrient balance on an annual basis may not fairly capture these timing effects. A review on the current Overseer crop and horticulture modules and the needs of regional councils and the industry has been conducted recently (Agricultural Nitrogen Managers Group Citation2006). It was concluded that the existing Overseer modules were neither robust nor easy enough to use to be adopted for monitoring N losses on a scale required for compliance assessment for arable farms.
The need for a major upgrade of the mechanism of these modules and their interface was identified. While it was clear that a more detailed mechanism was necessary to capture paddock specific variation, this had to be balanced with the need to keep the model simple so it is easy to set up and use. It was expected that simplicity would not compromise the accuracy of the tool, as simple quasi-empirical models have been shown to be as good as process-based models at predicting medium to large-scale phenomena (Addiscott Citation1995; Watson & Atkinson Citation1999; Schlecht & Hiernaux Citation2005; Adams Citation2007).
Here we present the upgraded N balance module for cropping systems that has been developed to be incorporated in the Overseer model. We describe the model outline (herein referred to as the upgraded Overseer crop model, OVCrop) and the approaches taken to quantify and test its mechanisms and parameters.
Approach used for development and validation
One of the reasons that the cropping module for Overseer has not been upgraded as frequently as the pastoral module is the lack of appropriate long-term data to quantify the nutrient balance under cropping systems. The approach decided upon for this upgrade was to use results from detailed process-based models to determine simplified empirical functions for the Overseer modules. Process-based models, such as LUCI (land use change and intensification) (Jamieson et al. Citation2003a; Li et al. Citation2007; Zyskowski et al. Citation2007a) and SPASMO (Green et al. Citation2004; Rosen et al. Citation2005), have been developed and validated against short-term experimental data in New Zealand. A relatively high number of input data and parameters are required when using these models; also a high level of user expertise is needed to ensure that reliable results are produced. Typically, process-based models are used in research and consulting and not suited for widespread use in compliance monitoring. However, the use of results from validated process-based models has been advocated as surrogate for the lack of measured data when developing or testing simpler models (Young et al. Citation1996; Khaither & Erechtchoukova Citation2007). For the development of OVCrop, LUCI framework model simulations were used to devise simple relationships and to estimate their parameters. This is a means of extrapolating from basic principles of plant and soil processes and short-term validations to produce synthetic long-term average data.
The LUCI framework model
LUCI is a model framework for simulating plant growth and soil processes, such as water and N balances, at paddock scale with different land uses and management systems (Jamieson et al. Citation2006a; Zyskowski et al. Citation2007a). It is a daily time-step process-based model framework built combining a series of crop and soil models developed by Plant and Food Research (Jamieson et al. Citation1998 ,Citation2006b; Zyskowski et al. Citation2004; Li et al. Citation2006 ,Citation2007). Several of these models have been extensively used for tactical irrigation and fertilizer management. The integration of these models into the LUCI framework allows the simulation of crop rotations and the analysis of the effects of land-use changes over time.
The crop calculators and therefore LUCI were built based on sound knowledge about the various processes involved in plant growth and the movement of water and solutes in the soil. These models have been tested (e.g. Jamieson et al. Citation1998 ,Citation2003a ,Citationb; Armour et al. Citation2002; Li et al. Citation2006) and successfully applied in a range of studies (Snow et al. Citation2007a ,Citationb; Zyskowski et al. Citation2007b).
Model description
Overview
The OVCrop was designed to provide reliable estimates of long-term annual N leaching from any user-specified cropping rotation. As the intended use of the OVCrop is to demonstrate future compliance to N leaching regulations, long-term average weather data and databases with generalized plant and soil parameters are used to set up the simulations. Leaching was defined as the N percolating below 1.5 m depth, the maximum root depth of most crops grown in New Zealand. The soil is assumed to be homogeneous down to a gravel layer. Calculations are done on a monthly basis and comprise two years. The first year is set up to represent the management prior to the year being assessed. Running the calculations for the previous year gives an estimate of the soil status N for the start of the assessed year, reducing the need for soil measurements. It also accounts for the effect of residuals from previous crops. Monthly calculations are considered short enough to capture the effects of management when reporting on an annual time-step. Only the annual amount of N leaching corresponding to the second year is reported by OVCrop.
The information supplied via the user interface includes the farm location, which determines, from internally stored databases, the monthly averages of rainfall, potential evapotranspiration and air temperature. These can be modified by the user. The user also specifies the appropriate soil type and the depth to the gravel layer. These are linked to a database of parameters that define the soil water storage capacity, derived from the NZ national soils database (Wilde Citation2003), and the soil specific parameters used to predict drainage and leaching. Land-use history is specified as a simple description of the proportion of the 10 years prior to the assessment that the paddock has been under pastoral use (τ YiP ). Finally, the rotation description (crop type, sowing month, tillage type, residue treatment, irrigation, and fertilization schedules) must be given. The key input specified in the crop rotation is the expected yield which is used to calculate crop N removal and N returns as crop residual, including roots. The user inputs, provided via the interface, are linked to the internal parameters that provide the basis for crop and soil calculations.
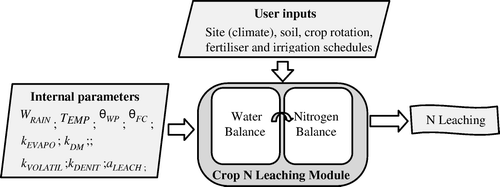
The OVCrop has two core procedures, one for computing the water balance and providing estimates of drainage, and the other for evaluating the N balance and the amount of leaching (). The main formulae are presented hereafter, full description are to be incorporated in the model's documentation.
Fig. 1 Flowchart of the proposed OVCrop module for N leaching estimation.
Water balance
The soil water balance, for a given month m, is described by Equation Equation1:
The monthly irrigation amounts can be computed based on an irrigation method chosen or can be given directly provided by the user. For rainfall, the annual average is a user input while the monthly distribution is obtained from an internal database linked to the selected location and user inputs describing seasonality patterns. Evaporation and transpiration are taken as the minimum between the water demand and the water supply. The water demand is given by the potential evapo-transpiration (E TP ) and is partitioned between evaporation and transpiration in relation to crop cover (k COVER ). The water supply in any month is given by the sum of W IRRIG and W RAIN plus, for transpiration, the available water in the root zone (W SOIL_RZ ), which is a function of soil type, stoniness and crop age (root depth):
The amount of water lost via drainage is any volume above the soil storage at field capacity (W FC ):
Nitrogen balance
The balance of mineral N in the soil is described, for each month, m, by Equation Equation5:
The fertilizer amount is given by the user. The amount of fertilizer N volatilized is then estimated from a relationship based on a summary of data from New Zealand which includes monthly temperature and rainfall, and soil and cover terms (Woodward Citation2007). The N inputs via rainfall and irrigation are computed based on the water amounts and their N concentrations, set as internal parameters. Denitrification is estimated as a function of the soil water content and temperature (Eq. Equation6):
Fig. 2 (a) Temperature factor (f TEMP ) for a range of mean monthly temperatures used in OVCrop. Dashed line is the scaled f TEMP used in the calculation of denitrification. (b) The soil organic matter mineralization factor (f SOM ) over time for two values of years in pasture (τ YiP ).
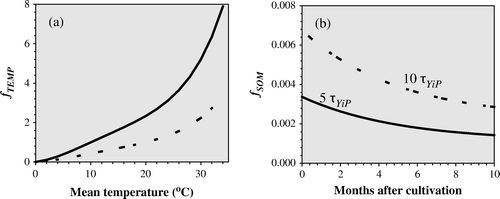
The mineralization from the soil organic matter (N SOM ) is calculated from the amount of soil organic N (N ORG ) following a first order decomposition function, and is influenced by soil water content and temperature (Equation Equation7):
The crop N demand is calculated from the yield specified by the user. Parameters describing the moisture content of the harvested product and the proportion of total biomass that is harvested (harvest index) are used to calculate the shoot biomass and a fixed root proportion is used to calculate root biomass. Monthly N uptake is then calculated from the proportion of final biomass that is grown each month and internal parameters specifying typical N concentrations of various crops. These are calculated using crop specific parameters. Generic crop parameters such as moisture content of the harvested fraction, root depth, nitrogen content of plant parts and root proportion were obtained from the literature for most crops and complemented with expert opinion when no literature could be found. The two main sources of information in the literature were the reports of Thomas et al. (Citation2008) and Rahn et al. (Citation2007). The relationship describing the temporal pattern of biomass accumulation for different crops is described below.
The total amount of N left in the field as residue is the sum of the N in the roots and stover left in the field. The amount of stover N is the product of shoot biomass yield not harvested, the N content of the stover, and a removal factor, which is function of the residue management (grazing, baling, burning, etc.). Stover and roots are considered in the residue when cultivation or harvest occurs. This also includes stover and roots from pasture when it is cultivated for cropping.
The amount of N mineralized from the residues after cultivation (N RESIDUE ) follows a decay function similar as for N SOM (Equation Equation7), but the decay constant is proportional to the N concentration of the residue (Rahn & Lillywhite Citation2002).
The amount of N lost via leaching is given by the product of the available N in the soil:
The term N SHORTAGE was included to ensure closure of the N balance and enable an opportunity for feedback on the feasibility of the system being evaluated. When the crop demand (from user-specified yield) is higher than the supply (from user-specified fertilizer inputs, paddock history and residue management) the model computes a shortage of N (N SHORTAGE , the difference between N demand and supply). When the shortage is small, the actual outcome would be a reduction in the N content of the crop. A reduction in yield would occur with larger shortages. However, the model has not been designed to account for variation in N content of the crop and as yield is user specified it cannot be adjusted by the model. Instead N SHORTAGE is flagged, giving the opportunity for users to review their inputs. Small values of N SHORTAGE may be attributed to variations in crop N concentration or uncertainties in N mineralization and therefore can be disregarded. However, when the N SHORTAGE value is large, the crop yield given by the user is not possible with the specified N inputs. In this case, the model stops the calculations and prompts the user to review the yield and/or fertilizer inputs.
Estimation of the model parameters
Material and methods
To estimate the parameters for OVCrop, a series of simulations using the LUCI model were performed. For these simulations, climate data measured (NIWA weather stations) between 1974 and 2002 from four distinct sites in New Zealand—Lincoln (43° 39 ′S, 172° 29 ′E), Gisborne (38° 39 ′S, 178° 00 ′E), Levin (40°38 ′S, 175°16 ′E) and Hamilton (37°47 ′S, 175° 17 ′E)—were used. These sites cover a wide range of temperature and rainfall distribution in important cropping regions. For each location, the soil was defined by one of the three generic texture classes (light, medium and heavy) and four depths to the gravel layer, which gave a variety of soil water storage capacities ().
Table 1 Soil water storage (mm) of the generic soils used in the simulations to derive the parameter values of OVCrop
Simulations were run for each site with treatments of different land uses including continuous fallow or different crop types planted at different times. Fallow, spring wheat, maize and potatoes were the crop types used for the leaching analysis. The simulations were run over the entire period of available climate data and were re-initialized every year. The treatments within each land use were a factorial combination of fertilizer application amounts (60, 150 or 450 kg N ha−1 yr−1, split into three applications) and irrigation (0, 300 and 600 mm/year, applied from October to April).
For the data analysis, the daily results from the LUCI model were first aggregated on a monthly basis. Analysis of variance (ANOVA) was then employed to verify the significance of the various factors and regression analysis was used to estimate the model parameters.
Results
Crop coefficients
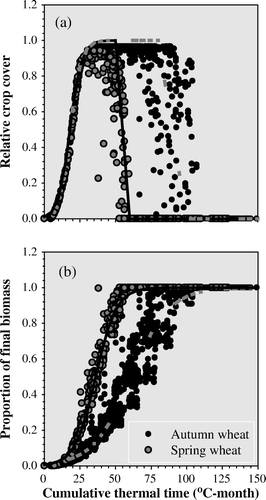
The temporal pattern of crop cover and relative biomass accumulation were quantified in relation to thermal time for all crop species and planting times using a sigmoid function. A linear function was used for crop cover in the senescence phase. For a number of crops that do not have working models, the parameters were assumed from crops with similar growth patterns and adjusted for major differences such as duration and maximum cover. Examples of these relationships for spring and autumn sown wheat are displayed in and information for other crops can be found in (Wheeler et al. Citation2009). Location had no apparent effect on the form of these relationships, showing that thermal time is a suitable variable to account for differences in the timing of crop development observed at different places. While the same function was used for all crops and planting times, the specific parameters varied substantially depending on the crop type, especially due to duration and growth pattern (how quickly it closes its canopy and when senescence and maturity occur). A simple method to modify the crop growth parameters was also developed to take account of defoliation, for example in winter-sown wheat, seed crops and forage crops. Defoliation could be by cut-and-carry or by animal grazing. The model estimates N leaching loss from animal excreta separately.
Fig. 3 Relative crop cover (a) and relative biomass accumulation (b) factors in relation to cumulative thermal time for spring and autumn wheat. Lines represent the model used in OVCrop.
Evaporation
To determine the values of k EVAPO , only simulations with a fallow land use were considered. This was done to avoid the disturbance of the effects of variable crop cover. Because k EVAPO only takes effect when the water inputs are greater than the evaporative demand (Equation Equation2) the data were also filtered to remove months that did not satisfy this condition. The relationship between the E TP and the evaporation calculated by the LUCI model for these months was then analysed. This relationship, although quite scattered, clearly deviated from the 1:1 line over the year (). The analysis of variance showed that this deviation varied mostly between months and was not significantly influenced by any combination of location, irrigation or soil type (). The slope of this relationship represents k EVAPO , which is varied by month in OVCrop, ranging from 1.0 in winter (June to August), to around 0.5 in January and February.
Fig. 4 Relationship between the potential evapotranspiration and the soil evaporation simulated by LUCI over 25 years under bare soil conditions, for three different months. The dotted lines have the intercept as the origin and slope representing k EVAPO . The continuous line represents the 1:1 relation.
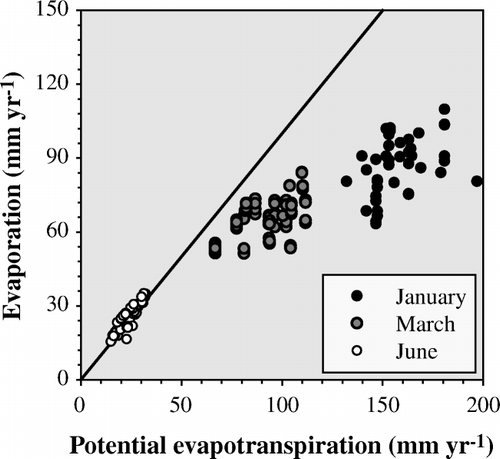
Table 2 Analysis of variance for the main factors influencing evaporation in months when evaporation demand was higher than water inputs. The response variable was W EVAPO /E TP a
Leaching
The relationship between drainage and leaching simulated by the LUCI model exhibited considerable scatter which increased with the magnitude of drainage (a). The variability between different scenarios was reduced considerably when drainage was scaled by soil water storage at field capacity and leaching was scaled by leacheable N (the sum of mineral N in the soil at the start of the month plus the N inputs minus the N outputs). The ratio between N leaching and leacheable N is equal to f LEACH (Equation Equation8). The scatter of this relationship, however, still increased as drainage values increased, so a logarithmic transformation was used before fitting parameters to quantify f LEACH (b).
Fig. 5 (a) Relationship between drainage and N leaching estimated by the LUCI model for the Lincoln site and two soil types over a series of scenarios (see text for details). (b) the relationship, on a logarithmic scale, between the drainage scaled to the soil water storage at field capacity and the ratio between N LEACH (leaching) and N LEACHEABLE (the sum of soil mineral nitrogen at the start of the month and nitrogen inputs and removals during the month).
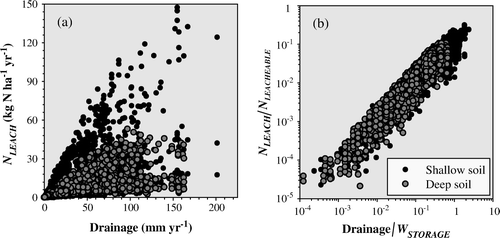
The analysis of variance showed that the ratio between N leaching and leacheable N was strongly related to the amount of water drained (). The correlation with soil type was also considerable even though the ratio between the drainage and the soil water storage at field capacity was used to reduce the effect of soil. Other factors, such as site, month of year, crop type and the timing or amount of fertilizer or irrigation did not exhibit significant effect on f LEACH . Therefore, the use of Equation Equation8 with its parameters (a LEACH and b LEACH ) varying for soil properties (texture and depth to the gravel layer) was considered a suitable function for predicting f LEACH . Regression analysis (REML) was then used to determine the values of a LEACH and b LEACH .
Table 3 Analysis of variance for the main factors influencing N leaching. The response variable was set as log(N LEACH /N LEACHABLE )a
The estimated values of a LEACH were in the range between 0.07 and 0.21, and there was no clear tendency in their variation, apart from the heavy soil which showed smaller values for most of the depths analysed. A value of 0.941 was found for the b LEACH parameter for all soil types.
Model evaluation
Material and methods
Comparison against LUCI simulations
Due to a shortage of annual measurements of N leaching at 1.5 m depth below cropping systems, a preliminary evaluation of OVCrop was conducted by comparing its N leaching estimates with those of the parent model. A set of simulations (independent of the simulations used to develop OVCrop) were conducted over a range of scenarios. Simulations were run using the LUCI model for each year from 1975 and 2000 at three sites in New Zealand—Pukekohe, 37°13 ′S, 174° 52 ′E; Hastings, 39° 40 ′S, 176° 51 ′E; and Gore, 46° 08 ′S, 168° 56 ′E). Climate data for these sites were obtained from the NIWA interpolated VCS dataset (Tait & Turner Citation2005; Cichota et al. Citation2008). For LUCI, daily data were employed, while monthly summaries were produced for the new model. All comparisons used two generic soils, defined by the light and heavy textural classes and 1.5 m depth to gravels (), four land uses (fallow, spring wheat, autumn wheat and potato), three irrigation levels (0, 300 and 600 mm, split evenly in six applications over the spring/summer period) and three fertilizer treatments (60, 150 and 450 kg N ha−1, split in three applications – at sowing and another two throughout the cropping season). All simulations were run over the 25-year period, but were re-initialized every year, thus the combination of years and sites resulted effectively in 75 different weather treatments.
For evaluating the general agreement between the models, the annual totals from both models were compared using scatter plots (with the 1:1 line) and some agreement measures, including the general bias (GB,%), the mean absolute error (MAE) and the coefficient of determination (R2).
Comparison against measured data
The data for this comparison were obtained from an experiment conducted at Plant and Food Research in Lincoln, NZ (43°39 ′S, 172° 29 ′E). The experiment aimed to determine leaching losses from different crop rotations. The soil was a Templeton silt loam, which can be described as a medium soil, >1.5 m deep. The experiment was a completely randomized design with eight replicates of 12 treatments. Treatments were a factorial combination of two rotations (), two irrigation regimes and three nitrogen fertilizer rates. The irrigation treatments represented low (368 mm) and high (643 mm) application amounts in the 2005/06 irrigation season and a single rate (∼ 250 mm for both treatments) applied at different trigger deficits in the 2006/07 irrigation season. The nitrogen treatments were zero, low and high rates of fertilizer. The low treatments received 200 kg of N for potato crops and 150 kg N for the wheat and pea crops. The high N treatments received double the amount of fertilizer applied to the low treatments.
Table 4 Time line of the two crop rotation treatments (R1 and R2) during two seasons (S1 and S2) of the experiment used in the model evaluation
Drainage was calculated from a water balance using measured (TDR and neutron probe) changes in soil water content and the nitrate concentration of drainage water was measured at 1.5 m depth using duplicate ceramic cup solution samplers in each plot.
OVCrop was initialized the year before the beginning of this trial and run for each treatment until the end of 2006. This gave two annual cycles in which leaching predicted from the OVCrop could be compared with measured values. The paddock history was 8 of the previous 10 years in pasture. Crop yields and initial soil mineral N values were set in accordance with measured values for each treatment.
Results
Comparison against LUCI simulations
Testing water balance and leaching from bare soil
These comparisons use the results from the simulations under fallow only. Estimates of evaporation, drainage, soil mineral N and N leaching from OVCrop showed good agreement with predictions from the LUCI model ( and ). For the water balance, the overall bias was just over 2% and -3% for evaporation and drainage, respectively. The values of MAE around 70 mm, or about 10% of the annual average, can be considered reasonably small. The agreement measures for the nitrogen balance were also very good, with GB under 2% and MAE just under 14 kg ha−1 yr−1 (). The high R2 values confirm the good performance of OVCrop.
Fig. 6 Comparison of the annual estimates of drainage and N leaching under bare soil obtained using the OVCrop module and the LUCI framework for three sites in New Zealand. Points from each site represent a range of treatments and years. Diagonal line is the 1:1.
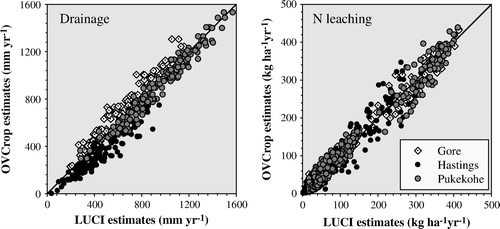
Table 5 Measures of agreement between annual values of evapotranspiration, drainage, change in soil mineral N, and N leaching from simulations of bare soil and crop rotations using OVCrop and the LUCI model
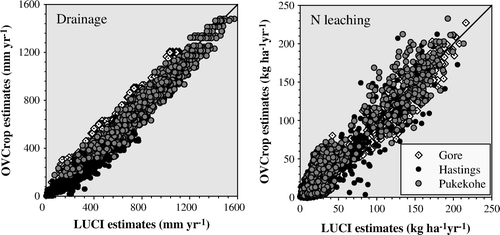
Testing water balance and leaching from crop rotation
The estimates of drainage and evapotranspiration under crop rotations using the OVCrop agreed reasonably well with the results from the LUCI model () and the measures of agreement showed similar magnitude to those from the bare soil simulations ( and ). There was also reasonably good agreement in predictions of soil mineral N and N leaching under crop rotation (), but results were more scattered when compared with the bare ground treatments (). The increased scatter may result from inaccuracies on the estimation of crop cover which affect the estimation of the water balance, or the simplified N uptake routine of the new module which tends to over-predict N uptake at lower N supplies.
Fig. 7 Comparison between annual values of drainage and N leaching under crop rotation estimated by OVCrop and the LUCI framework for three sites in New Zealand. Points from each site represent a range of treatments and years. Diagonal line is the 1:1.
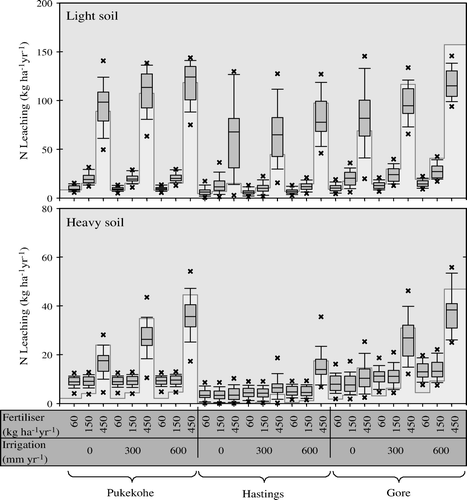
Comparing long-term averages of drainage and leaching.
The values of annual drainage and N leaching estimated by the OVCrop using long-term averaged weather data were nearly all within the variation range of the LUCI results, but tended to underestimate drainage at the driest site, Hastings (). This can be attributed to the use of averaged weather data in the OVCrop, which smoothes the extremes in rainfall that give a substantial contribution to drainage in dry environments like Hastings. Leaching also tended to be under-predicted by the OVCrop on the heavy soil, especially at low levels of N application (). This under-prediction was evident for crop treatments but not for fallow treatments, suggesting it can be attributed to an over-estimation of N uptake in these treatments by the simplified procedure of the proposed module.
Fig. 8 Variability of N leaching predicted by the LUCI model over 25 years (boxplots) and the predictions by the OVCrop module using average weather data (bars) for three sites and two soil types. Data are from a series of spring wheat scenarios with different irrigation and fertilizer levels (see text for details).
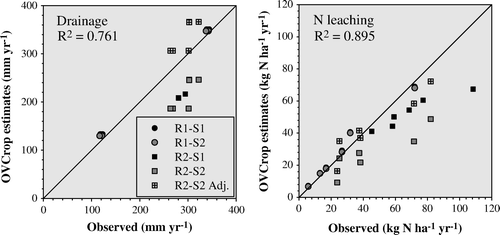
Comparison with measured data
A good agreement between observed and predicted drainage and leaching values was found for 2005, considering the simplifications of the model (). OVCrop reproduced the range of leaching outcomes that the different irrigation and nitrogen treatments produced and the lack of difference between the two rotation treatments. The OVCrop also predicted the relative variations in drainage and leaching between treatments in 2006 but under-predicted the absolute values of drainage (a) for the rotation 2 (R2) crop rotation and subsequently the N leaching (b). The under-prediction in drainage was caused by an over-prediction of evaporation by 120 mm yr−1 for R2. This disagreement was not surprising, since the water balance was designed to produce general predictions of the long-term average water balance in a given climate, not reproduce drainage events of particular years. To provide a fair test of the N leaching routines, the drainage amount for 2006 was modified to reflect the values measured. This resulted in a very good agreement between observed and predicted leaching, thus corroborating the leaching procedure of OVCrop.
Fig. 9 Comparison between the observed and predicted values of drainage and leaching for two crop rotations (R1 and R2) and two seasons (S1 and S2). Also are shown the values for R2–S2 after adjust for water drainage (see text and for details). Diagonal line is the 1:1.
Discussion and final remarks
During the development of the module presented here, the number of parameters was kept to a minimum, and only the most important factors influencing N leaching estimates were taken into account. In spite of this, the water and nitrogen budgets computed using OVCrop showed very good performance. The model testing results showed that the water balance is well described by the OVCrop and comparable at an annual time scale to the predictions of the more complex, process-based, LUCI framework model. The description of the nitrogen balance is also reasonably good. The various water and N pools simulated under crop rotation present more scatter, compared with those under bare soil, but still have acceptable measures of agreement (). The main outputs tested, drainage and N leaching, concur especially well with the predictions of LUCI over a wide range of scenarios ( and ). This agreement indicates that the model is able to simulate long-term drainage and leaching over a range of situations covering most of the New Zealand conditions. It also suggests that the model may be acceptable for simulating not only long term, but also specific years, providing particular weather data instead of long-term averages. For this purpose, however, more studies and tests would be required and thus are expressly not recommended at the current stage of development.
The proposed model also compared well against the expected long-term variation. Again drainage showed very good performance, with estimates within the range predicted by the LUCI model. The performance of the proposed module for N leaching, while not quite as good as for drainage, was still very reasonable. N leaching estimated using long-term average weather data fitted reasonably well within the variation pattern predicted by LUCI, especially for bare soil or for the light soil type (). For the crops and especially with the heavy soil, the estimates from the proposed tool tended to be out of the variation range predicted by LUCI for the scenarios with low N values. Being at the low end, these differences are of less concern, but work for improving these predictions could be done in the future.
A sensitivity analysis has shown that the parameters of the model related to plant uptake and return via residues have a significant impact on the model output (Cichota Citation2009). These parameters are difficult to estimate in the field and hence have been hard-wired within the model (internal parameters) and are not available to change by end-users. Best judgement was used to produce reasonable relationships and parameters to reflect the effect of management on N mineralization, but there is a clear need for more studies on the decomposition and mineralization processes and their contribution to soil N balance. The amount of N released in the soil from organic matter and crop residues has been found to be particularly significant, especially when converting pastures into crop land (Francis Citation1995; Francis et al. Citation1995; Stark et al. Citation2006). The parameters controlling evaporation and leaching were shown by the sensitivity analysis to have a considerable impact on leaching estimates through impact on drainage (Cichota Citation2009) and these are expected to be improved with more research.
The sensitivity study also indicated that the predictions of N leaching by OVCrop have a low sensitivity to the parameters related to the calculation of the mineralization of soil organic matter. Hence, the use of limited input data on soil mineralization is justified. An exception may be where pasture quality is suspected of affecting mineralization when converting the field into arable land (e.g. high-quality ryegrass/white clover compared with a browntop/native pasture). Research work is under way to determine whether this is due to differences in the amount of residual N or differences in mineralization parameters.
Unfortunately there were no appropriate measured datasets for comparisons of long-term predictions. The comparisons against the data obtained in the experiment with different crop rotations and management over two years showed, however, very positive results (). The under-estimation of the N leaching for the second year of this experiment was due to deviations in the water balance predictions. When drainage values were adjusted, the predictions of leaching agreed very well with measured values. It should be reinforced that the model was designed to estimate long-term averages, therefore comparisons against short-term data (measured or simulated) should be done with caution. The model was not developed to be used as a day-to-day management tool as there are specific models available that are designed to do this. The model structure was designed so that as well as responding to management practices for the current crop, the model also responds to previous crop management including pasture. This construct also allows cropping systems to be compared with other land-use systems within New Zealand, and allows the crop model to be integrated into the pastoral model so that land-use changes, mixing pasture and arable farming systems can be more easily modelled. Developments under way include the full integration of pasture and crop modules, and improvements to animal fodder cropping routines.
Modelling tools have been increasingly recognized as important instruments for supporting agricultural and environmental management. The model presented here is a suitable tool to help manage soil N and to provide environmental accountability for cropping systems in New Zealand. It presents an easy-to-use interface, requiring few and meaningful inputs, with the minimum flexibility needed to set up crop rotations and management of real farming systems. The model has been incorporated as an upgrade of the Overseer model and is available for use by farmers, consultants and regional councils. It is distributed free of charge (www.agresearch.co.nz/overseerweb) to enhance its use. It is expected that further upgrades will be made as more research and data are produced.
Acknowledgements
We thank Glyn Francis (then Crop and Food Research, now AgResearch) for providing the vision and initiating the collaboration needed to produce this tool, as well as the other integrants of the NMEA group, Andrea Pickering, Brent Clothier, Bruce Searle, Trish Fraser (Plant and Food Research), Jeff Morton (Balance Fertilisers) and Sonia Whiteman (HortNZ). We also want to thank the Overseer owners for allowing the incorporation of OVCrop into their model, and for the ongoing maintenance and updating that this will allow. This work was funded under MAF SFF grant number 05/100, ‘Nitrogen Management for Environmental Accountability’.
Notes
1. 1 OVERSEER is a registered trademark of AgResearch Ltd.
References
- Adams GA 2007 . Towards an effective complexity for modelling nutrient generation from small catchments . In: Oxley L , Kulasiri D MODSIM 2007—International Congress on Modelling and Simulation . University of Canterbury , Christchurch, , New Zealand , December 2007 . 2375 2381 .
- Addiscott , TM . 1983 . Kinetics and temperature relationships of mineralization and nitrification in Rothamsted soils with differing histories . Journal of Soil Science , 34 : 343 – 353 .
- Addiscott , TM . 1995 . Modelling the fate of crop nutrients in the environment: Problems of scale and complexity . European Journal of Agronomy , 4 ( 4 ) : 413 – 417 .
- Agricultural Nitrogen Managers Group 2006 . A Report on the Outcomes of a Scoping Study Undertaken as Part of the Project's Milestone Zero—MAF SFF 05/100: Nitrogen Management for Environmental Accountability . 101
- Armour T , Jamieson PD , Zyskowski RF 2002 . Testing the Sirius wheat calculator . Agronomy New Zealand . Palmerston North, , New Zealand , 25–27 June 2002 . 1 6 .
- Aslyng HC , Hansen S 1982 . Water balance and crop production simulation . The Royal Veterinary and Agricultural University. Model WATCROS for Local and Regional Application . 200
- Cichota R 2009 . Sensitivity analysis of the NMEA advanced tool . AgResearch Internal Report . 31
- Cichota , R , Snow , VO and Tait , AB . 2008 . A functional evaluation of virtual climate station rainfall data . New Zealand Journal of Agricultural Research , 51 ( 3 ) : 317 – 329 .
- Delgado , JA , Shaffer , MJ , Lal , H , McKinney , SP , Gross , CM and Cover , H . 2008 . Assessment of nitrogen losses to the environment with a Nitrogen Trading Tool (NTT) . Computers and Electronics in Agriculture , 63 : 193 – 206 .
- Dragten R Thorrold BS 2005 . Consents for farming: regulating nutrient loss in the Lake Taupo catchment . Developments in fertiliser application technologies and nutrient management—Occasional Report No 18 . Fertilizer and Lime Research Centre, Massey University , Palmerston North, , New Zealand .
- Francis , GS . 1995 . Management practices for minimizing nitrate leaching after ploughing temporary leguminous pastures in Canterbury, New Zealand . Journal of Contaminant Hydrology , 20 ( 3–4 ) : 313 – 327 .
- Francis , GS , Haynes , RJ and Williams , PH . 1995 . Effects of the timing of ploughing-in temporary leguminous pastures and two winter cover crops on nitrogen mineralization, nitrate leaching and spring wheat growth . Journal of Agricultural Science , 124 ( 1 ) : 1 – 9 .
- Green SR , Greven M , Neal S , Clothier BE 2004 . An assessment of vineyard planting density and the water demand of grapes . HortResearch. HortResearch Client Report No. 2004/12344 . 42
- Jamieson PD Armour T Zyskowski RF 2003a . On-farm testing of the Sirius Wheat Calculator for N fertiliser and irrigation management . 11th Australian Agronomy Conference Geelong, Victoria, Australia, February 2006 .
- Jamieson , PD , Semenov , MA , Brooking , IR and Francis , GS . 1998 . Sirius: a mechanistic model of wheat response to environmental variation . European Journal of Agronomy , 8 ( 3/4 ) : 161 – 179 .
- Jamieson PD , Stone PJ , Zyskowski RF , Sinton S 2003b . Implementation and testing of the Potato Calculator, a decision support system for nitrogen and irrigation management . In : Haverkort AJ , Mackerron DKL Decision support systems in potato production: bringing models to practice . Wageningen, , The Netherlands , Wageningen Academic Publishers . 85 - 99 .
- Jamieson PD , Zyskowski RF , Li FY , Francis GS , Snow V , Lilburne L 2006a . LUCI in the sky with diamonds—modelling the wider impacts of land use change and intensification . In: Fischer T , Turner N , Angus J , McIntyre L , Robertson M , Borrell A , Lloyd D 13th Australian Agronomy Conference . Perth , Australia , September 2006 .
- Jamieson PD Zyskowski RF Sinton SM Brown HE Butler RC 2006b . Potato calculator: A tool for scheduling nitrogen fertiliser applications . 36th Annual Conference of the Agronomy Society of New Zealand . Otago University , Dunedin, , New Zealand 14 November 2006 49 53 .
- Khaither PA , Erechtchoukova MG 2007 . From complex to simple in environmental simulation modelling . In: Oxley L , Kulasiri D MODSIM 2007—International Congress on Modelling and Simulation . University of Canterbury , Christchurch, , New Zealand , December 2007 . 2069 2075 .
- Kroeze , C , Aerts , R , van Breemen , N , van Dam , D , van der Hoek , K , Hofschreuder , P , Hoosbeek , M , de Klein , J , Kros , H , van Oene , H , Oenema , O , Tietema , A , van der Veeren , R and de Vries , W . 2003 . Uncertainties in the fate of nitrogen I: An overview of sources of uncertainty illustrated with a Dutch case study . Nutrient Cycling in Agroecosystems , 66 ( 1 ) : 43 – 69 .
- Langeveld , JWA , Verhagen , A , Neeteson , JJ , van Keulen , H , Conijn , JG , Schils , RLM and Oenema , J . 2007 . Evaluating farm performance using agri-environmental indicators: Recent experiences for nitrogen management in The Netherlands . Journal of Environmental Management , 82 ( 3 ) : 363 – 376 .
- Ledgard SF Journeaux PR Furness H Petch RA Wheeler D 2004 . Use of nutrient budgeting and management options for increasing nutrient use efficiency and reducing environmental emissions from New Zealand farms . OECD expert meeting on farm management indicators and the environment . Palmerston North , New Zealand , 8 12 March 2004 .
- Ledgard , SF , Thorrold , BS , Petch , RA and Young , J . 2001 . “ Use of OVERSEER as a tool to identify management strategies for reducing nitrate leaching from farms around Lake Taupo ” . In Precision tools for improving land management—Occasional Report No 14 , Edited by: Currie , LD and Loganathan , P . 187 – 194 . Palmerston North, , New Zealand : Fertilizer and Lime Research Centre, Massey University .
- Ledgard , SF , Williams , PH , Broom , FD , Thorrold , BS , Wheeler , DM and Willis , VJ . 1999 . “ OverseerTM —A nutrient budgeting model for pastoral farming, wheat, potatoes, apples and kiwifruit ” . In Best soil management practices for production—Occasional Report No 12 , Edited by: Currie , LD , Hedley , MJ , Horne , DJ and Loganathan , P . 143 – 152 . Palmerston North, New Zealdn : Fertiliser and Lime Research Centre, Massey University .
- Li FY , Jamieson PD , Pearson AJ 2006 . AmaizeN: Developing a decision-support tool to optimise nitrogen management of maize . In: Kemp PDSVS Agronomy New Zealand . Otago University , Dunedin, , New Zealand , 14 November 2006 . 61 70 .
- Li FY , Jamieson PD , Zyskowski RF , Brown HE , Pearson AJ 2007 . The Crop Calculators—from simulation models to usable decision-support tools . In: Kulasiri D , Oxley L MODSIM 2007—International Congress on Modelling and Simulation . Christchurch, , New Zealand , December 2007 . 128 134 .
- Monaghan , RM , Hedley , MJ , Di , HJ , McDowell , RW , Cameron , KC and Ledgard , SF . 2007 . Nutrient management in New Zealand pastures—recent developments and future issues . New Zealand Journal of Agricultural Research , 50 : 181 – 201 .
- Öborn , I , Edwards , AC , Witter , E , Oenema , O , Ivarsson , K , Withers , PJA , Nilsson , SI and Stinzing , AR . 2003 . Element balances as a tool for sustainable nutrient management: a critical appraisal of their merits and limitations within an agronomic and environmental context . European Journal of Agronomy , 20 ( 1–2 ) : 211 – 225 .
- Oenema , O , Kros , H and De Vries , W . 2003 . Approaches and uncertainties in nutrient budgets: Implications for nutrient management and environmental policies . European Journal of Agronomy , 20 ( 1–2 ) : 3 – 16 .
- Parliamentary Commissioner for the Environment 2004 . Growing for Good: Intensive farming, sustainability and New Zealand's environment . Parliamentary Commissioner for the Environment . 236
- Rahn C , Zhang K , Lillywhite R 2007 . User Manual—EU-ROTATE_N . University of Warwick Wellesbourne . 36
- Rahn , CR and Lillywhite , RD . 2002 . A study of the quality factors affecting the short-term decomposition of field vegetable residues . Journal of the Science of Food and Agriculture , 82 ( 1 ) : 19 – 26 .
- Rosen , MR , Reeves , RR , Green , S , Clothier , B and Ironside , N . 2005 . Prediction of groundwater nitrate contamination after closure of an unlined sheep feedlot . Vadose Zone Journal , 3 ( 3 ) : 990 – 1006 .
- Schlecht , E and Hiernaux , P . 2005 . Beyond adding up inputs and outputs: Process assessment and upscaling in modelling nutrient flows . Nutrient Cycling in Agroecosystems , 70 ( 3 ) : 303 – 319 .
- Shepherd , M and Chambers , B . 2007 . Managing nitrogen on the farm: the devil is in the detail . Journal of the Science of Food and Agriculture , 87 ( 4 ) : 558 – 568 .
- Skinner M 2007 . Applying international policy lessons for sustainable agriculture to New Zealand . 2nd International Conference on Sustainability Engineering and Science . Auckland, , New Zealand , February 2007 .
- Snow VO Zyskowski RF Cichota R Lilburne LR Jamieson PD 2007a . The effect of temporal aggregation on modelling pasture growth and nitrate leaching from urine patches . In: Kulasiri D Oxley L MODSIM 2007—International Congress on Modelling and Simulation . University of Canterbury , Christcurch, , New Zealand , December 2007 . 1646 1652 .
- Snow , VO , Zyskowski , RF , Martin , RJ , Knight , TL , Gillespie , RN , Riddle , MU , Fraser , TJ and Thomas , SM . 2007b . Impact of irrigation variability on pasture production and beneficial water use . Proceedings of the New Zealand Grassland Association , 69 : 59 – 64 .
- Stark , C , Condron , LM , Stewart , A , Di , HJ and O'Callaghan , M . 2006 . Effects of past and current management practices on crop yield and nitrogen leaching: A comparison of organic and conventional cropping systems . New Zealand Journal of Crop and Horticultural Science , 34 ( 3 ) : 207 – 215 .
- Statistics New Zealand 2007 . Agriculture in New Zealand. Analytical Reports . http://www.stats.govt.nz/analytical-reports/agriculture-in-nz/default.htm(accessed 24 September 2007) .
- Tait , A and Turner , R . 2005 . Generating multiyear gridded daily rainfall over New Zealand . Journal of Applied Meteorology , 44 ( 9 ) : 1315 – 1323 .
- Thomas S Fraser T Curtin D Brown HEL 2008 . Review of nitrous oxide emission factors and activity data for crops (Report prepared for Ministry of Agriculture & Fisheries) . Crop and Food Research Confidential Report No 2240 .
- Veihe , A , Jensen , NH , Boegh , E , Pedersen , MW and Frederiksen , P . 2006 . The power of models in planning: The case of DaisyGIS and nitrate leaching . Geografiska Annaler Series B—Human Geography , 88B ( 2 ) : 215 – 229 .
- Watson , CA and Atkinson , D . 1999 . Using nitrogen budgets to indicate nitrogen use efficiency and losses from whole farm systems: a comparison of three methodological approaches . Nutrient Cycling in Agroecosystems , 53 ( 3 ) : 259 – 267 .
- Wheeler DM 2009 . OVERSEER scenarios—‘what if’ analysis . In : Curries LD , Hanly JA Nutrient management in a rapidly changing world—Occasional Report No 22 . Palmerston North, New Zealand, Fertiliser and Lime Research Centre , Massey University .
- Wheeler D Brown H Cichota R Snow VO Zyskowski RF Green S Hedderley DI Searle B Thomas S 2009 . Documentation for OVERSEER crop and fruit model upgrades . Overseer owners’ report .
- Wheeler , DM , Ledgard , SF , de Klein , CAM , Monaghan , RM , Carey , PL , McDowell , RW and Johns , KL . 2003 . OVERSEER® nutrient budgets—moving towards on-farm resource accounting . Proceedings of the New Zealand Grassland Association , 65 : 191 – 194 .
- Wheeler , DM , Ledgard , SF , Monaghan , RM , McDowell , RW and de Klein , CAM . 2006 . “ OVERSEER nutrient budget model—what it is, what it does ” . In Implementing sustainable nutrient management strategies in agriculture—Occasional Report No 19 , Edited by: Curries , LD and Hanly , JA . 231 – 236 . Palmerston North, , New Zealand : Fertiliser and Lime Research Centre, Massey University .
- Wilde , RH . 2003 . Manual for National Soils Database , Landcare Research. 53 .
- Woodward SJR 2007 . Monthly ammonia volatilisation, progress report . Internal report to the Overseer owners .
- Young , P , Parkinson , S and Lees , M . 1996 . Simplicity out of complexity in environmental modelling: Occam's razor revisited . Journal of Applied Statistics , 23 ( 2–3 ) : 165 – 210 .
- Zyskowski RF Jamieson PD Li FY 2007a . LUCI—From single season crops to continuous sequences . In: Kulasiri D Oxley L MODSIM 2007—International Congress on Modelling and Simulation . University of Canterbury , Christchurch, , new Zealand , December 2007 . 1630 1637 .
- Zyskowski RF , Jamieson PD , Thomas S , Sinton S , Francis GS 2007b . Testing LUCI : Predictions and measurements of nitrate leaching and risk . In: Currie LD , Yates LJ Designing Sustainable Farms—Occasional Report No 20 . Palmerston North, , New Zealand , Fertiliser and Lime Research Centre, Massey University 151 157
- Zyskowski RF Wilson DR Maley S 2004 . A cohort model for simulating forage brassica crops with variable plant size . In: Fischer T Turner N Angus J McIntyre L Robertson M Borrell A Lloyd D 4th International Crop Science Congress . Brisbane , Australia , September 2004 .