
Abstract
Blackcurrant (Ribes nigrum L.) beverages are a popular product, largely consumed for their distinctive flavour profile and the perceived health benefits associated with their vitamin C and anthocyanin content. Blackcurrant breeding programmes generate large numbers of offspring, which are generally screened by the breeders to select candidates that meet the specific industry requirements for flavour typicality. To investigate the effectiveness of this approach, four commercial genotypes with varying degrees of typicality and five Plant & Food Research genotypes selected based on breeder evaluations of typicality or novelty were profiled by a trained sensory panel, quantifying potential differences in aroma, flavour and mouthfeel attributes. The sensory profiles generally confirmed the breeder selections for typicality, supporting the use of the breeders’ screening protocol. Implementing a pectin rinse protocol helped to decrease sensory fatigue and carryover effects during sensory profiling, therefore using this protocol may also be helpful during breeder assessments.
Introduction
Blackcurrants (Ribes nigrum L.) are a berry species native to central and northern Europe and northern Asia, and are widely cultivated in the temperate regions of the world including New Zealand where the main growing areas are Nelson and Canterbury.
There are approximately 50 commercial blackcurrant growers in New Zealand, who produce around 8000 tonnes of fruit per annum. In 2010, the export value of this production was NZ$18.1 million, of which $10.9 million was from sales of frozen concentrate destined for beverage manufacture (New Zealand Horticulture Export Authority Citation2012). There has been a notable expansion in the area planted in recent years (Blackcurrants NZ Inc Citation2012) with the most popular varieties for replacement planting being ‘Ben Ard’, ‘Magnus’ and ‘Ben Rua’.
Traditionally, blackcurrants have been consumed mainly for their high vitamin C content and distinctive flavour profile, while breeding programmes have focused largely on improving agronomic characteristics such as yield and pest and disease resistance. However, since the 1990s, the importance of sensory quality and specific consumer requirements has been increasingly acknowledged and these have become important criteria not only in the development of new blackcurrant cultivars (e.g. Brennan et al. Citation1997) but also in other important New Zealand horticultural export crops including kiwifruit (Jaeger et al. Citation2003; Wismer et al. Citation2005), apples (Hampson et al. Citation2000; Harker et al. Citation2008) and buttercup squash (Corrigan et al. Citation2001; Corrigan et al. Citation2006). This change from a purely agronomic focus to one more directed by end-use requirements is occurring globally: in the UK, for example, blackcurrant breeders are now required to produce cultivars to clear, well-defined specifications laid down by commercial sponsors who have specific end uses in mind (Brennan & Gordon Citation2002).
Some major blackcurrant processors have demanding requirements for desired fruit ‘typicality’— a particular distinctive blackcurrant aroma and a sensory profile that includes flavour, taste and mouthfeel attributes such as blackcurrant, astringent, musty/earthy, dark plum, woody, acidic, red berries, cat pee (Alistair Currie, PFR, pers. comm. 2013). Blackcurrant juice has a complex flavour profile and the identification of key blackcurrant flavour impact compounds has proven difficult. The compounds 4-methoxy 2-methyl 2-mercapto-butane (Piggott et al. Citation1993) and 4-mercapto-4-methyl-2-pentanone (Boccorh et al. Citation2002), which have been described as contributing the ‘catty’ note typical of fresh blackcurrant aroma, are generally undetectable after processing although the compounds may still be present at subthreshold levels (Piggott et al. Citation1993; Boccorh et al. Citation2002). Although the concentration of some aroma compounds may be reduced by as much as 50%–100% (Mikkelsen & Poll Citation2002) after processing, genotypic flavour profiles still remain distinctly different (Brennan et al. Citation2003). It is likely that they result not from a single compound, but from differing combinations and concentrations of many compounds (Piggott et al. Citation1993). For example, Mikkelsen & Poll (Citation2002) determined 27 of the 76 volatile compounds identified in blackcurrant juice to be impact compounds. Boccorh et al. (Citation2002) identified 37 chromatographic peaks with distinct aromas, 22 of which were determined to be ‘character-enhancing’ and 15 peaks to be ‘character non-enhancing’.
Plant breeding programmes typically generate large numbers of offspring which are screened to identify potential genotype candidates for further development. This screening process is made challenging by the lack of objective measures for candidate selection. For example, although apples can be classified to some extent using objective measures, or a combination of sensory and objective data, these are not reliable enough to predict the texture of new cultivars (Brookfield et al. Citation2011), which is a critical attribute for consumer acceptability. In the absence of objective measures for routine evaluation of blackcurrant flavour, breeding teams traditionally conduct in-house flavour screening on the subset of blackcurrant progeny that have met the threshold for selected agronomic and chemical traits. The blackcurrants are processed into a beverage and scored for characteristics such as flavour intensity, typicality of flavour and overall acceptability by a small number of people experienced with the product. To supplement in-house screening, trained descriptive sensory panels can provide more in-depth sensory profiles to quantify specific attributes or attribute combinations. This approach has been used extensively in Scotland (James Hutton Institute, Invergowrie, Dundee) to augment the breeding team's sensory profiles of juice from selected genotypes (e.g. Brennan et al. Citation1997, Citation2003; Harrison et al. Citation1999). The James Hutton Institute screens up to 47 sensory attributes including 16 aroma and 12 flavour attributes. Most of these are reported to be significant discriminators of sensory quality, which highlights the complex nature of the sensory profile of this product.
Here we present the results from a New Zealand study investigating the sensory profiles of blackcurrant beverages produced from four commercial industry genotypes with varying degrees of typicality, and five genotypes (PFR genotypes) developed in a joint breeding programme between Blackcurrants New Zealand and Plant & Food Research (PFR). Profiles were determined by an in-house breeding team panel and by a trained sensory panel. The aim of the study was to investigate the effectiveness of an in-house screening protocol for the selection of candidate genotypes by comparing the sensory profiles generated by a trained sensory panel with the results of the breeding team evaluations.
Materials and methods
Plant material
Fruit from nine genotypes were assessed by both the breeders and the trained sensory panel. The four commercial genotypes were ‘Magnus’, ‘Ben Ard’, ‘Ben Rua’ and ‘Ben Hope’. ‘Magnus’ is a New Zealand-bred genotype popular because of its blackcurrant flavour typicality. The UK genotypes ‘Ben Ard’ and ‘Ben Rua’ produce less typical flavours in the New Zealand climate. ‘Ben Hope’ is another UK genotype that has a strongly typical flavour profile but is not widely grown in New Zealand because of low yield (due to the lower chill climate). The five PFR genotypes are: ‘Melina’ (which has a similar flavour profile to ‘Ben Rua’); ‘Isobel’ (targeted at the individually quick frozen [IQF] market but versatile enough to also suit the juice market); ‘Kepler’ (strong blackcurrant typicality); ‘Blackadder’ (flavour typicality); and ‘Stuarts Green’ (novelty selection with atypical flavour, green skin, white flesh and a pale yellow-coloured juice). The breeder flavour descriptions were derived from at least two but more typically five or more years’ evaluations at bench-top level ().
Table 1 Breeder panel ‘typicality’ and flavour ratings derived from at least 2 years’ bench-top evaluation plus description of samples collected in the 2010–11 season (n = 2 assessors).
Fruit were grown on research and commercial plots on a commercial grower's property at Irwell, Canterbury, New Zealand. Standard commercial conditions were used with respect to weed control, plant nutrition and irrigation. The breeding blocks received a reduced pest and disease management programme. Berries (3.6–6.8 kg per genotype) were harvested over the period 29 December 2010–19 January 2011. ‘Magnus’ and ‘Stuarts Green’ samples were machine harvested and collected from bins in the commercial blocks. All other fruit were hand harvested from bushes on the research breeding blocks. One sample was taken per genotype when the fruit were ripe. Fruit was considered to be ripe 1 week after the majority of fruit on the bush was fully black or if the majority of the fruit on the bush was fully black and there were some shrivelled berries and/or dropping fruit. ‘Stuarts Green’ was harvested when the fruit skin colour changed from green to translucent green on the majority of the fruit. Harvested fruit were graded and any green berries, red berries or strigs were removed. They were frozen within 6 h of being harvested and stored at −20 °C until required for sensory analysis in November 2011.
Juice extraction
The frozen blackcurrants were thawed overnight at 4 °C, weighed and approximately 3.5–4 kg of the thawed berries were placed in a commercial Food Processor (Hallde Vertical Cutter/Mixer VCS-61/62). Pectinase (Celluzyme LX, Zymus) was diluted (1 part enzyme to 9 parts water) and added at a rate of 0.1 mL per 100 g fruit. The berries were processed for 2 min using the highest speed until pureed and placed into two 34 × 26 cm vacuum bags (Contour Packaging). The heat-sealed bags were each placed into a second vacuum bag, heat sealed and incubated in a water bath at 48 °C for 2 h. The incubated berry pulp was wrapped in two layers of organza to prevent skin and seed fragments from contaminating the juice and pressed using a 20 × 17 cm basket fruit press (Ferrari, 11075) until the press cake released no more juice. The press cake was broken up, rewrapped and pressed again to maximise yield which ranged from approximately 1.7–2.6 L. The extracted juice was pasteurised by bringing to the boil on a gas stove and holding at this temperature for 30 s. Approximately 80 mL portions of juice were hot-filled into sterilised 120 mL glass bottles with metal wadded lids (Arthur Holmes). The filled bottles were cooled to 30–40 °C, blast frozen and stored frozen at −20 °C until required.
Biochemical analysis
Frozen samples of the extracted juice were thawed, bulked and subsampled, refrozen and sent to PFR Nelson for analysis. Duplicate samples of the thawed juice were analysed at room temperature (20 °C) for soluble solids content (°Brix), pH and titratable acidity. Brix was measured with an Atago PAL-1 pocket refractometer (Atago USA Inc). Titratable acidity of 2 mL aliquots of juice was determined by titration with 0.1 M NaOH to an endpoint of pH 8.1 using a T70 autotitrator with Rondo autosampler (Mettler Toledo, USA). Results were converted to a percentage of citric acid on a fresh weight basis. pH was determined using an Orion bench-top pH meter on the following day.
Beverage formulation
The beverage formulation used by the breeders for genotype evaluation is 32 mL of juice in 170 mL water sweetened with 24 g sugar (11.9% w/v) and this formulation was used for the initial training session. However, panellists stated that the sugar level made it more difficult to discriminate the flavour notes because the predominant impression was sweetness. After bench-top testing and subsequent discussion during the panel training sessions, a formulation at 9.4% Brix was selected for panel evaluation sessions: this corresponds to the Brix level of a commercially available New Zealand blackcurrant drink.
Beverages were prepared fresh on the morning of each evaluation session. One bottle of blackcurrant juice per genotype was thawed at room temperature. The thawed juice was diluted at a rate of 1 part juice to 5 parts water, and sugar added at 6.7 g per 100 mL, calculated to give a final sugar content of approximately 9.4% w/v (based on the average Brix calculated across all nine genotypes). The beverage was mixed thoroughly and left to equilibrate to room temperature (17 °C) prior to serving.
Pectin rinse
A 1 g L−1 (0.1%) pectin solution was prepared fresh each day and served to the panellists to use as a palate cleanser for rinsing between samples. The pectin (Herbstreith & Fox KG) was weighed out and added gradually to approximately 400 mL of warm water while stirring vigorously until dissolved. This solution was then made up to 1 L with cold tap water. The pectin rinse was served at 17 °C.
Descriptive sensory analysis
Sensory panel training
A sensory panel of 13 female and one male panellists, all specifically recruited and with previous experience in sensory analysis, developed and refined a sensory vocabulary over six training sessions each lasting 1.5–2 h. Panellists tasted beverages prepared from the nine blackcurrant genotypes and an unsweetened commercial concentrate, and recorded all odour, flavour, taste and mouthfeel attributes they felt applied to and differentiated between at least some of the beverages. These responses were collated into a list of descriptors under the headings of aroma, flavour, taste and mouthfeel. Panellists then evaluated four beverages using their own selection of attributes from the collated list and discussed their use of these attributes as a group. The attributes that the panel agreed were similar were combined and attributes that were not considered to be relevant by the majority of the panel were discarded. This resulted in a vocabulary of 32 attributes: 12 odour, three basic taste, 12 flavour and five residual attributes () which was used to evaluate a range of beverages at subsequent training sessions. Attribute ratings were compared and discussed in order to establish consistency both within and between panellists. Panellist performance was monitored using PanelCheck (Citation2006) software to check for difference in scale usage and consistency in attribute scoring between panellists. Reference standards for the descriptors were presented for discussion on the second training day (). Where no suitable references were available, definitions were discussed and agreed upon by consensus.
Table 2 Sensory descriptive vocabulary developed by a trained panel for beverages formulated from a range of blackcurrant genotypes.
Sensory panel product evaluations
Profiling panels were carried out at the PFR sensory facility in Palmerston North. Panellists were seated in individual booths. Positive air pressure was used to prevent odours entering the booths from the preparation area and a temperature of 20 °C was maintained for panellist comfort. Red lighting was used to minimise the influence of beverage colour on evaluations.
Beverages were mixed thoroughly and approximately 35 mL volumes were poured into 45 mL portion cups coded with random three-digit numbers. Sample containers were lidded to contain aroma volatiles and allowed to equilibrate to the preparation kitchen room temperature of 17 °C prior to serving. Samples were presented monadically using a Latin Square design balanced for carryover effects (Macfie et al. Citation1989). Panellists attended a total of three evaluation sessions, evaluating all nine samples at each session.
Aroma attributes were evaluated immediately upon removing the container lid. Panellists then evaluated a first sip of the sample (approximately 10 mL) for intensity of the three basic taste attributes. A second sip was evaluated for the flavour attributes by swirling the sample round the mouth to ensure contact with all mouth surfaces and breathing out through the nose to maximise the impact of the flavour volatiles. Residual attributes were assessed 30 s after swallowing as the perception of astringency can take up to 15 s to develop (Jaeger et al. Citation2009). Attributes were rated on paper ballots using a 16 point category scale where 0 = absent and 15 = extreme. The list of reference products, attribute definitions and rating procedures was provided and panellists were encouraged to refer to this during their evaluations.
To help minimise the first-sample effect (Meilgaard et al. Citation1991), a ‘Ready to Drink’ commercial blackcurrant beverage was presented as a warm-up sample. This was tasted but not rated. Bottled spring water (Waiwera, Waiwera Water NZ), plain water crackers (Arnott's Original, Arnott's Biscuits, NSW, Australia) and 200 mL of 0.1% pectin rinse were provided for cleansing the palate between samples and to help minimise the build-up of bitterness and astringency in the mouth. Panellists were instructed to rinse with the pectin solution and then water before the first sample and between subsequent samples. An empty cup was provided for expectorating the rinsing solutions if necessary. Panellists were instructed to avoid drinking or consuming foods that could affect performance in the hour before a panel session and to refrain from wearing perfume.
Breeder evaluations
The frozen berries were thawed overnight in the fridge, blended using a stick blender and placed into a plastic bag with 0.1 mL of a pectinase enzyme per 100 g of pulp. The pulp was kneaded in the bag, incubated in a water bath at 48 °C for 4 h and then centrifuged until clear. The juice was decanted and stored frozen at −20 °C until required.
For evaluation, the juice was thawed and 24 g of sugar was added to 32 mL of juice which was then heated for 20 s in a microwave oven on high setting. After heating, 170 mL water was added and the beverage was cooled to room temperature for assessment. These assessments were generally done by two people from the plant breeding programme, although this ranged from one to three people depending on staff availability, as is the case for most breeding programmes (e.g. Oraguzie et al. Citation2009). The data reported here were collected by HortResearch and PFR breeders over many years. About eight to 10 samples per session were scored for flavour intensity, typicality and sometimes acceptability on 5 point scales where 1 = low intensity, typicality or acceptability and 5 = high intensity, typicality or acceptability and key flavour attributes were recorded for each genotype. Scores were reported as median values to minimise the effect of outlier scores. A juice sample of ‘Magnus’ was provided as a standard for comparison when scoring typicality. Assessors did not normally rinse between samples.
Statistical analysis
Biochemical data were analysed by one-factor ANOVA using GenStat and differences between means tested for significance using Tukey's (multiple range) test.
Preliminary inspection of the sensory dataset revealed that some panellists had rated all genotypes as absent (zero) in a specific attribute, meaning that those panellists either had not understood or had not used the attribute. In order for those zeros not to bias potential differences in sensory properties between genotypes, the data for these attributes from these panellists were excluded from the analysis. Where a panellist scored some samples zero, but some samples positively on an attribute, those zeros were retained.
Data were then analysed on an attribute-by-attribute basis using mixed model analyses of variance (GenStat procedure REML, GenStat version 14, VSNi, Hemel Hempstead, UK) that tested the effects of presentation order and genotype as the two main factors. The effects of panellists, panellist × assessment replication, panellists × presentation order, and panellists × genotypes were tested as random factors. Post-hoc differences between genotypes’ mean scores were determined using Fisher's least significant difference (LSD) values at α = 0.05 level of significance and differences between means tested for significance using Tukey's (multiple range) test to decrease the alpha risk error inherent in the use of the Fisher's LSD test for multiple comparisons.
To understand the patterns of variation between the sensory attributes, REML mean values averaged across panellists and evaluation replicates were input to principal components analysis (PCA) of the covariance matrix. The panellipse procedure in the R package SensoMineR (Lê & Husson Citation2008) was used to generate confidence ellipses (at the 95% level of significance) to obtain an indication of variability in genotype positions in the PCA space. The attributes included in the PCA were those where analysis of variance P values were less than 0.2, the default setting for panellipse.
Multivariate analyses of variance (MANOVAs) using Wilks’ lambda statistic were carried out to test the retained data for overall genotypic differences between the sensory profiles of the blackcurrant beverages. Hotelling's T2 P values for comparing the (multivariate) means of pairs of genotypes were obtained from panellipse.
Results
Biochemistry
There were highly significant genotypic differences in the Brix, titratable acidity and pH (P < 0.001) of the blackcurrant juice extracted from the frozen berries (), with values ranging from 13.4–19.2 °Brix, 29.02–44.66 mg g−1 FW and 2.86–3.09, respectively.
Table 3 Basic biochemical data, TA, Brix and pH, for undiluted blackcurrant juice as extracted from thawed frozen berries (8 d.f.). Data shown are the means of duplicate readings.
Sensory
REML analyses of the sensory attribute data revealed highly significant genotypic differences in 21 of the 32 aroma, flavour, taste and mouthfeel attributes evaluated (–). The non-discriminating attributes were apple, blackcurrant, red fruit and tamarillo odour; overall flavour and apple, metallic, red fruit, tamarillo and tropical fruits flavours; and residual bitterness. The most highly significant effects were largely those that discriminated among the beverages prepared from ‘Stuarts Green’ and the other genotypes—the lemon, white fruits and dark berry attributes. There were significant differences among the dark-coloured genotypes for many attributes. This included all the basic taste attributes except residual bitterness, dark berry, herbaceous aromatic, lemon, white fruits, woody odours and flavours, blackcurrant flavour, plus metallic, tropical fruit and overall odour.
Table 4 The effect of genotype and presentation order on the odour attributes of nine blackcurrant beverages profiled by a trained sensory panel (n = 14). Data are mean intensity ratings calculated from the scores of panellists who used that attribute.
Significant presentation order effects were found for only two attributes: overall odour and apple odour (). These effects were due to samples in the first position scoring higher than in all subsequent sample positions. Although the sample position effect was not significant for astringency (P = 0.269, ) the average score for the first sample position was lower than for all subsequent positions.
The panel attribute profiling data excluding the red fruit odour, red fruit flavour, apple flavour, tamarillo flavour and bitter residual attributes (analysis of variance P values were greater than 0.2) are summarised using the multivariate approach of PCA (, ).
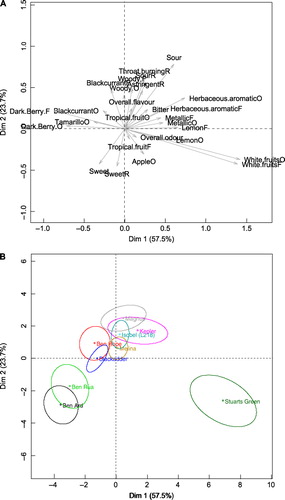
The first three dimensions accounted for 88.6% of the total variance in the sensory data. To better understand the three dimensions, attributes correlated with the axes at the 5% level or better are discussed (r = 0.666 for 7 d.f.).
Variation explained by the first principal component (PC1, variance accounted for [VAF] = 57.5%) relates mostly to the negative covariation between the dark berry odour and flavour attributes with high loadings on the negative side of PC1 and the white fruit, lemon, herbaceous aromatic and metallic odour and flavour attributes with high loadings on the positive side of this first dimension ().
The second principal component (PC2, VAF = 23.7%) relates mostly to the negative covariation between the overall flavour, blackcurrant flavour plus woody odour and flavour attributes with high loadings on the positive end of the PC2 axis, and the effects that overall flavour and blackcurrant flavour intensity have on the basic taste and mouthfeel attributes. Accordingly, sourness, residual sourness, astringency and the throat-burning sensation have high positive loadings on PC2, while sweetness and residual sweetness have high negative loadings ().
Only two attributes—overall odour and tropical fruit flavour—were highly correlated (P < 0.05) with principal component 3 (PC3, VAF = 7.4%) (data not shown).
MANOVA analyses show overall differences in the genotypic sensory profiles (P < 0.001, Wilks’ lambda = 0.143).The commercial genotypes are relatively positioned in three groups in the two-dimensional space (), reflecting the typicality assessments of the breeder panel (). The first group is formed by ‘Ben Rua’ and ‘Ben Ard’, which have similar overall sensory profiles (MANOVA P = 0.224) and are projected on to the lower left-hand quadrant of , well away from the industry standard ‘Magnus’. The sensory profiles of these genotypes are primarily characterised by the attributes of sweetness, dark berry odours and dark berry flavours for which they received the highest scores of all the genotypes ( and ), and by low scores for overall flavour, blackcurrant flavour and sourness which reflect the breeder descriptions ‘weak flavour, slight blackcurrant’ (‘Ben Ard’) and ‘slight blackcurrant’ (‘Ben Rua’) (). ‘Ben Rua’ scored highest for tamarillo odour and flavour and tropical fruit flavour but had the lowest overall flavour intensity score of all the genotypes (). ‘Ben Ard’ scored highly for apple odour and residual sweetness. These attribute scores combined with the relatively high sweetness and low flavour intensity of these two genotypes is reflected in the lower typicality score given by the breeders ().
Table 5 The effect of genotype and presentation order on the flavour attributes of nine blackcurrant beverages profiled by a trained sensory panel (n = 14). Data are mean intensity ratings calculated from the scores of panellists who used that attribute.
The second group consists of the PFR genotypes ‘Blackadder’, ‘Melina’, ‘Isobel’ and ‘Kepler’ and the two remaining commercial genotypes ‘Ben Hope’ and ‘Magnus’ which are projected on to the top half of the map alongside PC2 () and have flavour profiles that more strongly reflect the required commercial typicality, being more highly correlated with the attributes associated with typicality, in particular blackcurrant flavour intensity, woody flavour, sourness and astringency.
‘Magnus’ is described as having a strong, typical blackcurrant flavour with earthy, musty and woody flavour notes (), and the sensory profile of this genotype was strongly associated with the blackcurrant and woody flavour attributes ().
The significant difference in the sensory profiles of ‘Ben Hope’ and ‘Magnus’ (MANOVA P = 0.007) is due mainly to the strong overall flavour of ‘Magnus’, which is characterised by the highest scores for blackcurrant odour and blackcurrant flavour ( and ). This intense blackcurrant flavour was associated with the highest ratings for sourness, residual sourness, astringency—key attributes in the concept of “typicality” of blackcurrant flavour profile—and throat-burning.
‘Ben Hope’ on the other hand scored significantly lower than all genotypes except ‘Ben Ard’ for sourness, and scored highly relative to the other genotypes for tropical fruit odour. Flavour intensity and blackcurrant flavour scores were not significantly different from ‘Magnus’, and the overall sensory profile of ‘Ben Hope’ is aligned more with that of ‘Magnus’ than with ‘Ben Ard’ and ‘Ben Rua’.
‘Blackadder’ and the commercial genotype ‘Ben Hope’ are positioned in a similar space () and have similar overall sensory profiles (MANOVA P = 0.210). Although ‘Blackadder’ scored the highest after ‘Magnus’ for blackcurrant flavour, mid-range scores for the other attributes see it projected close to the origin ().
The positioning of ‘Kepler’ relative to ‘Magnus’ (MANOVA P = 0.234) reflects the strongly flavoured and complex sensory profile of ‘Kepler’. It scored highest or second highest for overall odour intensity, overall flavour intensity and 10 other attributes: blackcurrant odour, herbaceous/aromatic, tamarillo, tropical fruit and woody odours and flavours and an associated bitterness, but the lowest score for dark berry flavour.
The relative positioning and similar sensory profiles of ‘Blackadder’ and ‘Ben Hope’ and of ‘Kepler’ and ‘Magnus’ suggest a typicality of flavour profile for the PFR genotypes that is in agreement with the breeder evaluations that include the comment “typical blackcurrant” for all four genotypes ().
The flavour profiles of ‘Melina’ and ‘Isobel’ are considered to be less typical of blackcurrant (), and results of the MANOVA analyses show that the sensory profile of ‘Melina’ is significantly different from that of ‘Magnus’, ‘Kepler’, ‘Ben Hope’ and ‘Blackadder’ (MANOVA P = 0.002, P = 0.026, P = 0.0.016 and P = 0.010, respectively). However, the overall sensory profile of ‘Isobel’ is not significantly different from that of ‘Kepler’, ‘Magnus’ or ‘Melina’ (MANOVA P = 0.366, P = 0.172 and P = 0.248, respectively). The relative positioning of ‘Melina’ and ‘Isobel’ is likely to be related to flavour intensity due to high scores for sourness; the most significant features for the profiles of these genotypes being high scores for sourness (‘Melina’) and for astringency and residual sourness (‘Isobel’). Scores for blackcurrant odour and flavour are relatively low for ‘Melina’.
‘Kepler’, ‘Magnus’ and ‘Melina’ are separated to varying degrees along PC3 (not shown) reflecting relatively low (‘Melina’), medium (‘Isobel’ and ‘Magnus’) and high (‘Kepler’) scores for overall odour and for blackcurrant, herbaceous/aromatic, tropical fruit and woody odours.
The third group is projected on to the lower right-hand quadrant of and consists of the unusually flavoured ‘Stuarts Green’ with a sensory profile that is characterised by significantly stronger lemon and white fruits odours and flavours than all other genotypes, and thus had the lowest breeder score for typicality (). It had the strongest odour intensity of all the genotypes, with high scores for apple, metallic and herbaceous odours and flavours. Although it had the lowest scores for blackcurrant odour and flavour, the blackcurrant flavour intensity was not significantly different from that of ‘Ben Rua’ and ‘Ben Ard’ and the genotypic effect for blackcurrant odour was not significant—blackcurrant odour intensity was similar for all genotypes including ‘Stuarts Green’. Although ‘Stuarts Green’ has a very different sensory profile to the other genotypes and appears to have a strong influence on the form of the PCA map, reanalysis of the dataset with the data for this genotype excluded (not shown) does not greatly change the form of the resulting biplot. In addition, the results of the REML analyses show that many of the attributes evaluated discriminate between genotypes other than ‘Stuarts Green’; that is, the differences are more than just ‘Stuarts Green’ versus the other genotypes.
Breeder evaluations
The range of average flavour and typicality scores presented in is small, but the scores are relatively stable, having been calculated from the median of scores collected over many years. In the context of this restricted range, a 0.5 difference in score is considered by breeders to represent a genuine difference. Flavour intensity scores averaged over the previous seasons, were 3.0 for all genotypes except ‘Ben Ard’ (2.5) and ‘Ben Hope’ (3.75), whereas for the 2010–11 season, the range was 2.0–4.0. Typicality scores ranged from 2.0–3.0 with the exception of ‘Stuarts Green’ (1.0).
Discussion
The composition of the blackcurrant genotypes assessed here was comparable to those produced globally. Titratable acidity values were within the range 36.56–73.35 mg g−1 FW previously reported for fresh frozen homogenised whole blackcurrant berries (Bordonaba & Terry Citation2008) and the Brix measurements were comparable to the total sugar contents of 8.5%–17.9% FW reported by Bordonaba & Terry (Citation2008).
Breeder profiling is traditionally done to select genotypes suitable for further development, generally on the basis of flavour typicality, but sometimes because of a novelty factor, while sensory profiling can add more in-depth data about flavour difference, for example.
The concept of typicality is well established in the wine industry, especially in Europe where its evaluation is critical (Maitre et al. Citation2010). It can be summarised as a common memorised prototype or construct developed from repeated tastings and experiences of the product (Casabianca et al. 2005 and Lelièvre 2010 as quoted in Maitre et al. Citation2010). Typicality in wines results from factors including grape variety, soil, vintage and wine-making methods, and is present in wines displaying distinctive characteristics that make it recognisable as belonging to a type. It is measurable by wine experts who share a common language and understanding (Maitre et al. Citation2010).
Blackcurrant seedling selections are initially based on agronomic characteristics, but blackcurrants are largely a processed crop and the well-established brands in the food industry have a flavour profile they wish to maintain. Thus the concept of typicality is well understood, although based on the brand owner's view of blackcurrant flavour. Historically, this has been characterised by the flavour of genotypes such as ‘Magnus’ and ‘Ben Hope’, with sensory profiles including astringent, musty/earthy, dark plum, woody, acidic, red berry and cat pee notes. In breeding programme assessments, typicality is scored to help ensure that industry quality requirements are met. A score of 5 would be ideal, but selections scoring a 3 would generally be acceptable. While genotypes with a lower typicality score (2–2.5) would not be acceptable to some processors, they may be used outside the main juice brands if other characteristics were acceptable (Geoff Langford, pers. comm. 2014).
The PFR genotypes profiled here were selected for the typicality and/or commercial relevance of their flavour profile or, in the case of ‘Stuarts Green’, for novelty value based on breeder scores for typicality. The way these relatively similar genotypes are projected on to the PCA maps reflects both the similarities and the differences in their sensory profiles. With the exception of ‘Stuarts Green’, the PFR genotypes are more closely associated with the commercial genotypes ‘Ben Hope’ and/or ‘Magnus’ than with ‘Ben Rua’ and ‘Ben Ard’. This is to be expected as the typicality of flavour profile as demonstrated by ‘Ben Hope’ and ‘Magnus’ () is one of the selection criteria within the PFR/New Zealand breeding programme. The three main blackcurrant varieties currently grown in New Zealand are ‘Ben Ard’, ‘Ben Rua’ and ‘Magnus’ (Blackcurrants NZ Inc Citation2012). ‘Ben Ard’ and ‘Ben Rua’ are reported to have a similar fruity, mild, pleasant flavour; in addition, ‘Ben Rua’ is said to have a rich fruitiness that lacks strong distinctive blackcurrant notes (Horticulture New Zealand Citation2012). As noted earlier, even genotypes with similar sensory profiles as shown by their positioning on the biplots may differ significantly in some sensory attributes, although the only significant difference found here between ‘Ben Rua’ and ‘Ben Ard’ was a higher residual astringency for ‘Ben Rua’.
‘Ben Rua’ is described as a medium acid, medium-high sugar variety, whereas ‘Ben Ard’ is noted to be a lower acid variety (Horticulture New Zealand Citation2012): ‘Magnus’ is reported as having a relatively intense acid and flavour profile (Blackcurrants NZ Inc Citation2012). Overall, these descriptions are reflected in the positioning of the genotypes on the PCA biplots in and , the biochemical data () and the sensory attribute ratings ( and ).
‘Ben Hope’ is a popular commercial genotype in the UK but is not widely grown in New Zealand because of a relatively high chilling requirement to ensure good yields. The ‘Blackadder’ genotype was developed for New Zealand conditions and has a sensory profile not significantly different from that of ‘Ben Hope’ so may be an alternative to ‘Ben Hope’ for New Zealand growers. Likewise, ‘Kepler’ shows similar flavour typicality to ‘Magnus’. ‘Isobel’ was selected as being suitable for the IQF market, and, while the positioning of this genotype based on overall sensory profile suggests it is similar to the juice industry genotypes with the required typicality, scores for some of the individual attributes do not support this.
Overall, the results of the PCA analyses suggest that the trained panel sensory profiles differentiate between the genotypes in a similar way to the breeder groupings.
Significant genotypic differences in aroma, flavour, taste and mouthfeel attributes were confirmed by REML analyses and even genotypes with similar overall sensory profiles differed significantly for some attributes. These findings confirm earlier results reporting significant genotypic differences in the sensory profiles of blackcurrant genotypes (e.g. Brennan et al. Citation1997, Citation2003) and the lack of discrimination between genotypes by the apple odour and apple flavour attributes (Brennan et al. Citation1997). In addition, they emphasise the complexity of the blackcurrant profiling task and confirm the discriminatory ability of the sensory panel. The only unexpected finding was for ‘Melina’ which was described by the PFR blackcurrant breeders as typically having a similar flavour to ‘Ben Rua’ () and scored low for typicality, whereas we found it to be more strongly aligned with ‘Ben Hope’: we note that both these genotypes have been described as having a rhubarb note by the breeders. The profile differences between ‘Melina’ and ‘Ben Rua’ may be related to differing genotypic responses to seasonal conditions (Boccorh et al. Citation1999) or to differences in juice processing protocols. However, the data presented in and show that the only significant differences in odour and flavour profile between the two genotypes are for the attributes of overall odour and tamarillo odour, and for overall flavour and tropical fruit flavour. Thus the differences between the genotypes are largely due to differences in sourness, astringency and throat-burning (). The positioning of ‘Melina’ in is likely to be a result of the high scores for sourness for ‘Melina’, ‘Ben Hope’ and ‘Magnus’ compared with ‘Ben Rua’, the latter receiving the second lowest score for sourness. In addition, the breeders’ flavour intensity score for ‘Melina’ in the 2010–11 season was also uncharacteristically high.
Table 6 The effect of genotype and presentation order on the basic taste, mouthfeel and residual attributes of nine blackcurrant beverages profiled by a trained sensory panel (n = 14). Data are mean intensity ratings calculated from the scores of panellists who used that attribute.
The samples tested here were heat pasteurised whereas the breeder protocol does not include this step as the samples are consumed soon after preparation or frozen for later assessment. Processing can change the sensory profile of blackcurrant juice through loss of volatile compounds and the formation of new, less volatile flavour compounds (Piggott et al. Citation1993). For example, terpene, aldehyde, furan and phenol concentrations increase with heat treatment while ester concentrations decrease (Varming et al. Citation2004). Thus the degree of flavour change will be influenced by the starting composition of the juice, but little has been reported on differential changes in sensory profile of genotypes during processing. Brennan et al. (Citation2003) found a significant cultivar by heat treatment interaction for a single attribute—natural flavour—but compared only two cultivars. Other studies investigating the effects of processing on blackcurrant juice quality have considered only one genotype (Mikkelsen & Poll Citation2002; Varming et al. Citation2004; Sandell et al. Citation2009; Laaksonen et al. Citation2012).
The trained panel rated nine samples per session in this study, using an experimental design (Macfie et al.Citation1989) and rinsing protocols selected to help minimise the influence of presentation order and carryover effects on attribute intensity scores, and we found no significant presentation order effects for any of the attributes evaluated orally, although the intensity score for astringency was lower for the first sample position. It is uncertain how much of a problem carryover effects are when evaluating blackcurrant beverages, as few studies appear to analyse for these. Muir et al. (Citation1998) report significant presentation order effects for 18 of the 40 aroma, flavour, aftertaste and mouthfeel attributes assessed in four blackcurrant beverages per session (biscuit and water rinse protocol). Other studies assessing four (Brennan et al. Citation1997, Citation2003; biscuit and water rinse protocol), eight (Piggott et al. Citation1993; no rinse specified) and 11 (Ng et al. Citation2012; biscuit and water rinse protocol) blackcurrant beverages per session do not report analysing for carryover effects. Carryover effects are widely acknowledged in the evaluation of wines (e.g. Colonna et al. Citation2004) where palate cleansing protocols using pectin solutions help to reduce but not eliminate the build-up of astringency (e.g. Cliff et al. Citation2012). While both 1 g/L and 5 g/L solutions are used and are equally effective (Colonna et al. Citation2004), the 1 g/L concentration was used here as the pectin rinse itself can have carryover effects, lowering the perceived intensity of astringency in the next sample if not followed by a water rinse (Taira et al. Citation1997). Thus thorough rinsing with water after a pectin rinse is essential.
The results presented here are for a single sample of berries harvested once from each blackcurrant genotype in a single season, so the sensory profiles represent these genotypes at a single point in time. Genotype performance (e.g. berry composition) is known to be influenced by a range of factors including climatic effects, environmental conditions and previous crop loads (Milivojevic et al. Citation2012). Geographic location can also have an effect (Brennan & Gordon Citation2002), but this is less likely to be a factor here as all genotypes were grown on a single property, although within-property differences can also occur. However, for the commercial genotypes at least, the year-to-year variation is likely to be less relative to the between-genotype variation, given their acceptance by industry for typicality of flavour. As the blackcurrants are processed before consumption, any variations in sugar content are easily managed through the addition of sugar during processing.
Genotypic differences in the sensory profile of blackcurrants are evident at a juice concentration of 25% (Brennan et al. Citation2008), and also at the concentration of approximately 17% used in the bench-top and sensory profiling studies reported here. Thus it is likely that genotypic flavour differences will be detectable in the commercial beverages currently sold in New Zealand even at the relatively low juice concentrations used, although attribute intensities may be lower. The varying sugar contents of the commercial products will also influence sensory profile and thus consumer acceptance. While typicality is important in maintaining a product that is consistent with consumer expectations, the unusual appearance and flavour profile such as that of ‘Stuarts Green’ may also be acceptable in a marketplace that has a high requirement for new experiences.
The aim of this study was to investigate the effectiveness of the in-house genotype screening protocol used by the PFR blackcurrant breeders by comparing the sensory profiles generated by a trained sensory panel with the results of the breeding team evaluations. The results presented generally validate the bench-top selection process of blackcurrants, as has been recommended for the routine post-harvest assessment of other fruits where timing is critical and budget limited (Oraguzie et al. Citation2009). Similar characteristics were found to discriminate among the blackcurrant genotypes for both the breeder and trained panel profiling despite factors such as seasonal variations.
Conclusions
Overall the results of the PCA analyses suggest that the sensory profiles generated by the trained sensory panel differentiate among the genotypes in a similar way to the breeder classifications. Thus the expert panel evaluations of large numbers of blackcurrant genotypes routinely performed by plant breeders can be an effective and practical way of selecting promising material with the required flavour profile by focusing largely on the typicality required by industry. When required, additional data can be provided by a trained sensory panel to help understand and quantify the similarities and differences in the sensory profiles of selected genotypes of particular interest.
Acknowledgements
This research was supported by the New Zealand Foundation for Research, Science and Technology (Contract C06X0807). The authors would like to thank colleagues at Plant & Food Research for assistance with the empirical work; the trained sensory panellists for their invaluable input; and to colleagues Catherine Snelling and Alastair Currie for their helpful comments and discussions.
References
- Blackcurrants NZ Inc 2012. The blackcurrant industry. http://www.blackcurrant.co.nz/aboutus.html#industry (accessed 21 November 2012).
- Boccorh RK, Paterson A, Piggott JR 1999. Sources of variations in aroma-active volatiles, or flavour components, of blackcurrant concentrates. Zeitschrift für Lebensmitteluntersuchung und -Forschung A 208: 362–368.
- Boccorh RK, Paterson A, Piggott JR 2002. Extraction of aroma components to quantify overall sensory character in a processed blackcurrant (Ribes nigrum L.) concentrate. Flavour and Fragrance Journal 17(5): 385–391. 10.1002/ffj.1111
- Bordonaba JG, Terry LA 2008. Biochemical profiling and chemometric analysis of seventeen UK-grown black currant cultivars. Journal of Agricultural and Food Chemistry 56: 7422–7430. 10.1021/jf8009377
- Brennan RM, Gordon SL 2002. Future perspectives in blackcurrant breeding. Acta Horticulturae (ISHS) 585: 39–45. http://www.actahort.org/books/585/585_2.htm (accessed 20 November 2012).
- Brennan RM, Hunter EA, Muir D 1997. Genotypic effects on sensory quality of blackcurrant juice using descriptive sensory profiling. Food Research International 30: 381–390. 10.1016/S0963-9969(97)00063-X
- Brennan RM, Hunter EA, Muir DD 2003. Relative effects of cultivar, heat-treatment and sucrose content on the sensory properties of blackcurrant juice. Food Research International 36: 1015–1020. 10.1016/j.foodres.2003.07.004
- Brennan R, Stewart D, Russell J 2008. Developments and progress in Ribes breeding. Acta Horticulturae (ISHS) 777: 49–56. http://www.actahort.org/books/777/777_3.htm (accessed 20 November 2012).
- Brookfield PL, Nicoll S, Gunson FA, Harker FR, Wohlers M 2011. Sensory evaluation by small postharvest teams and the relationship with instrumental measurements of apple texture. Postharvest Biology and Technology 59: 179–186. 10.1016/j.postharvbio.2010.08.021
- Cliff MA, Stanich K, Edwards JE, Saucier CT 2012. Adding grape seed extract to wine affects astringency and other sensory attributes. Journal of Food Quality 35: 263–271. 10.1111/j.1745-4557.2012.00448.x
- Colonna AE, Adams DO, Noble AC 2004. Comparison of procedures for reducing astringency carry-over effects in evaluation of red wines. Australian Journal of Grape and Wine Research 10: 26–31. 10.1111/j.1755-0238.2004.tb00005.x
- Corrigan VK, Hedderley DI, Hurst PL 2006. Assessment of objective texture measurements for characterising and predicting the sensory quality of squash (Cucurbita maxima). New Zealand Journal of Crop and Horticultural Science 34: 369–379. 10.1080/01140671.2006.9514428
- Corrigan VK, Hurst PL, Potter JF 2001. Winter squash (Cucurbita maxima) texture: Sensory, chemical, and physical measures. New Zealand Journal of Crop and Horticultural Science 29: 111–124. 10.1080/01140671.2001.9514169
- Hampson CR, Quamme HA, Hall JW, MacDonald RA, King MC, Cliff MA 2000. Sensory evaluation as a selection tool in apple breeding. Euphytica 111: 79–90. 10.1023/A:1003769304778
- Harker FR, Kupferman EM, Marin AB, Gunson FA, Triggs CM 2008. Eating quality standards for apples based on consumer preferences. Postharvest Biology and Technology 50: 70–78. 10.1016/j.postharvbio.2008.03.020
- Harrison RE, Brennan RM, Hunter EA, Morel S, Muir DD 1999. Genotypic, environmental and processing effects on the sensory character of rubus and ribes. Acta Horticulturae (ISHS) 505:25–32. http://www.actahort.org/books/505/505_1.htm (accessed 20 November 2012).
- Horticulture New Zealand 2012. Berryfruit variety descriptions. Wellington, Horticulture New Zealand. http://www.hortnz.co.nz/publications/hortfacts/bvd/bvd/bvd5 (accessed 21 November 2012; URL is no longer active).
- Jaeger SR, Axten LG, Wohlers MW, Sun-Waterhouse D 2009. Polyphenol-rich beverages: insights from sensory and consumer science. Journal of the Science of Food and Agriculture 89: 2356–2363. 10.1002/jsfa.3721
- Jaeger, SR, Rossiter KL, Wismer, WV, Harker FR 2003. Consumer-driven product development in the kiwifruit industry. Food Qual Preference 14: 187–198. 10.1016/S0950-3293(02)00053-8
- Laaksonen O, Sandell M, Nordlund E, Heiniö R-L, Malinen H-L, Jaakkola M, et al. 2012. The effect of enzymatic treatment on blackcurrant (Ribes nigrum) juice flavour and its stability. Food Chemistry 130: 31–41. 10.1016/j.foodchem.2011.06.048
- Lê S, Husson F 2008. SensoMineR: a package for sensory data analysis. Journal of Sensory Studies 23: 14–25. 10.1111/j.1745-459X.2007.00137.x
- Macfie HJ, Bratchell N, Greenhoff K, Vallis LV 1989. Designs to balance the effect of order of presentation and first-order carry-over effects in hall tests. Journal of Sensory Studies 4: 129–148. 10.1111/j.1745-459X.1989.tb00463.x
- Maitre I, Symoneaux R, Jourjon F, Mehinagic E 2010. Sensory typicality of wines: how scientists have recently dealt with this subject. Food Quality and Preference 21: 726–731. 10.1016/j.foodqual.2010.06.003
- Meilgaard M, Civille GV, Carr BT 1991. Sensory evaluation techniques. 2nd edition. Boca Raton, FL, CRC Press. p. 40
- Mikkelsen BB, Poll L 2002. Decomposition and Transformation of Aroma Compounds and Anthocyanins during Black Currant (Ribes nigrum L.) Juice Processing. Journal of Food Science 67: 3447–3455. 10.1111/j.1365-2621.2002.tb09604.x
- Milivojevic J, Slatnar A, Mikulic-Petkovsek M, Stampar F, Nikolic M, Veberic R 2012. The Influence of Early Yield on the Accumulation of Major Taste and Health-Related Compounds in Black and Red Currant Cultivars (Ribes spp.). Journal of Agricultural and Food Chemistry 60: 2682–2691. 10.1021/jf204627m
- Muir DD, Hunter EA, Williams SAR, Brennan RM 1998. Sensory profiles of commercial fruit juice drinks: influence of sweetener type. Journal of the Science of Food and Agriculture 77: 559–565. 10.1002/(SICI)1097-0010(199808)77:4%3C559::AID-JSFA80%3E3.0.CO;2-M
- New Zealand Horticulture Export Authority 2012. Blackcurrant exports. http://www.hea.co.nz/index.php/2012-05-11-03-05-28/blackcurrant-trade (accessed 20 November2012).
- Ng M, Lawlor JB, Chandra S, Chaya C, Hewson L, Hort J 2012. Using quantitative descriptive analysis and temporal dominance of sensations analysis as complementary methods for profiling commercial blackcurrant squashes. Food Quality and Preference 25: 121–134. 10.1016/j.foodqual.2012.02.004
- Oraguzie N, Alspach P, Volz R, Whitworth C, Ranatunga C, Weskett R et al. 2009. Postharvest assessment of fruit quality parameters in apple using both instruments and an expert panel. Postharvest Biology and Technology 52: 279–287. 10.1016/j.postharvbio.2009.01.004
- PanelCheck software 2006. Nofima Mat, Ås, Norway http://www.panelcheck.com (accessed 12 November2012).
- Piggott JR, Paterson A, Clyne J 1993. Prediction of flavour intensity of blackcurrant (Ribes nigrum L.) drinks from compositional data on fruit concentrates by partial least squares regression. International Journal of Food Science & Technology 28(6): 629–637. 10.1111/j.1365-2621.1993.tb01315.x
- Sandell M, Laaksonen O, Järvinen R, Rostiala N, Pohjanheimo T, Tiitinen K et al. 2009. Orosensory profiles and chemical composition of black currant (Ribes nigrum) juice and fractions of press residue. Journal of Agricultural and Food Chemistry 57: 3718–3728. 10.1021/jf803884y
- Taira S, Ono M, Matsumoto N 1997. Reduction of persimmon astringency by complex formation between pectin and tannins. Postharvest Biology and Technology 12: 265–271. 10.1016/S0925-5214(97)00064-1
- Varming C, Andersen ML, Poll L 2004. Influence of thermal treatment on black currant (Ribes nigrum L.) Juice Aroma. Journal of Agricultural and Food Chemistry 52: 7628–7636. 10.1021/jf049435m
- Wismer WV, Harker FR, Gunson FA, Rossiter KL, Lau K, Seal AG et al. 2005. Identifying flavour targets for fruit breeding: a kiwifruit example. Euphytica 141: 93–104. 10.1007/s10681-005-5891-7