
Abstract
In China, apple (Malus × domestica Borkh.) nursery stock is generally of low quality because of extremely high planting density. The objective of this study was to determine the optimum planting density of 2-year-old grafted apple trees. Tree growth (height, trunk diameter, leaf area index) increased as density decreased. Trees grown at high densities (14.3–50 plants/m2) were the shortest with the smallest trunk diameters and leaf areas, whereas trees grown at lower densities (4.8–10 plants/m2) were generally largest in terms of height, diameter and leaf area. Trees grown at lower densities tended to have higher bud dry weight, leaf dry weight, nitrogen content, total soluble sugar concentration and total non-structural carbohydrate content. Higher levels of these parameters were generally observed with tree densities at or below 10 plants/m2. Therefore we conclude that 10 plants/m2 is the optimum density for maximizing the number of trees produced per unit land area while maintaining tree quality of nursery stock.
Introduction
The recent rapid development of the apple industry in China has created high demand for nursery stock, along with an increasingly higher requirement for high-quality nursery stock (Han Citation2009; Wang et al. Citation2010). At present, the quality of apple nursery stock produced by commercial nurseries in China is low (Chen et al. Citation2010; Li et al. Citation2011), primarily due to extremely high planting densities in nurseries (Li et al. Citation2008; Li et al. Citation2011). Currently, nurseries in China commonly use a spacing of 20 × 10 cm giving densities of 50 plants/m2. Only 42% of 2-year-old apple nursery stock with vigorous rootstocks and 73.1% of 3-year-old apple nursery stock with dwarfing interstocks meet national standards for apple nursery stock (plant height at least 120 cm and cultivar trunk diameter at least 8 mm) (Li et al. Citation2011). Previous research has shown that between-row spacing has little influence on the growth of nursery trees, but closer within-row spacing results in trees that have smaller trunk diameters and fewer lateral branches (Wertheim Citation1989). In that study, nursery tree densities of 1.6–11 plants/m2 were examined and in other studies tree densities of 4–10 plants/m2 were common (Popenoe & Barritt Citation1988; Volz et al. Citation1994; Milosevic & Milosevic Citation2011).
The quality of apple nursery trees supplied to orchards has a direct impact on the field and economic performance of newly planted orchards. Both trunk girth and the number of branches (feathers) are important in determining early productivity of apple trees in the orchard (van Oosten Citation1978), although an increased number of branches is not necessarily of benefit in spur-type cultivars (Ferree & Rhodus Citation1987). Furthermore, tree nutrient status (mainly nitrogen [N] and carbohydrate) accumulated during the previous growing season plays an important role in determining initial tree growth in the spring (Loescher et al. Citation1990; Millard Citation1995; Cheng & Fuchigami Citation2002). Therefore, such nutrient status is an important quality attribute of nursery trees.
The effects of planting density on the growth of fruit nursery trees that have been transplanted and grafted multiple times have not been studied to our knowledge.
The objectives of this research were to determine the optimum planting density for apple nursery stock production and to explore the relationship between planting density and nutrient status in order to provide a more detailed understanding of the theoretical basis of apple nursery stock production in China.
Materials and methods
Experimental site and plant materials
The experiment was conducted in the Apple Demonstration Nursery of Yangling Modern Agriculture Technology Park, Shaanxi Province of China (34°52′N, 108°7′E), from March 2010 to January 2011. The soil in study plots was of loam texture with maximum water-holding capacity of 22.3%. Soil samples collected at a depth of 20 cm contained 1.19% organic matter, 970 mg/kg total N, 58.5 mg/kg available N, 10.8 mg/kg available phosphorus (P) and 254 mg/kg available potassium (K), which were determined based on the procedures described by Bao (Citation2005). Two-year-old, bud-grafted ‘Fuji’ trees on Malus sieversii (Ldb.) Roem rootstocks with 30 cm long M.26 interstocks were planted in the experimental plots. Specifically, M. sieversii seeds were sown in March 2008, the buds of interstock ‘M.26’ were grafted on to the rootstock in August 2008 and the buds of ‘Fuji’ variety were grafted on to the interstock in August 2009.
Experimental design
The experiment was conducted as a randomized block design with three blocks and 11 planting density treatments (). Each treatment was replicated three times in each of the three blocks. Each replicate contained 150 trees (six rows of 25 trees) and was surrounded by three guard rows with trees planted at intermediate spacings (see Fig. S1). All trees were transplanted into the designed experimental spacings in mid-March 2010. All shoots arising from the interstock or rootstock were removed at the time of transplanting, along with fibrous roots (diameter <2 mm). Lateral roots (diameter ≥ 2 mm) were retained to promote uniform root reconstruction.
Table 1 Planting density treatments.
All trees were irrigated in the first 2 weeks after transplanting. One week after bud break, survival of cultivar buds was examined and non-growing trees replaced.
Field management
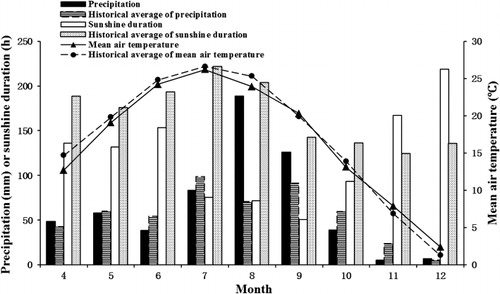
Trees were irrigated using an automatic sprinkler system, weeds and interstock/rootstock sprouts were removed manually, and pests (mostly aphids and leaf roller moths) were controlled with pesticides. According to the recommendations of Wang & Xue (Citation2003), each tree was given 1 g urea (0.33 g actual N) three times in the first 10 days of April, May and June, and was given 0.325 g actual P and 0.25 g actual K applied as potassium dihydrogen phosphate and potassium sulphate in each of two applications in early July and early August. Air temperature, precipitation and sunshine hours during the experiment were monitored and recorded by an AG1000 automatic meteorological station (Beijing Techno Solutions, Beijing) in real time. Monthly mean air temperature, precipitation and sunshine duration during the experiment are shown in .
Data collection
Plant height and diameter of cultivar trunk
After transplanting in March 2010, 36 equally distributed trees were selected in each replicate for measurement of plant height and diameter of cultivar trunk (10 cm above the interstock-cultivar graft union) and measured monthly from bud break to leaf fall.
Leaf dry weight and leaf area
When the trees stopped growing (mid-November 2010), leaves on the 36 trees per replicate selected for growth measurements were counted and three leaves in the upper, middle and basal part of these plants were collected to determine leaf dry weight and leaf area. Leaf area was measured by scanning leaves (without petiole) on a scanner (Epson Perfection V330 Photo, Seiko Epsom Corp, Nagano, Japan) and calculating leaf area with Adobe Photoshop CS4 software (Adobe Systems, San Jose, CA, USA). Ethanol-washed leaves were dried at 60 °C to constant weight to determine leaf dry weight. Using these data, total leaf area per tree (number of leaves multiplied by average leaf area), leaf area index (LAI) (leaf area per unit land area) and total leaf dry weight per tree (dry weight per unit leaf area multiplied by total leaf area) were calculated.
Dry weight of different parts of apple tree
In January 2011, 75 trees of each treatment (25 trees uniformly distributed in each replicate) were selected for plant height determination. For each treatment, three trees per replicate of mean plant height were chosen and harvested in their entirety, buds were collected from the lower, middle and upper parts of the scion shoot. Buds were washed in ethanol, then dried at 60 °C and weighed. After the buds were removed, each tree was divided into cultivar shoot (generally a single shoot), interstock, rootstock and root system. The root system was further divided into main, lateral and new roots. After washing with 70% ethanol, all plant parts were dried to constant weight at 60 °C, weighed and ground by FW100 grinder (Tianjin Taisite Instruments, China) to pass through an 80 (180 μm) mesh sieve. The bud dry weight was represented in grams per 100 buds and the net biomass increase was defined as the sum of dry weight of the new root, cultivar shoot and total leaf dry weight, although both rootstocks and interstocks also grew slightly after a growing season. The net biomass increase per unit area was then calculated based on planting density.
Determination of soluble sugar, starch and total N concentration
A composited sample was constructed for each tree based on its dry matter distribution among different parts for determination of the concentrations of total soluble sugar, starch and N. The extraction and determination of soluble sugar (sum of sucrose, glucose, fructose and sorbitol) and starch were carried out according to previously reported methods (Wu et al. Citation2003; Cheng et al. Citation2004; Rosa et al. Citation2009) with minor modifications. For soluble carbohydrates, 500 mg composited samples were extracted three times at 70 °C with 80% ethanol (7 mL each, 30 min per extraction). Tissue suspensions were centrifuged at 4000 g for 10 min after each extraction, and the supernatants were combined. The extract was added to constant volume (25 mL) with 80% ethanol. A 10 mL sample of the extract was then evaporated to dryness at 55 °C and redissolved in 10 mL of pure water. Then 25 μL redissolved samples were injected into a Waters high performance liquid chromatography system (HPLC) (Waters Corp, USA), equipped with a Waters Sugar-pak column, a Waters 2414 refractive index detector and the Waters Breeze 2 software. The detector oven and column heater module temperatures were 40 °C and 90 °C, respectively. Carbohydrates were eluted by 50 mg/L calcium ethylenediaminetetraacetic acid (EDTA-Ca) at a flow rate of 0.5 mL/min. After soluble sugar extraction, the tissue residue was dried and digested overnight with amyloglucosidase at 55 °C in sodium acetate buffer (pH 4.5) to convert starch to glucose. The concentration of glucose was quantified by HPLC according to the method described above. N concentration was determined according to the method of Bao (Citation2005). Composited samples (0.5 g) mixed with 3 g catalyst of K2SO4:CuSO4 (3:1 qualitatively) were digested with 10 mL of H2SO4 and 2 mL H2O2 for at least 6 h at 375 °C. Nitrogen concentration was determined by the Kjeldahl method with an auto nitrogen analyser (Kjektec System FOSS-2300, Sweden). The total non-structural carbohydrate (TNC) concentration was the sum of total soluble sugar concentration and starch concentration; and TNC/N ratio was the ratio of TNC concentration and N concentration.
Statistical analysis
Statistical analyses were conducted by the analysis of variance (ANOVA) function of IBM® SPSS 16.0 (IBM Corp, USA). Differences among treatments were determined by Duncan's method (SSR) at the 0.05 probability level.
Results
Effects of planting density on growth
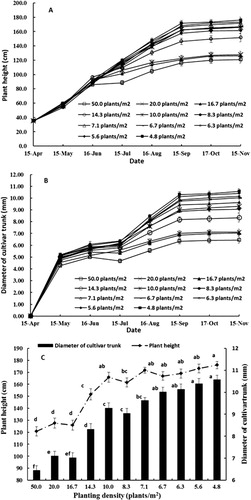
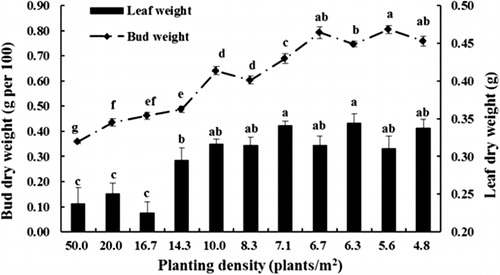
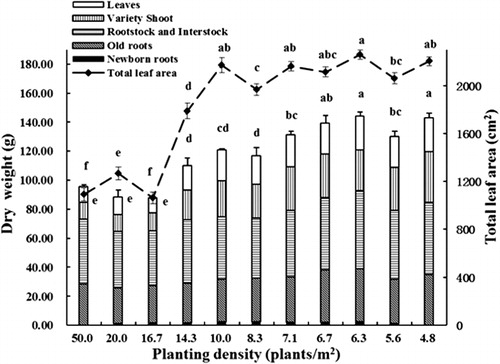
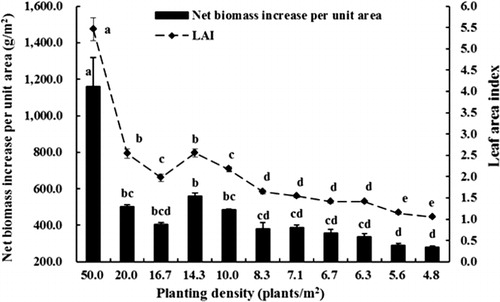
All measures of tree growth were negatively related to tree density including tree height, trunk diameter, leaf area per tree and total plant dry weight. Trees at all planting densities demonstrated biphasic growth, with a rapid initial growth rate followed by a slower growth rate later in the season (). Both plant height and trunk diameter were influenced by planting density. Trees growing at lower densities (4.8–10 plants/m2) were larger at the end of the growing season due to continuing rapid growth for longer throughout the season compared with trees growing at higher densities (16.7–50.0 plants/m2) (). The final plant height and trunk diameter increased as density decreased () and trees were significantly smaller at densities greater than 14.3 plants/m2 than at lower densities. Tree height and trunk diameter were closely related (). Leaf dry weight was broadly similar on trees growing at densities of 4.8–14.3 plants/m2 and was higher than from trees growing at 16.7–50 plants/m2 (). Bud dry weight was closely related to planting density with the highest values observed at low densities (4.8–6.7 plants/m2), moderate values at densities of 7.1–10 plants/m2 and lowest bud dry weights at densities above 14.3 plants/m2 (). Similarly, total tree dry weight was highest in trees planted at low densities (4.8–7.1 plants/m2), intermediate at densities of 8.3–14.3 plants/m2 and lowest in trees planted at high densities (16.7–50 plants/m2) (). New roots were not a significant contributor to total tree dry weight, regardless of planting density. There was a significant positive relationship between total leaf area and tree dry weight (r = 0.809, P < 0.01). Both net biomass increase per unit area and LAI increased with increasing planting density () with trees grown at the highest density (50 plants/m2) being significantly higher than those of other densities. LAI of trees at moderate densities (10–20 plants/m2) were significantly higher than those at lower densities (4.8–8.3 plants/m2), while the net biomass increase per unit area was similar at densities from 6.3–20 plants/m2. Statistical analysis also showed that net biomass increase per unit area was significantly positively correlated with LAI (r = 0.994, P < 0.01).
Effects of planting density on nutrient status
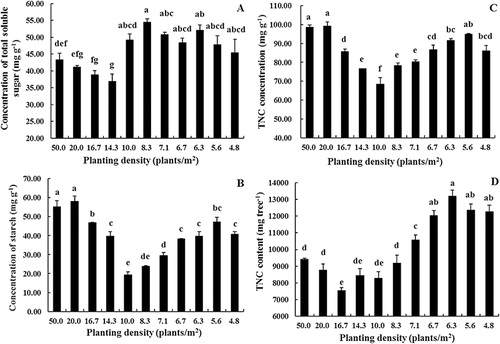
While there were some treatment effects on the concentration of total soluble sugars (TSS), there was no overall effect of planting density on TSS (). A similar situation was evident for the concentrations of starch () and TNC (). The TNC per plant, however, was affected by planting density; plants at lower densities had higher TNC concentrations ().
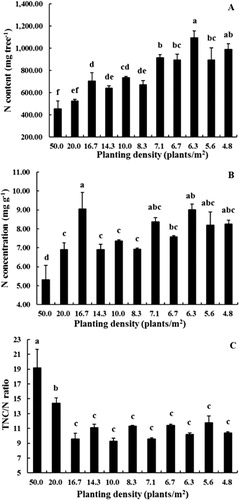
Total N content per tree was inversely related to planting density (, r = −0.763, P < 0.01). However, data for N concentration were more variable and no relationship with planting density was evident (). The TNC/N ratio () decreased markedly in trees at densities from 50–16.7 plants/m2 and then remained constant at densities from 4.8–14.3 plants/m2.
Discussion
During the initial growth stage (from April to June), plant growth was linear and similar for all planting densities (). Early growth is primarily dependent on nutrients stored from the previous year (Loescher et al. Citation1990; Millard Citation1995; Tagliavini et al. Citation1998; Cheng & Fuchigami Citation2002), therefore the lack of an effect of density on early growth is not surprising. Similarly, early in the season competition for light, water and nutrients would have been unlikely to be limiting, even at the highest plant densities. All trees had rapid initial growth (c. 8 mm/day in plant height) followed by much slower growth (0.5–2.5 mm/day), but the duration that trees exhibited rapid vs slower growth depended on planting density. Trees planted at density of 16.7–50 plants/m2 grew at the higher growth rate for only 2 months, whereas trees at lower densities grew rapidly for 5 months (). Previously, rootstocks were found to affect shoot growth in a similar way where trees growing on rootstocks differing in vigour were found to have similar initial growth rates and final shoot length was dependent on the duration of rapid growth (Hirst & Ferree Citation1995). High seedbed densities also reduced the growth of ash (Fraxinus angustifolia) and black walnut (Juglans nigra) (Cicek et al. Citation2007; Woeste et al. Citation2011). Stem diameter and the number of feathers were positively related with subsequent orchard productivity (van Oosten Citation1978), so we would expect trees grown at lower densities in the nursery to perform better once transplanted into orchard situations.
The weight of axillary buds was very responsive to planting density, with buds on trees grown at low densities having dry weight more than an order of magnitude greater than those grown at high densities (). Previously, bud quality in young peach trees was found to be largely controlled by N supply (Jordan et al. Citation2011) suggesting bud size could be a good indicator of apple nursery tree quality. Furthermore, analysis of mineral nutrient levels in buds may be another prospective measure of nursery tree quality assessment (Wilson & Jacobs Citation2006). In the past, measures of nursery tree quality have been simple measures of growth (typically tree caliper and number of branches); the more precise measures suggested here may be more useful but need to be followed over time to determine the relationship with orchard performance of nursery trees.
N content is an important indicator reflecting the nutritional status of a plant, as the stored N controls the early growth and the development of the plant the following year (Jordan et al. Citation2011). The studies of Bi et al. (Citation2004), Cheng & Fuchigami (Citation2002) and Dong et al. (Citation2001) have shown that N concentration of young fruit trees (1 or 2 years old) is closely correlated with their growth the following year. Moreover, a negative relationship between TNC and N concentration has been reported in young apple trees (Cheng & Fuchigami Citation2002; Cheng et al. Citation2004), although no such relationship was found in our study (data not presented). These studies also showed that spring growth was highest on trees with high N concentrations and low TNC concentrations. In our study, trees grown at lower densities were largest and also generally had higher N concentrations and N per plant (, ). Furthermore, total TNC content was highest in trees grown at lower densities indicating that trees grown at lower densities in the nursery may perform better the following year once they are transplanted into an orchard setting ().
In summary, trees at lower density were larger in terms of height, caliper, leaf size, leaf area, leaf dry weight per tree, bud weight, plant dry weight, and N and TNC per plant. Trees with these characteristics would be expected to result in better orchard performance. Because of the negative relationships of these factors with tree density, the development of specific commercial recommendations requires a trade off in these various tree characteristics with tree density. Based on the data presented here, we suggest that tree densities up to 10 plants/m2 represents the optimum density where tree growth can be optimized while still achieving moderately high plant densities. Future research should focus on the orchard performance of trees grown at densities up to 10 plants/m2.
Supplementary data
Supplementary file 1: Figure S1. An example of field arrangement in our study.
Figure 1. An example of field arrangement in our study.
Download PDF (176.1 KB)Acknowledgements
This work was supported by National Apple Industry Technology System of Agriculture Ministry of China (CARS-28), Technological Achievement Transformation Programme (2011GB23600009) and Spark Plan Programme (2010GA850012) of Science and Technology Ministry of China. The authors are grateful to Mr Gaochao Li for field management of our experiments.
References
- Bao S 2005. Soil and agricultural chemistry analysis. Beijing, China Agriculture Press. Pp. 25–108. ( In Chinese)
- Bi G, Scagel CF, Fuchigami LH 2004. Effects of spring soil nitrogen application on nitrogen remobilization, uptake, and partitioning for new growth in almond nursery plants. Journal of Horticultural Science and Biotechnology 79: 431–436.
- Chen X, Han M, Su G, Liu F, Guo G, Jiang Y et al. 2010. Discussion on today's world apple industry trends and the suggestions on sustainable and efficient development of apple industry in China. Journal of Fruit Science 27: 598–604. ( In Chinese, with English abstract)
- Cheng L, Fuchigami LH 2002. Growth of young apple trees in relation to reserve nitrogen and carbohydrates. Tree Physiology 22: 1297–1303. 10.1093/treephys/22.18.1297
- Cheng L, Ma F, Ranwala D 2004. Nitrogen storage and its interaction with carbohydrates of young apple trees in response to nitrogen supply. Tree Physiology 24: 91–98. 10.1093/treephys/24.1.91
- Cicek E, Cicek N, Bilir N 2007. Effects of seedbed density on one-year-old Fraxinus angustifolia seedling characteristics and outplanting performance. New Forests 33: 81–91. 10.1007/s11056-006-9015-6
- Dong S, Cheng L, Fuchigami LH 2001. Effects of nitrogen fertigation on reserve nitrogen and carbohydrate status and regrowth performance of pear nursery plants. Acta Horticulturae 564: 51–62.
- Ferree, DC, Rhodus WT 1987. Early performance and economic value of feathered apple trees on semi-standard rootstocks. Journal of the American Society for Horticultural Science 112: 906–909.
- Han M 2009. Apple intensive and high-efficiency planting system with dwarfing rootstock. Friends of Fruit Growers 9: 12. ( In Chinese)
- Hirst, PM, Ferree DC 1995. Effect of rootstock and cultivar on the growth and precocity of young apple trees. Fruit Varieties Journal 49: 34–41.
- Jordan MO, Vercambre G, Bot JL, Adamowicz S, Gomez L, Pages L 2011. Autumnal nitrogen nutrition affects the C and N storage and architecture of young peach trees. Trees: Structure and Function 25: 333–344. 10.1007/s00468-010-0509-7
- Li H, Zhao H, Li H 2008. Problems of apple nursery breeding in China and the solutions. Shanxi Fruits 6: 35–36. ( In Chinese)
- Li G, Zhang Q, Song X, Song C, Han M, Zhao C 2011. Investigation and analysis of apple nursery quality in Shaanxi Province. Journal of Northwest A&F University (Natural Science Edition) 39: 158–164. ( In Chinese, with English abstract)
- Loescher WH, McCamant T, Keller JD 1990. Carbohydrate reserves, translocation and storage in woody plant roots. Hortscience 25: 274–281.
- Millard P 1995. Internal cycling of nitrogen in trees. Acta Horticulturae 386: 3–14.
- Milosevic T, Milosevic N 2011. Influence of cultivar and rootstock on early growth and syllepsis in nursery trees of pear (Pyrus communis L., Roseacea). Brazilian Archives of Biology and Technology 54: 451–456.
- Popenoe J, Barritt BH 1988. Branch induction by growth regulators and leaf removal in ‘Delicious’ apple nursery stock. HortScience 23: 859–862.
- Rosa M, Hilal M, González JA, Prado FE 2009. Low-temperature effect on enzyme activities involved in sucrose–starch partitioning in salt-stressed and salt-acclimated cotyledons of quinoa (Chenopodium quinoa Willd.) seedlings. Plant Physiology and Biochemistry 47: 300–307. 10.1016/j.plaphy.2008.12.001
- Tagliavini M, Millard P, Quartieri M 1998. Storage of foliar absorbed nitrogen and remobilization for spring growth in young nectarine (Prunus persica var. nectarina) trees. Tree Physiology 18: 203–207. 10.1093/treephys/18.3.203
- Van Oosten HJ 1978. Effect of initial tree quality on yield. Acta Horticulturae 65: 123–125.
- Volz RK, Gibbs HM, Popenoe J. 1994. Branch induction on apple nursery trees: effects of growth regulators and defoliation. New Zealand Journal of Crop and Horticultural Science 22: 277–283. 10.1080/01140671.1994.9513836
- Wang J, Xue X 2003. Nursery propagation manual for several excellent cultivars of deciduous fruit trees. Beijing, Jindun Press. Pp. 256–297. ( In Chinese)
- Wang J, Xue X, Lu C 2010. Situation and development strategy of apple production in China. Shandong Agricultural Science 6: 117–119. ( In Chinese)
- Wertheim SJ 1989. Preliminary results of trials with dwarfing apple and pear rootstocks. Acta Horticulturae 243: 59–70.
- Wilson BC, Jacobs DF 2006. Quality assessment of temperate zone deciduous hardwood seedlings. New Forests 31: 417–433. 10.1007/s11056-005-0878-8
- Woeste KE, Jacobs DF, McKenna JR 2011. Half-sib seed source and nursery sowing density affect black walnut (Juglans nigra) growth after 5 years. New Forests 41: 235–245. 10.1007/s11056-010-9224-x
- Wu B, Li S, Quilot B, Génard M, Kervella J 2003. Influence of hairless of fruit epidermis and flesh color on contents of sugars and acids and their relationship in peach. Scientia Agricultura Sinica 36: 1540–1544. ( In Chinese with English abstract)