
Abstract
Sour cherries (Prunus cerasus L.) are rich in anthocyanins and have a correspondingly high antioxidant activity and potential health benefits with respect to the prevention of many diseases, including cancers and diabetes. As one of the centres of origin of the subgenus Cerasus, Iran is rich in cherry germplasm resources. The aim of this research was to evaluate promising Iranian sour cherries for different fruit quality characteristics. Generally, significant differences (P ≤ 0.05) were observed across the sour cherry genotypes for characters such as fruit weight (FW) (1.89–5.51 g), firmness (0.17–0.37 Nmm−1), total sugars (14.57–21.54 °Brix), titratable acidity (0.91%–2.81% malic acid), total organic acids (381.04–1742.50 mg 100 g−1), total phenolic content (184.10–625.38 mg GAE 100 g−1), total anthocyanin content (17.49–123.80 mg cy-3-gly 100 g−1) and total antioxidant activity (10.09%–28.79% FW). In addition, a wide variation in fruit colour and sensory quality were observed within the studied genotypes. It was found that Iranian selections such as KaThLaSSGe21, Hamedan, KaTaJo2Ge9, KrRIV4C20, EsASC1V1SS1 and KaThLa3Ge23 generally scored higher for desirable fruit characteristics across this range of parameters than existing commercial genotypes used as the control comparisons. Thus, they can be considered as promising genotypes for further evaluation in cherry breeding programmes, as well as being potentially useful for the cherry juice/concentrate industry.
Introduction
Epidemiological studies have found a strong correlation between fruit consumption and reduced risk of several degenerative diseases linked to oxidative stress, including cancers, cardiovascular disease and stroke (Ames et al. Citation1993; Ma & Kinner Citation2002). The human physiology underlying this correlation is not yet resolved, but the presence of antioxidant compounds in the fruit has been suggested as a possible basis of these protective health factors (Leborgne et al. Citation2002; Piccolella et al. Citation2008). Sour cherry (Prunus cerasus L.) is the most studied stone fruit species in terms of its antioxidant potential and health promoting effects (Papp et al. Citation2008). The sour cherry tree is cultivated for fresh fruit production and also for processing use in jam or liquor production. The species is reported to have originated from an area that includes Asia Minor, Iran, Iraq and Syria (Vavilov Citation1951). According to the Food and Agriculture Organisation database, in 2011, Iran ranked third in cherry production worldwide, at 241,000 tonnes, after Turkey and the USA (FAO Citation2013).
The main characteristics related to sour cherry fruit quality are weight, colour, sweetness, sourness, acidity and firmness (Crisosto et al. Citation2003; Siddiq et al. Citation2011), with colour being a particularly important quality indicator for fresh fruit. Anthocyanins are the plant pigments responsible for the colour of many fruits, including sour cherry (Pedisic et al. Citation2009) and pomegranate (Varasteh et al. Citation2012). In addition to anthocyanins, sour cherry fruit contain a range of other compounds with antioxidant activity, including several other flavonoids and polyphenolics (Wang et al. Citation1999a). Of these, the anthocyanins and other phenolics are considered the most prominent group of compounds and the major contributors to the cherries' antioxidant capacity (Wang et al. Citation1997; Seeram et al. Citation2001; Kang et al. Citation2003; Chaovanaliki & Wrolstad Citation2004; Bonerz et al. Citation2007; Jakobek et al. Citation2007), with the total antioxidant capacity of fresh and processed sour cherry fruit having been determined using several different assays (DPPH, ORAC, FRAP, etc.) (Piccolella et al. Citation2008; Papp et al. Citation2010; Siddiq et al. Citation2011). It has been proposed that such antioxidant metabolites have an important role in reducing the oxidative stress and inflammation that exacerbate heart and other diseases in humans (Seymour et al. Citation2008), and cherry fruit extracts have been found to have anti-inflammatory properties (Wang et al. Citation1999b; Seeram et al. Citation2001; Mulabagal et al. Citation2009), alleviate muscle damage (Connolly et al. Citation2006), inhibit intestinal tumour development in ApcMin mice and reduce proliferation of human colon cancer cells (Kang et al. Citation2003).
It is therefore important to evaluate the main quality and antioxidant properties of sour cherry genotypes that may be used in breeding programmes for new cultivars. As a centre of origin of the subgenus Cerasus, Iran is rich in cherry germplasm resources. Using diverse Cerasus subgenus resources to broaden the genetic base of cherry cultivars and rootstocks and improving them for use in the cherry industry are important goals for cherry breeders in Iran (Ganji-Moghadam & Khalighi Citation2007; Shahi-Gharahlar et al. Citation2010). Therefore, it is necessary to evaluate and preserve these genotypes and cultivars (Demirsoy & Demirsoy Citation2004). Primary evaluation of the collected sour cherry genotypes relating to the local cherry breeding programmes in Iran showed that some of the collected genotypes had superior growth characteristics and fruit quality attributes that could contribute to future cultivar development (Bouzari et al. Citation2010). The main aim of the current study was a more comprehensive evaluation of these promising genotypes for their fruit quality characteristics. The results will be useful to cherry breeding programmes in Iran as well as have significance for sour cherry growers and processors worldwide.
Materials and methods
Plant materials
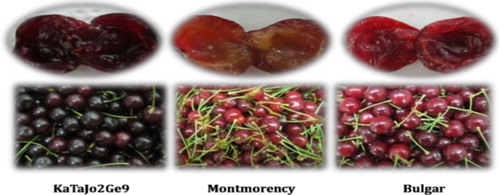
The plant materials used were pre-selected mature sour cherry genotypes that had been observed visually for 5 years. These genotypes were previously collected from different regions of Iran and planted on ‘Mahalab’ rootstocks in the Kamal-Shahr Collection orchard at the Seed and Plant Improvement Institute in Karaj, Iran (Bouzari et al. Citation2010). Iranian sour cherry genotypes not yet developed as cultivars were KaThLa1SSGe21, Hamedan, KaTaJo2Ge9, KaThMe3Ge19, KaThLa8Ge31, KrRIV4C20, EsASC1V1SS1 and KaThLa3Ge23. Four improved cultivars were included for comparison: ‘Bulgar’, ‘Montmorency’, ‘Early Jubileum’ and ‘Erdi Botermo’.
Fruit sampling and preparation
Fruit samples were randomly harvested at the optimum commercial maturity based on fruit maturity and colour development. Fruit samples (0.5 kg) were transferred to the Pomology Laboratory at Tarbiat Modares University immediately after harvest for further fruit quality attribute measurements. Fruit weight, firmness, sensory quality, colour, total sugars, pH and titratable acidity were determined using fruit from the 2011 and 2012 growing seasons. Measurements were carried out with three replications using 10 fruit as one replicate on each studied genotype or cultivar. For determination of specific organic acids, total phenolic content (TPC), total anthocyanin content (TAC) and total antioxidant activity (TAA), cherries were pitted manually, frozen in liquid nitrogen and then stored at −80 °C until the time of analysis.
Determination of the fruit main quality parameters
Fruit weight (FW) was recorded using a balance with 0.01 g sensitivity, and fruit firmness (FF) was measured using a texture analyser (Instron Texture Analyzer, H5KS, UK) equipped with a 500 N load cell. A conical penetration probe was used to penetrate the fruit and the force required was recorded in newtons (N force) (Siddiq et al. Citation2011). Testing parameters used were a cross-head speed of 10 mm min−1 and a penetration depth of 5 mm. In order to measure the sensory quality of fruit, 30 fruit of each genotype were selected and tested by 10 experienced people. Tested characteristics included colour, flavour, texture and overall acceptability such as appearance and attractiveness. The test was carried out based on the Hedonic scale and scoring method (Clark et al. Citation2002). Also, fruit colour was monitored using the colorimetric CIE LAB method with a Minolta Chroma Meter (Konica Minolta, Japan). Colour values were recorded as CIE L* (0, black; 100, white), a* (−a, greenness; +a, redness) and b* (− b, blueness; +b, yellowness). The chroma [(a*)2 + (b*)2]1/2 and hue, attributes of chromaticity, indicate a measure of the colour intensity and of the visual property normally regarded as colour, respectively. The hue was calculated as [arctan b*/a*] (radian) (Little Citation1975). Total sugars (TS) were determined using a sugar meter (Sugar Meter, GMK-703, Korea) and expressed in °Brix. The pH was measured with a pH meter (Metrohm, 744). Titratable acidity (TA) was determined by neutralization to pH 8.3 using 0.1 N NaOH, then data were presented as % malic acid (Chen & Mellenthin Citation1981). The TS/TA was used as an indicator of taste quality (Crisosto et al. Citation2003) and ripening index (Ferrer et al. Citation2005).
Determination of the specific organic acids
The frozen samples (50 g) were homogenized using a manual blender. After homogenizing, 5 g of fruit were dissolved with 5 mL of twice distilled water for 30 min at room temperature. The extracted sample was centrifuged at 10,000 × g for 10 min at 4 °C. The supernatant was filtered through a filter paper (0.45 µm cellulose ester filter) and C18 cartridge before use in analyses. Aliquots (40 µL) were injected in three replications into a high-performance liquid chromatography (HPLC) system (Sykam, Germany) using a C18 column (250 × 4.6 mm, Kromasil, USA) and a UV detector (Sykam, S3210 UV/Vis Detector) set at 205 nm. Elution was carried out with 50 mM H3PO4 buffer (as mobile phase) at 0.6 mL min−1 flow rate. The organic acids (malic, ascorbic and citric) were identified and quantified by comparison of retention times and peak areas with standard solutions of known acids. Concentrations were expressed as mg 100 g−1 FW.
Determination of the total phenolic content
For the extraction of antioxidants, the frozen samples (50 g) were homogenized using a manual blender. After homogenizing, 1 g was dissolved with 5 mL of methanol for 30 min at room temperature. The extracted sample was centrifuged at 10,000 × g for 10 min at 4 °C and the supernatant recovered and used for determination of the total phenolic, total anthocyanin and total antioxidant activity. The TPC was determined using the modified Folin-Ciocalteu procedure described by Singleton & Rossi (Citation1965). For 10 µL of the sample extracts, 1.04 mL of twice distilled water and 100 µL of Folin-Ciocalteau reagent (2N) were added, then after 10 min at room temperature, 150 µL of sodium carbonate (20% w/v) was added. The extracts were mixed and allowed to stand for 30 min at 40 °C before measuring the absorbance at 765 nm using a spectrophotometer (Perkin Elmer, Lambda 25, UV/VIS spectrometer, USA). All samples were prepared in triplicate. TPC was expressed as mg GAE 100 g−1 FW.
Determination of the total anthocyanin content
The TAC of the methanol extract was measured using a colorimetric assay according to the protocol described by Giusti & Wrolstad (Citation2001). The extract (75 µL) was dissolved in sodium acetate (0.4 M, pH 4.5, 1.5 mL) and potassium chloride (25 mM, pH 1.0, 1.5 mL) and then the absorbance was recorded at 530 and 700 nm and expressed as mg cyanidin 3-glycoside 100 g−1 FW.
Determination of total antioxidant activity
The TAA of the extracts was measured using the DPPH (1.1-diphenyl-2-picrylhydrazyl) method of Brand-Williams et al. (Citation1995) with some modifications. Briefly, 2.5 µL methanol solution of each extract (diluted 1:5 (v/v) with methanol) was placed in the 96-well micro plates, and then 982.5 µL of methanol and 240 µL of 0.1 mM methanol solution of DPPH was added and allowed to react in the dark at room temperature. The decrease in absorbance of DPPH at 520 nm was measured at 5 min intervals until the absorbance stabilized (30 min) and was expressed as percentage inhibition (Jakobek et al. Citation2007):
% inhibition = [(ADPPH- AJuice)/ADPPH)) × 100
where ADPPH is the absorbance value of the DPPH blank solution, and AJuice is absorbance value of the sample solution.
Data analysis
All data were statistically analysed using one-way analysis of variance (ANOVA) and means comparisons were made using Duncan's multiple range test (DMRT) using SAS (Version 9.1). Correlations among the traits were determined using the Pearson's simple correlation coefficient by SPSS (Version 16.0).
Results and discussion
Fruit main quality parameters
The studied genotypes varied for fruit weight in a range from 1.89 to 5.51 g, with KaThLa3Ge23 and ‘Erdi Botermo’ having the highest fruit weight score (5.51 g) followed by EsASC1V1SS1 (5.23 g) (). Fruit weight is an important quality attribute of cherries (Siddiq et al. Citation2011) and has the greatest effect on yield (Iezzoni et al. Citation1991; Rakonjac & Nikolic Citation2008). From a processing perspective, fruit with a relatively higher weight are desirable as they result in reduced solid waste (mainly pits) per tonne of cherries processed (Siddiq et al. Citation2011). Smaller fruits are primarily processed into juice or jam, while larger fruits can be consumed both fresh and processed. Sour cherry is primarily a processed fruit. However, fresh consumption has gained in popularity more recently where suitable cultivars are available (Papp et al. Citation2010). Variations in fruit weight have been previously investigated in sour cherries (Yarilgac Citation2001; Rodrigues et al. Citation2008; Papp et al. Citation2010; Rakonjac et al. Citation2010; Siddiq et al. Citation2011). In comparison with those data, the fruit weight of KaThLa3Ge23 and EsASC1V1SS1 are much higher than the highest fruit weights determined in promising sour cherries genotypes (‘Oblacinska’, 5.01 g; Rakonjac et al. Citation2010) and Turkish germplasm (3.39 g; Yarilgac Citation2001).
Table 1 Mean values of fruit weight, firmness, sensory quality, total sugars (TS), pH, titratable acidity (TA), and TS/TA of the studied sour cherry genotypes.
Fruit firmness showed a wide variation across the studied genotypes, from 0.17 to 0.37 Nmm−1. The highest firmness was found for KaThLaSSGe21 and KaThMe3Ge19, followed by Hamedan, KaTaJo2Ge9, KaThLa8Ge31 and KrRIV4C20, with all of these having higher fruit firmness scores than cultivars such as ‘Bulgar’, ‘Montmorency’ and ‘Erdi Jubileum’ (). Firmness is an important fruit quality attribute of cherries with regard to customer acceptability and has been previously investigated in several studies (Crisosto et al. Citation2002; Celikel et al. Citation2006; Rodrigues et al. Citation2008; Siddiq et al. Citation2011). Sour cherry fruit, due to low penetration resistance and high rates of respiration, shows high post-harvest weight loss compared with other fruit (Boriss et al. Citation2006). Since sour cherry fruit thus suffers rapid post-harvest quality loss, firmness is one of the important factors in the marketability of fruit. Fruit with a long period of shelf life have a high market value, and the higher firmness of the Iranian sour cherry genotypes compared with the controls means they present promising breeding resources in this respect. Moreover, EsASC1V1SS1, KaThLa3Ge23, Hamedan, KaTaJo2Ge9 and KaThLaSSGe21 also had the best fruit sensory quality score compared with controls such as ‘Bulgar’, ‘Montmorency’ and ‘Erdi Botermo’. These genotypes also showed attractive fruit background appearance, sweetness and flavour. Also, Rodrigues et al. (Citation2008) determined eating quality of sour cherry cultivars in a germplasm bank at Portugal with the score of 1 to 9 from extremely poor to extremely good. The evaluation of the sensory quality is summarized in .
Total sugars ranged from 14.57 to 21.54 °Brix (). The highest total sugars were obtained from KaThLaSSGe21 (21.54 °Brix), KrRIV4C20 (21.40 °Brix) and Hamedan (21.39 °Brix). Fruit total sugar is an important quality attribute of cherries (Rodrigues et al. Citation2008) with higher TS offering a processing benefit, especially when cherry juice concentrate is to be made. Cherry juice with a higher TS level as starting material saves time and energy, resulting in lower processing costs (Siddiq et al. Citation2011). The TS values of KaThLaSSGe21, KrRIV4C20 and Hamedan were higher than the values determined by Chaovanaliki & Wrolstad (Citation2004) (14.43–18.38 °Brix), Rakonjac et al. (Citation2010) (9.9–12.2 °Brix), Siddiq et al. (Citation2011) (13.7–20.2 °Brix) or Yarilgac (Citation2001) (9.8–16.8 °Brix).
The titratable acidity values ranged from a low of 0.91% malic acid in ‘Montmorency’ to a high of 2.81% malic acid in KrRIV4C20, followed by KaThLa8Ge31 (2.08% malic acid), Hamedan (2.06% malic acid), KaTaJo2Ge9 (2.04% controls malic acid), KaThMe3Ge19 (2.02% malic acid), EsASC1V1SS1 (1.22% malic acid) and KaThLa3Ge23 (1.15% malic acid). The TA of these genotypes is higher than the values determined in Siddiq et al. (Citation2011) (1.13%–1.41% malic acid). Fruit acidity is a major contributor to the flavour quality of cherries (Rodrigues et al. Citation2008), as differences in the acid levels can result in noticeable variations in the sensory profile of the final prepared products (Siddiq et al. Citation2011).
pH values ranged from 3.19 to 3.82, and TS/TA or ripening index ranged from 5.63 to 19.54. TS/TA ratio is the most important fruit quality factor influencing customer acceptance (Crisosto et al. Citation2002; Celikel et al. Citation2006). KaThLaSSGe21 had the highest TS/TA ratio (19.54). Based on the results, the Iranian genotypes had better TS, TA and TS/TA profiles than the control commercial cultivars.
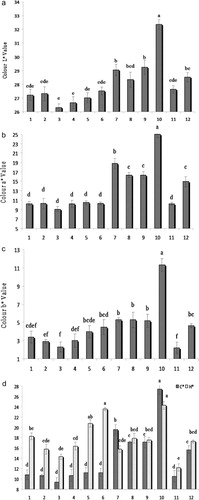
Significant differences were found among the genotypes in colour parameters. Instrumental colour values are shown in . Fruit colours were light to dark red with L* value 26.31–32.38, a* value 9.07–24.97, b* value 2.21–11.32, H* value 12.21–24.27 and C* value 9.36–27.45. KaTaJo2Ge9 had the highest redness with a* value (9.07) compared with other genotypes, followed by KaThMe3Ge19 with a* value (10.22), KaThLaSSGe21 (10.26), Hamedan (10.27), KrRIV4C20 (10.31) and KaThLa8Ge31 (10.46), with these scores representing higher fruit redness than the ‘Bulgar’ (16.33), ‘Montmorency’ (24.97) and ‘Erdi Botermo’ (14.94) controls. Colour is an important fruit quality attribute, previously investigated in sour cherries (Yarilgac Citation2001; Rodrigues et al. Citation2008; Khadivi-Khub et al. Citation2011; Siddiq et al. Citation2011) that is affected by cultivar, time of harvest (Goncalves et al. Citation2006) and anthocyanin content (Gao & Mazza Citation1995; Goncalves et al. Citation2006). Total anthocyanins in red fruit increase during ripening (Marinova et al. Citation2005; Pedisic et al. Citation2009). Mozetic et al. (Citation2004) reported that the L* value is an indicator of anthocyanin content in fruit maturity and is better than using a* and b* values. The lower L* value indicates darker fruit colour. The Iranian sour cherries, especially KaTaJo2Ge9, had a lower L* value compared with controls, indicating they are dark red and likely to have the highest anthocyanin content.
Specific organic acids
Organic acid levels showed a high variability across different genotypes (). The malic acid contents ranged from 295.32 (‘Erdi Botermo’) to 1634.16 (KrRIV4C20) mg 100 g−1 FW, ascorbic acid ranged from 0.65 (‘Erdi Jubileum’) to 14.23 (EsASC1V1SS1) mg 100 g−1 FW, citric acid ranged from 7.05 (KaThLa3Ge23) to 197.62 (KaThMe3Ge19) mg 100 g−1 FW and total acids ranged from 381.04 (KaThLaSSGe21) to 1742.50 (KrRIV4C20) mg 100 g−1 FW. The taste of sour cherries is influenced by having a relatively higher acidity compared with sweet cherries (Crisosto et al. Citation2003). In agreement with previous studies (Serrano et al. Citation2005; Usenik et al. Citation2008; Gundogdu & Bilge Citation2012), the malic acid content was higher than that of other organic acids and is the dominant organic acid of cherries. Usenik et al. (Citation2008) examined 13 cherry cultivars and reported that their malic acid contents ranged between 353 and 812 mg 100 g−1 and citric acid between 11 and 54 mg 100 g−1. Gundogdu & Bilge (Citation2012) examined four cherry cultivars and reported that their malic acid contents ranged between 952 and 1391 mg 100 g−1 and citric acid between 69 and 308 mg 100 g−1. Also, Papp et al. (Citation2010) reported that the highest ascorbic acid content in sour cherry cultivars was 8.9 mg 100 g−1. KrRIV4C20, followed by KaThMe3Ge19, KaThLa8Ge31, Hamedan and KaTaJo2Ge9, had higher malic acid and total acids than those previously measured, whereas EsASC1V1SS1 and KaThMe3Ge19 had a higher ascorbic acid content than those published before.
Table 2 Mean values of organic acid concentrations of the studied sour cherry genotypes.
Total phenolic content
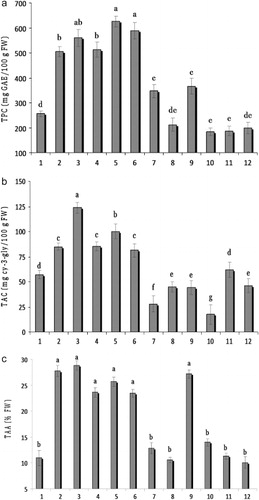
The total phenolic content across the genotypes ranged from 184.10 to 625.38 mg GAE 100 g−1 FW (), with the highest value being from KaThLa8Ge31 (625.38 mg GAE 100 g−1 FW), followed by KrRIV4C20 (588.30 mg GAE 100 g−1 FW), KaTaJo2Ge9 (560.11 mg GAE 100 g−1 FW), KaThMe3Ge19 (513.23 mg GAE 100 g−1 FW) and Hamedan (505.20 mg GAE 100 g−1 FW). Previous studies reported that the total phenolic content of sour cherries varied from 78 to 500 mg GAE 100 g−1 FW (Kim et al. Citation2005; Bonerz et al. Citation2007; Dragovic-Uzelac et al. Citation2007), which is lower than the values for some of the genotypes studied here.
Total anthocyanin content
The total anthocyanin content varied between 17.49 and 123.80 mg cy-3-gly 100 g−1 FW (), with the highest value being from KaTaJo2Ge9 (123.80 mg cy-3-gly 100 g−1 FW), followed by KaThLa8Ge31 (100.23 mg cy-3-gly 100 g−1 FW), KaThMe3Ge19 (85.46 mg cy-3-gly 100 g−1 FW), Hamedan (85.01 mg cy-3-gly 100 g−1 FW), KrRIV4C20 (81.38 mg cy-3-gly 100 g−1 FW) and KaThLaSSGe21 (57.14 mg cy-3-gly 100 g−1 FW). These were higher levels than found in the comparative control cultivars, and were accompanied by having the strongest red coloration. Anthocyanins are regarded as an indicator of sour cherry quality (Mazza & Maniati Citation1993; Pedisic et al. Citation2009), attracting interest for their possible health benefits (Wang et al. Citation1999b). Variations in sour cherry fruit total anthocyanin content have been reported in Kim et al. (Citation2005) (49–100 mg cy-3-gly 100 g−1 FW), Simunic et al. (Citation2005) (2–28 mg cy-3-gly 100 g−1 FW), Papp et al. (Citation2010) (11.31–93.48 mg cy-3-gly 100 g−1 FW) and Siddiq et al. (Citation2011) (3–39 mg cy-3-gly 100 g−1 FW). In comparison with the published data, some of the Iranian sour cherries, especially the KaTaJo2Ge9 genotype, had a significantly higher total anthocyanin content ().
Total antioxidant activity
The DPPH radical scavenging assay is commonly employed to evaluate the ability of antioxidant to scavenge free radicals (Melichacova et al. Citation2010), as an indicator of possible related human health benefits. Total antioxidant activity of fruit across the germplasm measured by DPPH assay ranged from 10.09%–28.79% (), with KaTaJo2Ge9 (28.79%) having the highest activity, followed by Hamedan (27.77%), ‘Bulgar’ (27.16%), KaThLa8Ge31 (25.67%), KaThMe3Ge19 (23.62%) and KrRIV4C20 (23.47%). Sour cherries are comparatively rich in anthocyanins and possess high antioxidant activity (Siddiq et al. Citation2011), yet surprisingly few studies have compared antioxidant capacities of several sour cherry cultivars (Simunic et al. Citation2005; Veres et al. Citation2006). Values of total antioxidant activity of tart cherry extracts in Melichacova et al. (Citation2010) ranged from 5.4%–9.9% of inhibition of DPPH, and some of the Iranian sour cherry genotypes examined here had significantly higher values.
Correlations among the measured parameters
The correlations among the parameters are shown in . There were positive correlations between firmness and total sugars (r = 0.58), total acids (r = 0.60), TPC (r = 0.68) and TAC (r = 0.74). There were negative correlations between fruit weight and fruit titratable acidity and firmness, respectively (r = −0.68, r = −0.73), and there was a positive correlation between firmness and titratable acidity (r = 0.63). On the other hand, fruit with lower weight had higher firmness and titratable acidity. In addition, titratable acidity positively correlated with parameters such as malic acid (r = 0.93), total acids (r = 0.93), TPC (r = 0.90), TAC (r = 0.72) and TAA (r = 0.83). Also, malic acid positively correlated with the total acids, TPC, TAC and TAA. In addition, citric acid was positively correlated with the TPC and TAC. Total acids were positively correlated with TPC, TAC and TAA. It was found that there were correlations among colour parameters. TPC correlated with TAC (r = 0.80) and TAA (r = 0.86) and also TAC correlated with TAA (r = 0.70). Sour cherries from the cultivars that are abundant in total phenolic content contained more total anthocyanin (Khoo et al. Citation2011). These results are in agreement with the previously reported strong correlations observed between TPC and TAA, and between TAC and TAA in sweet cherry (Vangdal & Slimestad Citation2006; Usenik et al. Citation2008).
Table 3 Pearson’s simple correlation coefficient among the fruit characteristics of the studied sour cherry genotypes.
Conclusions
Iran is known as a centre of origin and diversity for cherries. This study reports for the first time the fruit quality characteristics of a range of promising Iranian sour cherry genotypes. The various quality parameters measured here, which follows on from 5 years of observational studies, reveals marked variation in the recorded fruit attributes across the selections. The results indicate that KaThLaSSGe21 has the highest fruit quality characteristics of the genotypes examined, with regard to the high firmness, total sugars and TS/TA, as well as positive scores for taste, attractiveness and redness, and total phenolic and anthocyanin content. Hamedan had high total sugars, sensory quality, total antioxidant activity and good flavour, redness, total organic acids, total phenolic and anthocyanin content. The genotype KaTaJo2Ge9 had high redness, total anthocyanin, total antioxidant activity and also had high flavour, organic acids and total phenolic scores. KrRIV4C20 had high total sugars, flavour, total organic acids, total phenolic content, total antioxidant activity and also high sensory quality, redness and total anthocyanin. All of these mentioned genotypes are good candidates for further development for both the fresh and concentrate industries. Also, KaThLa3Ge23 had high fruit weight and sensory quality and EsASC1V1SS1 had high ascorbic acid content, sensory quality and fruit weight, making them optimal selections for fresh consumption industries. In general, the results indicate that KaThLaSSGe21, Hamedan, KaTaJo2Ge9, KrRIV4C20, EsASC1V1SS1 and KaThLa3Ge23 had better fruit attributes than the improved cultivars that were used as comparative controls in the study. The genotypes can be considered as promising for further evaluations in the framework of breeding and final new cultivar release programmes, both for fresh consumption and for cherry concentrate processors to reduce production costs. In addition, the selections with relatively higher phenolics, anthocyanins and antioxidant activity may offer significant marketing advantage, due to consumer preference for antioxidant rich products.
Acknowledgements
We thank Tarbiat Modares University for financial support and providing the facilities. Also, we acknowledge the Seed and Plant Improvement Institute for providing plant material through Grant No. 0-100-120000-04-0000-84104.
References
- Ames BN, Shigenaga MK, Hagen TM 1993. Oxidants, antioxidants, and the degenerative disease of aging. Proceedings of the National Academy of Sciences USA 90: 7915–7922. 10.1073/pnas.90.17.7915
- Bonerz D, Wurth K, Dietrich H, Will F 2007. Analytical characterization and the impact of ageing on anthocyanin composition and degradation in juices from five sour cherry cultivars. European Food Research and Technology 224: 355–364. 10.1007/s00217-006-0328-7
- Boriss H, Brunke H, Kreith M 2006. Cherries profile. Agricultural marketing resource center (Ag MRC). Ames, IA, USA, Iowa State University.
- Bouzari N, Ganji-Moghadam E, Karami F, Ghasemi A, Zarrinbal M, Hasani G et al. 2010. National project collection and evaluation of local sour cherry germplasm in order to achieve proper rootstock and cultivars, project no.0-100-120000-04-0000-84104, Seed and Plant Improvement Institute (SPII), Iran. 272 p.
- Brand-Williams W, Cuvelier ME, Berset C 1995. Use of a free radical method to evaluate antioxidant activity. Lebensmittel-Wissenschaft und Technologie 28: 25–30. 10.1016/S0023-6438(95)80008-5
- Celikel FG, Ozelkok S, Burak M 2006. A study on modified atmosphere stroge of sweet cherry. Acta Horticulturae 628: 434–438.
- Chaovanaliki A, Wrolstad RE 2004. Total anthocyanins and total phenolic of fresh and processed cherries and their antioxidant properties. Journal of Food Science 69: 67–72.
- Chen PM, Mellenthin WM 1981. Effect of harvest date on ripening capacity and postharvest life of Anjou pears. Journal of the American Society for Horticultural Science 106: 38–42.
- Clark S, Warner H, Rodriguez J, Guadalupe I, Olivas GI, Sepulved D, Bruins R et al. 2002. Residual gas and storage conditions affect sensory quality of diced pears in flexible retortable pouches. Food Quality and Preference 13: 153–162. 10.1016/S0950-3293(01)00079-9
- Connolly DAJ, Mchugh MP, Padilla-Zakour OI, Carlson L, Sayers SP 2006. Efficacy of a tart cherry juice blend in preventing the symptoms of muscle damage. British Journal of Sports Medicine 40: 679–683. 10.1136/bjsm.2005.025429
- Crisosto CH, Crisosto GM, Ritenour MA 2002. Testing the reliability of skin color as an indicator of quality for early season ‘Brooks’ cherry. Postharvest Biology and Technology 24: 147–154. 10.1016/S0925-5214(01)00190-9
- Crisosto CH, Crisosto GM, Metheney P 2003. Consumer acceptance of ‘Brooks’ and ‘Bing’ cherries is mainly dependent on fruit SSC and visual skin color. Postharvest Biology and Technology 28: 159–167. 10.1016/S0925-5214(02)00173-4
- Demirsoy H, Demirsoy L 2004. Characteristics of some local sweet cherry cultivars from Homeland. Journal of Agronomy 3: 88–89. 10.3923/ja.2004.88.89
- Dragovic-Uzelac V, Levaj B, Bursac D, Pedisic S, Radojcic I, Bisko A 2007. Total phenolics and antioxidant capacity assays of selected fruits. Agriculturae Conspectus Scientificus 72: 279–284.
- FAO 2013. FAO Statistical Databases. http://www.fao.org/ag/agl/agll/spush/ (accessed 25 November 2013).
- Ferrer A, Remon S, Negueruela AI, Oria R 2005. Changes during the ripening of the very late season Spanish peach cultivar Calanda. Feasibility of using CIELAB coordinates as maturity indices. Scientia Horticulturae 105: 435–446. 10.1016/j.scienta.2005.02.002
- Ganji-Moghadam E, Khalighi A 2007. Relationship between vigor of Iranian Prunus mahaleb L. selected dwarf rootstocks and some morphological characters. Scientia Horticulturae 111: 209–212. 10.1016/j.scienta.2006.10.028
- Gao L, Mazza G 1995. Characterization, quantitation, and distribution of anthocyanins and colourless phenolics in sweet cherries. Journal of Agricultural and Food Chemistry 43: 343–346. 10.1021/jf00050a015
- Giusti MM, Wrolstad RE 2001. Characterization and measurement of anthocyanins by UV-visible spectroscopy. In: Wrolstad RE ed. Current protocols in food analytical chemistry. New York, NY, John Wiley & Sons, Inc. Units F1.2.1–F1.2.13.
- Goncalves B, Silva AP, Moutionho-Pereira J, Bacelar E, Rosa E, Meycr A 2006. Effect of ripeness and anthocyanins in cherries (Prunus avium L.). Food Chemistry 103: 976–984. 10.1016/j.foodchem.2006.08.039
- Gundogdu M, Bilge U 2012. Determination of organics, phenolics, sugars and vitamin C contents of some cherry cultivars (Prunus avium). International Journal of Agriculture and Biology 14: 595–599.
- Iezzoni AF, Schmidt H, Albertini A 1991. Genetic resources of temperate fruit and nut crops: cherries. In: Moore JN, Ballington JR eds. Netherland, Wageningen, International Society for Horticultural Science. Pp. 109–175.
- Jakobek L, Seruga M, Medvidovic-Kosanovic M, Novak I 2007. Anthocyanin content and antioxidant activity of various red fruit juices. Deutsche Lebensmittlel-Rundschau 103: 58–64.
- Kang SY, Seeram NP, Nair MG, Bourquin LD 2003. Tart cherry anthocyanins inhibit tumor development in ApcMin mice and reduce proliferation of human colon cancer cells. Cancer Letters 194: 13–19. 10.1016/S0304-3940(02)00583-9
- Khadivi-Khub A, Zamani Z, Fatahi M 2011. Multivariate analysis of Prunus subgen Cerasus germplasm in Iran using morphological variables. Genetic Resources and Crop Evolution.
- Khoo GM, Clausen MR, Pedersen BH, Larsen E 2011. Bioactivity and total phenolic content of 34 sour cherry cultivars. Journal of Food Composition and Analysis 24: 772–776. 10.1016/j.jfca.2011.03.004
- Kim DO, Heo HJ, Kim YJ, Yang HS, Lee CY 2005. Sweet and sour cherry phenolics and their protective effects on neuronal cells. Journal of Agricultural and Food Chemistry 53: 9921–9927. 10.1021/jf0518599
- Leborgne L, Maziere JC, Maziere C, Andrejak M 2002. Oxidative stress, atherogenosis and cardiovascular risk factors. Arch. Maadies du Coeuret des Vaisseaux 95: 805–814.
- Little ACA 1975. Research note: off on a tangent. Journal of Food Science 40: 410–411. 10.1111/j.1365-2621.1975.tb02213.x
- Ma Q, Kinner K 2002. Chemoprotection by phenolic antioxidants. Inhibition of tumor necrosis factor alpha induction in macrophages. Journal of Biological Chemistry 277: 2477–2484. 10.1074/jbc.M106685200
- Marinova D, Ribarova F, Atanassova M 2005. Total phenolics and total flavonoids in Bulgarian fruits and vegetables. Journal of the University of Chemical Technology and Metallurgy 40: 255–260.
- Mazza G, Maniati E 1993. Anthocyanins in fruits, vegetables, and grains. Boca Raton, FL, CRC Press. 362 p.
- Melichacova S, Timoracka M, Bystricka J, Vollmannova A, Cery J 2010. Relation of total antiradical activity and total polyphenol content of sweet cherries (Prunus avium L.) and tart cherries (Prunus cerasus L.). Acta agriculturae Slovenica 95: 21–28.
- Mozetic B, Trebse P, Simcic M, Hribar J 2004. Changes of anthocyanins and hydroxycinnamic acids affecting the skin colour during maturation of sweet cherries (Prunus avium L.). LWT - Food Science and Technology 37: 123–128. 10.1016/S0023-6438(03)00143-9
- Mulabagal V, Lang GA, De-Witt DL, Dalavoy SS, Nair MG 2009. Anthocyanin content, lipid peroxidation and cyclooxygenase enzyme inhibitory activities of sweet and sour cherries. Journal of Agricultural and Food Chemistry 57: 1239–1246. 10.1021/jf8032039
- Papp N, Szilvassy B, Szabo Z, Nyeki J, Stefanovits-Banyai E, Hegedus A 2008. Antioxidant capacity, total phenolics and mineral element contents in fruits of Hungarian sour cherry cultivars. International Journal of Horticultural Science 14: 59–64.
- Papp N, Szilvassy B, Abranko L, Szabo T, Pfeiffer P, Szabo Z et al. 2010. Main quality attributes and antioxidants in Hungarian sour cherries: identification of genotypes with enhanced functional properties. International Journal of Food Science and Technology 45: 395–402. 10.1111/j.1365-2621.2009.02168.x
- Pedisic S, Levaj B, Dragovic-Uzelac V, Skevin D, Skendrovic-Babojelic M 2009. Color parameters and total anthocyanins of sour cherries (Prunus cerasus L.) during ripening. Agriculturae Conspectus Scientificus 74: 259–262.
- Piccolella S, Fiorentino A, Pacifico S, Dabrosca B, Uzzo P, Monaco P 2008. Antioxidant properties of sour cherries (Prunus cerasus L.): Role of colorless phytochemicals from the methanolic extract of ripe fruits. Journal of Agricultural and Food Chemistry 56: 1928–1935. 10.1021/jf0734727
- Rakonjac V, Nikolic D 2008. Variability and path coefficient analysis of yield components in Oblacinska sour cherry sub-clones. Journal of the American Pomological Society 62: 30–35.
- Rakonjac V, Fotiric M, Nikolic D, Milatovic D, Colic S 2010. Morphological characterization of Oblacinska sour cherry by multivariate analysis. Scientia Horticulturae 125: 679–684. 10.1016/j.scienta.2010.05.029
- Rodrigues LC, Morales MR, Fernandes AJB, Ortiz JM 2008. Morphological characterization of sweet and sour cherry cultivars in a germplasm bank at Portugal. Genetic Resources and Crop Evolution 55: 593–601. 10.1007/s10722-007-9263-0
- Seeram NP, Momin RA, Nair MG, Bourquin LD 2001. Cyclooxygenase inhibitory and antioxidant cyaniding glycosides in cherries and berries. Phytomedicine 8: 362–369. 10.1078/0944-7113-00053
- Serrano M, Guillen F, Martinez-Romero D, Castillo S, Valero D 2005. Chemical constituents and antioxidant activity of sweet cherry at different ripening stages. Journal of Agricultural and Food Chemistry 53: 2741–2745. 10.1021/jf0479160
- Seymour EM, Singer AAM, Kirakosyan A, Kaufman PB, Warber S, Bolling SF 2008. Altered hyperlipidemia, hepatic steatosis, and hepatic peroxisome proliferator-activated receptors in rats with intake of tart cherry. Journal of Medicinal Food 11: 252–259. 10.1089/jmf.2007.658
- Shahi-Gharahlar A, Zamani Z, Fatahi MR, Bouzari N 2010. Assessment of morphological variation between some Iranian wild Cerasus sub-genus genotypes. Horticulture, Environment, and Biotechnology 51: 308–318.
- Siddiq M, Iezzoni A, Khan A, Breen P, Sebolt AM, Dolan KD et al. 2011. Characterization of new tart cherry (Prunus cerasus L.): selections based on fruit quality, total anthocyanins, and antioxidant capacity. International Journal of Food Properties 14: 471–480. 10.1080/10942910903277697
- Simunic V, Kovac S, Gaso-Sokac D, Pfannhauser W, Murkovic M 2005. Determination of anthocyanins in four Croatian cultivars of sour cherries (Prunus cerasus). European Food Research and Technology 220: 575–578. 10.1007/s00217-004-1103-2
- Singleton VL, Rossi JA 1965. Colorimetry of total phenolics with phosphomolybdic-phosphotungstic acid reagents. American Journal of Enology and Viticulture 16: 144–158.
- Usenik V, Fabcic J, Stampar F 2008. Sugars, organic acids, phenolic composition and antioxidant activity of sweet cherry (Prunus avium L.). Food Chemistry 107: 185–192. 10.1016/j.foodchem.2007.08.004
- Vangdal E, Slimestad R 2006. Methods to determine antioxidative capacity in fruit. Journal of Fruit and Ornamental Plant Research 14: 123–131.
- Varasteh F, Arzani K, Barzegar M, Zamani Z 2012. Changes in anthocyanins in arils of chitosan-coated pomegranate (Punica granatum L. cv. Rabbab-e-Neyriz) fruit during cold storage. Food Chemistry 130: 267–272. 10.1016/j.foodchem.2011.07.031
- Veres Z, Holb I, Nyeki J, Szabo Z, Remenyik J, Fari GM 2006. High antioxidant and anthocyanin contents of sour cherry cultivars may benefit the human health: international and Hungarian achievements on phytochemicals. International Journal of Horticultural Science 12: 45–47.
- Vavilov NI ed. 1951. The origin, variation, immunity and breeding of cultivated plants. New York, Ronald. 364 p.
- Wang H, Nair MG, Iezzoni A, Strasburg GM, Booren AM, Gray JI 1997. Quantification and characterization of anthocyanins in Balaton tart cherries. Journal of Agricultural and Food Chemistry 45: 2556–2560. 10.1021/jf960896k
- Wang H, Nair MG, Strasburg GM, Booren AM, Gray JI 1999a. Novel antioxidant compounds from tart cherries (Prunus cerasus). Journal of Natural Products 62: 86–88. 10.1021/np980268s
- Wang H, Nair MG, Strasburg GM, Chang YC, Booren AM, Gray JI et al. 1999b. Antioxidant and antiinflammatory activities of anthocyanins and their aglycon, cyanidin, from tart cherries. Journal of Natural Products 62: 294–296. 10.1021/np980501m
- Yarilgac T 2001. Some characteristics of native sour cherry genotypes grown by seed in Van region. Yuzuncu Yil Universitesi, Ziraat Fakultesi, Tarim Bilimleri Dergisi (Journal of Agricultural Science) 11: 13–17.