
ABSTRACT
Predictive models using attenuated total reflectance/Fourier-transform infrared (ATR-FTIR) spectra of citrus juices have been developed for determination of soluble solids (SSC), titratable acidity (TA) and the Californian–Australian citrus industry BRIMA index. Generic models, developed using partial least squares regression, included fresh juices (n = 326) from grapefruit, lemon, mandarin (plus hybrids tangelo and tangor), oranges and interspecific hybrids. The models cover the ranges 4.0–17.6 °Brix, 0.08%–6.96% TA and −332–212 BRIMA units. Root mean square errors of prediction were 0.18 °Brix, 0.055% TA and 4 BRIMA, respectively. Spectral data acquisition time was 52 s per sample. Further analysis of navel oranges (n = 1470) demonstrated that improved models that analyse juices from single species give better prediction errors (0.12 °Brix, 0.027% TA, 3.1 BRIMA units) than generic models. It is suggested that FTIR analysis is a suitable replacement for manual titration for TA in countries where regulations allow adoption of new technologies, while simultaneously measuring SSC and industry maturity standards.
Introduction
Fourier-transform infrared (FTIR) spectroscopy is well suited for the characterisation, authentication and quantification of major constituents in liquid media such as edible oils, foods, beverages, pharmaceuticals and biofuels (Paradkar & Irudayaraj Citation2002; Boyer et al. Citation2006; Bauer et al. Citation2008; Ferrao et al. Citation2011; de la Mata et al. Citation2012; Shapaval et al. Citation2013; Rohman et al. Citation2014; Dong et al. Citation2015). Developments in FTIR technology coupled to the availability of attenuated total reflectance (ATR) cells make these instruments very attractive for use when considering the analysis of large numbers of liquid samples. Benefits include: the small sample volume required (<50 µL); ease of sample preparation; rapid throughput (from around 30 s to several minutes per sample); the ability to detect many compounds or attributes in a single sample simultaneously; and the ability to transfer chemometric models developed on one instrument across other similar instruments with negligible loss of accuracy and precision. One area in which these features would be especially useful is in the citrus industry where complementary regulations have been introduced in both California and Australia (California Department of Food and Agriculture Citation2012; Boyd Citation2014) that require determination of the soluble solids (SSC) and titratable acidity (TA) concentration in multiple juice samples to establish whether fresh fruit crops have reached acceptable maturity for harvest for commercial sale.
The US citrus industry has a long history of measuring soluble solids and titratable acidity by refractometry and titration, respectively (Chace Citation1917). Although there are now alternatives to manual or automated titration of citrus juice with sodium hydroxide, such as handheld acidity meters (Obenland et al. Citation2011), the industry has persisted with wet chemistry approaches. This has occurred because the regulations have prescribed a specific approach for acidity measurement. With Australia having recently adopted use of the Californian index to determine crop maturity, and New Zealand to follow (Laurenson Citation2015), it is timely to explore whether other technologies are acceptable alternatives for the determination of TA, where regulations are more flexible in defining how acidity can be measured.
FTIR is an obvious choice, but surprisingly, little has been published on the analysis of citrus juices by this approach. Studies on apricot (Bureau et al. Citation2009, Citation2012a), apple (Irudayaraj & Tewari Citation2003; Bureau et al. Citation2012b), blackcurrant (Camps et al. Citation2010), mango (Duarte et al. Citation2002) and tomato (Beullens et al. Citation2006) demonstrate the usefulness of FTIR in determining the composition of juice across a range of fruits. In addition, Rambla et al. (Citation1998) included some citrus samples in their analysis of sugars in fruit juices and soft drinks. In contrast, the related non-destructive technology of near-infrared (NIR) spectroscopy has been used widely to investigate internal composition of citrus for the purpose of online grading (Nicolai et al. Citation2007; Yuan et al. Citation2015, and references therein).
To use FTIR, it is necessary to develop predictive models for the attributes of interest—in this case, SSC, TA and the citrus industry maturity index—using chemometrics to relate spectral features with the results of conventional analysis of each juice analysed. This investigation has therefore focused on establishing whether models acceptable for industry use can be developed for FTIR using citrus juice samples with a wide range of compositions. A further objective was to determine how quickly samples could be analysed by this approach without unacceptable loss of accuracy or precision.
Song et al. (Citation2016) have recently used FTIR spectra to discriminate between mandarin lines based on their taxonomic relationships. However, although partial least squares (PLS) regression models for SSC and TA from extracts of lyophilised ground samples were developed as part of that process, no details concerning the models themselves or their prediction errors were reported.
Materials and methods
Fruit samples
To obtain juices with a broad range of sweetness and acidity, 152 fruit were sampled from citrus trees on private properties in the central region of the North Island around Hamilton during December 2014. In June 2015, a further 138 samples were collected from the Citrus Accession blocks at Kerikeri (north New Zealand), to cover mandarins, tangelos, tangors and more exotic species, as well as 36 navel orange samples from Gisborne, New Zealand's main citrus production region. The stage of maturity of fruit from particular species varied widely and in many cases was not representative of mature fruit suitable for consumption.
In a separate study, 1470 navel oranges were received from a national supermarket survey conducted during July and August 2015. These represented fruit grown in both New Zealand and Australia and available for purchase on the local market at that time.
Synthetic standards
To optimise parameters for routine analysis of citrus samples, a series of 37 binary standards was prepared by dilution of 15% (w/v) citric acid solution and mixed sugar solution containing 7.5% glucose, 7.5% or 7.8% fructose and 15% (w/v) sucrose. These concentrations were chosen because the ratio of individual sugars in mature fruit is close to 1:1:2 in most citrus juices, apart from very acidic species such as lemons (Kennedy & Schelstraete Citation1965; Huang et al. Citation2009). These samples were grouped into a 21 sample calibration set and a 16 sample validation set. Optimised predictive models were determined for SSC, TA and citrus industry maturity index at four different acquisition rates (16, 32, 64, 128) and three spectral resolutions (4, 8, 16 cm−1) on the classification sets. The validation set statistics were used to identify which combination resulted in the best model outcomes able to be obtained in the shortest possible running time.
A more comprehensive set of 84 binary standards was subsequently prepared from the same base solutions to assess the ability of synthetic samples to predict composition in the mixed juice set.
Analytical procedures
Juice from each fruit was squeezed into a plastic jug using a conical-shaped hand press with a fine-mesh wire sieve to remove gross particulate matter. After mixing, a 1.8 mL aliquot of juice was retained in a microtube and frozen (−20 °C) for analysis later.
Preparation for FTIR analysis involved thawing tubes and centrifuging (3 min, 13,400 rpm) in a microfuge to remove insoluble material. For collection of the FTIR spectrum (4000–400 cm−1), a small drop of juice (30 µL) was placed on the heated stage of a Bruker Alpha spectrometer (Bruker Corporation). This ensured that the spectral measurement, by ATR after a single bounce on the diamond cell, was conducted at a fixed temperature (31 °C). Each measurement took 52 s (20 s for sample warming time, 32 s for data collection) from the application of one pipette aliquot to the next. As each sample was being run, an SSC reading (Atago PAL-1 refractometer) was obtained from residual juice in the refractometer well. Samples were analysed in batches of 12, with a water sample background in between each to eliminate spectral interferences due to environmental changes, such as temperature.
It is usual to conduct spectral analysis at a fixed temperature since molecular vibrational modes are temperature-sensitive. In this study, a temperature of 31 °C was chosen as a compromise as it was sufficiently far above ‘normal’ laboratory operating conditions that small fluctuations in room temperature would not affect spectral characteristics, but not so high that the small volume samples would suffer adversely when left on the exposed ATR cell for data collection times longer than several minutes. With flow cells and samples with volatile components such as alcohol, the Bruker Alpha can be operated at temperatures as high as 40 °C.
The essential oil components from orange peel—predominantly the terpene, limonene—were found to build up and coat the ATR crystal surface over time. Thorough cleaning with ethanol or acetone between samples was necessary to remove this compound and avoid corrupting the spectra.
Acidity was determined by potentiometric titration using 1 mL aliquots of thawed juice on a Mettler Toledo Autotitrator, using 0.1 N sodium hydroxide as the titrant and an end point of pH 8.2. Results were expressed as g citric acid equivalents per 100 g of juice, or TA (%).
The citrus industry index was calculated as (Brix – TA*4)* 16.5, after the Californian citrus standard regulations for navel orange (California Department of Food and Agriculture Citation2012). The index is a scaled version of a Brix minus Acid (BRIMA) calculation (Jordan et al. Citation2001). In the context of this paper, BRIMA can be taken to mean the same as the Australian Citrus Standard (ACS), the Californian industry maturity index and the New Zealand Navel Orange Grade Standard, since all are calculated in exactly the same way.
Note, none of the SSC values in this study was ‘acid corrected’, as is often the case when industry values are reported for high acid samples.
FTIR modelling
Chemometric models were developed within Bruker's OPUS 7 software environment. Spectra and their matching SSC, TA or BRIMA data were first assembled within the Quant 2 Method Development section of OPUS. Principal component analysis (PCA) of spectral data was then used to classify spectra into those that were redundant, and those in the modelling and validation sets. Redundant spectra, those with identical scores in a PCA plot of the PC1 and PC2 plane, were first excluded. Fewer spectra with more diverse characteristics lead to better models, rather than working with larger numbers of spectra whose attributes are similar.
The group of validation spectra was set as 30% of the total remaining after the removal of redundant spectra; the proportional split can be chosen to be any number. Samples for the validation set were identified by a software-driven process in which representative scores scattered across the entire PC1-PC2 plane were selected. These samples were classified as the validation set. By default, the remaining spectra (70% of the total) formed the calibration or modelling set.
The best PLS regression models were determined iteratively by an optimisation process in which different pre-processing options (e.g. a first or second derivative with 13-point Savitsky-Solay smoothing or straight-line subtraction) were applied to the ‘fingerprint’ region of the spectrum (1800–900 cm−1) or restricted portions of that region (1800–1500, 1500–1175, 1175–1095, 1095–956, 956–900 cm−1). This was followed by cross-validation of the calibration set, where successive combinations of spectra were removed from and then added back into the classification set (a ‘Venetian blinds’ approach) to determine its ability to model the data. The best models, rank-ordered on their RMSECV (root mean square error of cross validation—standard error of differences between predicted values in the calibration set and those measured by chemical analysis), were tested against the validation set to establish which one best handled independent data.
The paper by Cozzolino et al. (2011) provides a good background to the application of multivariate data analysis to the spectroscopic evaluation of juice and fruit quality.
Results
Compositional analysis
For descriptive purposes, juices were grouped into five broad categories as follows: grapefruit (Citrus paradisi MacFad.), pummelo (C. grandis L. Osbeck) and their hybrids; interspecific hybrids including kumquats, orangequats and citranges (Poncirus trifoliata); lemon (C. limonia L.), including other high acid species such as lime (C. aurantifolia), citron (C. medica) and sour oranges (C. aurantium and C. quarantium); mandarin (C. reticulata Blanco), both satsuma and clementine, along with hybrids with grapefruit (tangelos) and orange (tangors); and orange (C. sinensis L. Osbeck), which included examples of navel, common, pigmented and acidless cultivars.
shows the compositional ranges for each group, obtained by refractometry or titration . The distribution of values in the soluble solids, titratable acidity plane appears in .
Figure 1. Distribution of soluble solids and titratable acidity in the citrus juices (n = 326) used for chemometric modelling.
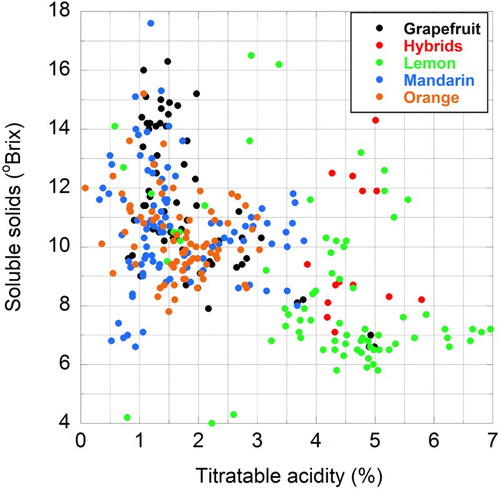
Table 1. Descriptive statistics (mean and range in parentheses) for soluble solids concentration (SSC) and titratable acidity (TA) classified by citrus class.
Because of the range of maturity within particular cultivars and the number of different species grouped together, the ranges presented here are not comparable with published compilations that tend to concentrate on mature fruit at harvest. In general though, the values are in line with what would be anticipated with the lemon and interspecific hybrid groups having high acidities and lower soluble solids, and the orange, mandarin and grapefruit groups being sweeter and less acidic (Kefford Citation1959; Dawes Citation1970). The limits of this study's SSC range were defined by ‘Eureka’ lemon (4.0 °Brix) and clementine mandarin (17.6 °Brix), with ‘Vainiglia Pink’ (an acidless orange [0.08%]) and ‘Etrog’ citron (6.96%) setting the boundaries on the acid measurements.
Optimisation of data collection conditions
The length of time taken to collect a spectrum depends on the number of acquisitions used for signal averaging, as well as the number of spectral points sampled (resolution) across the range, 4000–400 cm−1. Low scan numbers at decreased resolution reduce data collection time and smooth spectral appearance; higher acquisition numbers at increased resolution elevate data collection time, but lead to markedly improved definition of spectral features. At the extremes, a 16 scan–16 cm−1 resolution spectrum would take 8 s to acquire, while a 128 scan–4 cm−1 resolution spectrum would take 128 s to collect.
The set of parameters giving the best possible signal to noise ratio in the shortest possible acquisition time was evaluated by analysis of model results using synthetic standards. Taking SSC as an example (), it is clear that the best goodness-of-fit (R2) between predicted values and measured values occurred when the number of acquisitions was highest (128), irrespective of resolution. However, as resolution decreased from 4 to 16 cm−1, prediction errors increased two- to three-fold. Bias offsets also increased by a similar amount. A resolution of 4 cm−1 was therefore preferred. Spectra collected at 4 cm−1 had much more detail in the 1150–950 cm−1 region where vibrational modes associated with carbohydrates occur preferentially (data not shown). These were subsequently found to be essential for modelling.
Table 2. Effect of acquisition number and resolution on model statistics for the prediction of soluble solids concentration in synthetic citrus juice.
Determination of the optimum number of acquisitions was based on analysis of the TA and BRIMA model errors. For TA, the R2 for all acquisition numbers and resolutions was between 99% and 100%, RMSEP was between 0.03% and 0.06% TA, and bias offset between −0.02% and 0.05% TA. Any combination of these parameters would have worked well for determination of acidity. However, in the case of BRIMA, the greatest prediction errors and bias offsets were those associated with 16 acquisitions. Since it would be preferable to measure all three attributes simultaneously, by default, 4 cm−1 resolution and 32 acquisitions were accepted as the best compromise for collecting a detailed spectrum with reasonable errors in the shortest time possible (52 s)—i.e. a 20 s delay to allow the liquid to reach a constant temperature for analysis, followed by a 32 s data collection interval. These settings were subsequently used in all work involving citrus juice samples.
In terms of accuracy, the actual means for the 16 sample validation set determined by conventional methods were 12.8 °Brix, 2.60% TA and 29.4 BRIMA units. The mean prediction results from the preferred model were 12.6 ± 0.24 °Brix, 2.60% ± 0.05% TA and 28.3 ± 3.0 BRIMA units, respectively. The mean BRIMA value is low in comparison with values expected in orange and mandarin crops close to commercial clearance (>90 BRIMA units). This arose because a number of samples in the validation set had low SSC and high acidity, which led to negative values in the BRIMA calculation and a decrease in the overall mean.
Model building
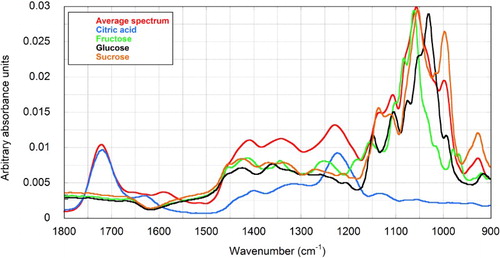
Juice spectra displayed recognisable features consistent with their major constituents (). Most notably, there were prominent peaks at 1720 and 1223 cm−1 from citric acid and a craggy array between 1150 and 950 cm−1 associated with aggregation of the strong absorbances from each of the sugars. The bands contain chemical information and are characteristic of specific vibrational modes in each molecule. For example, the absorbance at 1720 cm−1 is associated with stretching of the C=O bond in carboxylate groups, while 922 cm−1 is indicative of the α-anomeric linkage between glucose and fructose in sucrose. The region between 1153 and 904 cm−1 contains C-C and C-O stretching modes, while O-C-H, C-C-H and C-O-H bending vibrational modes are assigned to the region between 1474 and 1199 cm−1 (Irudayaraj & Tewari Citation2003). Because of the vibrational complexity of these molecules (Hineno Citation1977), individual peaks are not usually assigned to specific bonds. Accordingly, although peaks convey useful information about the chemical functionality of the sample, complete assignment of each one is unnecessary—and unimportant—in the modelling process. Nevertheless, they do act as a guide insofar as, when comparing models for acid analysis for example, there is an expectation that the best ones would utilise the acid peaks at 1720 and 1223 cm−1.
Figure 2. ATR-FTIR spectra of citrus juice (the average of all spectra in the calibration and validation sets) (red trace), and pure solutions of the major components in citrus juices; citric acid (15% w/w) (blue), glucose (black), fructose (green) and sucrose (orange), each at 20% (w/w) concentrations.
Excellent chemometric models were developed for the prediction of soluble solids, titratable acidity or the citrus industry maturity index in the juices analysed. Furthermore, each model was able to predict these attributes in every juice from each species analysed, without exception (). In the case of the citrus industry BRIMA model, it was found that the model was highly linear over the range −350 to 250 units. Typically, industry is most interested in assessing fruit in the 80–90 unit range for maturity clearance, or higher where differentiated proprietary lines are being marketed. What the model demonstrates, however, is that measurements of immature fruit containing low soluble solids, and/or high acid, are still able to be determined accurately by this approach.
Figure 3. Calibration and validation data from PLS regression models for the prediction of soluble solids (A), titratable acidity (B) and the citrus industry BRIMA standard (C) in citrus juices. RMSECV and RMSEP statistics are the standard errors associated with differences between predicted and actual measurements in the calibration and validation datasets, respectively. The black trace is a 1:1 line. The number of latent variables in the model associated with SSC, TA and the industry citrus standard index is seven, seven and five, respectively.
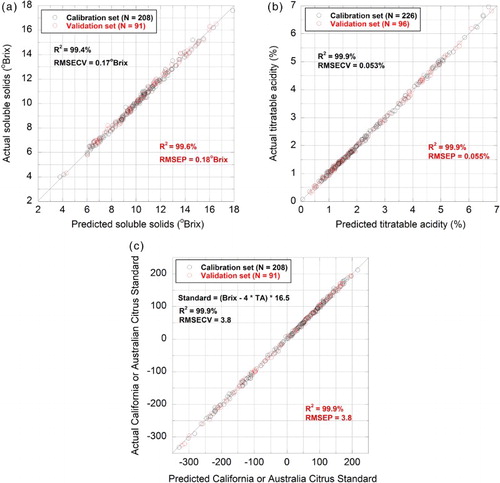
Apart from mean centring, straight-line subtraction or constant offset elimination were the only other pre-processing steps applied to spectral data to create optimised models. RMSEPs for each model were 0.18 °Brix, 0.055% TA and 3.8 units for the industry standard (). For comparison, the equivalent RMSEPs for determination of SSC in mandarin and orange by NIR ranged between 0.2 and 0.7 °Brix (Nicolai et al. Citation2007; Yuan et al. Citation2015); pH, not TA, is the most common acidity measurement reported in NIR studies of fruit quality. Goodness-of-fit statistics for the regression lines between predicted and actual measurements (R2) ranged between 99.0% and 99.9% ().
Table 3. PLS regression model descriptors for the analysis of soluble solids concentration (SSC), titratable acidity (TA) and the citrus industry BRIMA index by ATR-FTIR spectroscopy.
To put these values into perspective, the errors associated with measurement of duplicate aliquots of the same juice within the same run in a laboratory are 0.1 °Brix and 0.02% TA; laboratory errors are defined here as the standard deviation of differences between measurements of duplicate samples (Hruschka Citation2001). Ideally, as a rule of thumb, errors arising from PLS modelling should be about one and a half to three times larger than the corresponding laboratory error. This was observed here. Another term commonly used in the spectroscopic literature for assessing the quality of calibration models is the ratio of performance to deviation (RPD). This can be calculated as either the ratio of the standard deviation of the response variable divided by the RMSEP or the reciprocal of √(1 – R2) (in ). On that basis, each of the juice models has an RPD > 9, suggesting the models are ‘excellent’ (Hruschka Citation2001). In reality however, it is the citrus industry that will decide what level of error it can cope with as to how ‘good’ the models need to be in practice.
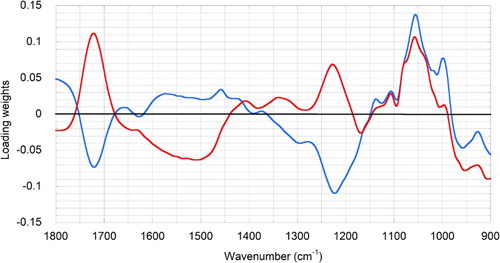
To determine which parts of the spectrum were most important for predicting measured values, PLS latent vector loading plots were examined for each model. The PLS latent vectors (also referred to as latent variables) show the relative importance of correlations between the measured component values and the spectral intensities of the calibration spectra. Using BRIMA as an example, the model for BRIMA prediction used the whole wavelength range between 1800 and 900 cm−1. Peaks with the highest positive correlations in latent vector 1 were those associated with acids (1720, 1223 cm−1) and sugars (1150–950 cm−1) (). Further improvements in this model were obtained by adding a second latent vector (vector 2) in which the influence of both the strong acid peaks was reduced, while maintaining strong correlations with peaks in the sugar region. Together these two latent vectors accounted for 99.7% of the variance in the BRIMA model. Similar patterns were observed for the SSC model where acid peaks were negatively correlated and sugar peaks strongly correlated with prediction of reference values, and vice versa in the TA model, where correlations with sugar peaks were negatively correlated but acid peaks were highly correlated with measurement predictions (data not shown).
Figure 4. PLS latent vector loading plots for vectors 1 (red) and 2 (blue) in the model for prediction of the industry BRIMA index in citrus juices.
Two further investigations were completed as part of this study. Statistics associated with chemometric analysis of a large number of navel orange samples are shown in , as well as those where synthetic standards prepared from binary solutions containing citric acid and sugars were used to predict the composition of the mixed juice sample set. Exceptionally good models for each of the attributes of interest were able to be obtained when synthetic samples were used for modelling. Relative to the mixed juice and navel orange models, R2 were the highest measured and the calibration errors were two to three times lower, when solutions were prepared from pure solids. Unfortunately, in this instance, the ability of synthetic standard solutions to predict the composition of real juice samples was flawed, leading to lower R2, inflated prediction errors and bias offsets not seen with the other two models. A more detailed comparison of the relative merits of these three models is outlined in the following section.
Discussion
The generic PLS regression models developed in this study for the prediction of SSC, TA and the common citrus industry maturity index have used citrus juices from a wide range of species. Although FTIR has been used to investigate the composition of a number of juices and beverages, as far as the author is aware this is the first attempt to determine an industry index by this technique, although Jamshidi et al. (Citation2012) have developed an NIR model for prediction of a BRIMA taste index in Valencia orange. While published reports of generic FTIR models such as these are uncommon, and thus of scientific interest, the results suggest approaches whereby alternative models with improved predictive statistics might be created.
For example, to account for the spectral variability in the juice matrix across multiple species, errors in generic models are likely to be higher than those where only juice from single species are analysed. This was confirmed through chemometric analysis of a large number of navel orange juices () where RMSEPs were 19%–51% lower than their counterparts in the respective generic models. This indicates that the citrus industry would be better served having models that were developed for particular species such as grapefruit, orange or mandarin, rather than having a ‘one model fits all’ approach. Whether prediction errors are acceptable in ‘species’ models that accommodate the variability inherent in juice from different cultivars, such as those that are clear or pigmented, remains untested.
Should simple external aqueous calibration standards be used to develop prediction models for citrus juice analysis? Excellent models for the measurement of SSC, TA and the industry maturity standard can be created, which have lower prediction errors than their respective models developed from juices (). This is not unexpected since all the additional components present in a juice matrix that act as spectral interferences have been eliminated. The approach of using synthetic samples to predict composition in ‘real’ samples has been shown to be successful with mango and beverages (Rambla et al. Citation1998; Duarte et al. Citation2002; Leopold et al. Citation2011). Here, however, applying a calibration model developed from citric acid and sugar solutions to the prediction of SSC and TA in fresh juices led to worse prediction errors and bias offsets than those associated with either of the two other models developed (). The evidence from this paper implies that the best predictive models arise when the same type of sample is used for both the calibration and validation sets. Cadet et al. (Citation1991) and Irudayaraj & Tewari (Citation2003) also reached similar conclusions in their analyses of sugar cane juice and fresh and processed apple juice when using aqueous solutions as calibration standards.
The generic models have not taken ‘acidity corrections’ for SSC into account (Kimball Citation1999). Our results suggest that successful models for high-acid fruit could be developed for determination of SSC where these corrections have been applied. The citrus maturity index, based on sensory evaluation of oranges (Obenland et al. Citation2009), is not applicable to high-acid species. However, the BRIMA concept is sufficiently flexible that high-acid standard indices based on sensory testing could be developed, where appropriate (Jordan et al. Citation2001).
How good is FTIR compared with current practice? Propagation of errors in calculation of the industry index using laboratory errors from the direct chemical methods means there is an automatic uncertainty in the BRIMA index of ±1.8 units, or 2 units after rounding. If the standard is calculated from the prediction errors for SSC (0.18 °Brix) and TA (0.055%) from their respective chemometric models, the uncertainty rises to ±3.4 units. The error for the index from the model where BRIMA is determined directly without calculation is ±3.8 units. This means the citrus industry index has an error of 2, 3 or 4 after rounding, depending on how it is calculated. Thus, any penalty incurred by adopting one approach over another is very small. If FTIR is used for determination of both SSC and TA then no further time or cost is borne by having the FTIR software determine the index value as well. Sampling statistics using these errors would need to be determined to ascertain the probability that bulk samples close to a 90 unit target value have only a small probability of failing to meet a maturity standard when picked.
While the main focus of this study has been to determine how well FTIR can predict the composition of citrus juices, industry often demands analysis in the shortest time possible. This is frequently at odds with good spectroscopic practice. The results here demonstrate that a good compromise between accuracy, precision and the time taken to collect the spectrum is 52 s per sample. This includes the 20 s delay time for the sample to come to temperature equilibrium on the ATR crystal. The delay time could be eliminated if samples were being run in batches and were able to be pre-warmed in a temperature-controlled block, and the spectrometer was held in a constant temperature environment. If juice volume was not a consideration then use of an auto-sampler becomes an option. However, unless an organisation is prepared to turn the analysis into an art form, for most purposes, manual analysis in less than 1 min per sample is advocated as a reasonable starting point.
The emphasis of this paper on addressing a perceived industry need has meant that other avenues of scientific merit have remained unexplored. There are a number of applications in which FTIR has been applied to the analysis of individual sugars and acids in juices and beverages, including Cadet et al. (Citation1991), Duarte et al. (Citation2002), Irudayaraj & Tewari (Citation2003), Beullens et al. (Citation2006), Bureau et al. (Citation2009), Leopold et al. (Citation2011) and Bureau et al. (Citation2012b). Successful global or species models for free acids and sugar should be able to be developed for citrus juices, as they have a relatively clean matrix. Although industry is less interested in knowing this level of detail for regulatory purposes, FTIR analysis for SSC, TA and the industry index could be readily extended to determination of the concentrations of these species in citrus juice as well, without any further cost to the industry beyond that of chemical characterisation of the samples used to construct the modelling sets. Apart from industry use, the availability of models for free acids and sugars by FTIR opens up the possibility for more detailed studies of changes in these components across wide-ranging citrus species during fruit development, and larger studies on the variability of fruit composition, both within trees, and across orchards. Given the importance of citrus worldwide, it is remarkable that comprehensive studies to produce such models have not already been carried out.
Acknowledgements
The author thanks colleagues who kindly provided the fruit samples used to develop initial predictive models; Annette Richardson, Plant & Food Research (PFR) Kerikeri, for access to PFR's citrus accession blocks; Ken Marsh, PFR Mt Albert, for use of the Mettler Toledo Autotitrator; Yanming Wang, Judith Rees and Richard Seelye (PFR) for assistance with the navel orange study; Sally Anderson and the New Zealand Citrus Growers Inc for permission to use their supermarket survey samples for research purposes; and, David Marston and Koman Tam, Bruker Optics, for ongoing technical support.
Disclosure statement
No potential conflict of interest was reported by the author.
References
- Bauer R, Nieuwoudt H, Florian F, Kossmann J, Koch KR, Esbensen KH. 2008. FTIR spectroscopy for grape and wine analysis. Anal Chem. 80:1371–1379. doi: 10.1021/ac086051c
- Beullens K, Kirsanov D, Irudayaraj J, Rudnitskaya A, Legin A, Nicolaï BM, Lammertyn J. 2006. The electronic tongue and ATR–FTIR for rapid detection of sugars and acids in tomatoes. Sensor Actuat B Chem. 116:107–115. doi: 10.1016/j.snb.2005.11.084
- Boyer C, Bregere B, Crouchet S, Gaudin K, Dubost JP. 2006. Direct determination of niflumic acid in a pharmaceutical gel by ATR/FTIR spectroscopy and PLS calibration. J Pharmaceut Biomed Anal. 40:433–437. doi: 10.1016/j.jpba.2005.07.018
- Boyd V. 2014. Australian adopts maturity standards akin to California [Internet]. The Packer. Available from: http://www.thepacker.com/fruit-vegetable-news/shipping-profiles/summer-citrus/Australia-adopts-maturity-standards-akin-to-California-262133551.html
- Bureau S, Boge M, Renard CMGC, Audergon JM 2012a. Infrared spectroscopy: a rapid tool for apricot characterisation. Acta Hortic. 966:249–254. doi: 10.17660/ActaHortic.2012.966.39
- Bureau S, Ruiz D, Reich M, Gouble B, Bertrand D, Audergon J-M, Renard CMGC. 2009. Application of ATR–FTIR for a rapid and simultaneous determination of sugars and organic acids in apricot fruit. Food Chem. 115:1133–1140. doi: 10.1016/j.foodchem.2008.12.100
- Bureau S, Scibisz I, Le Bourvellec C, Renard CMGC. 2012b. Effect of sample preparation on the measurement of sugars, organic acids and polyphenols in apple fruit by mid-infrared spectroscopy. J Agr Food Chem. 60:3551–3563. doi: 10.1021/jf204785w
- Cadet F, Bertrand D, Robert P, Maillot J, Dieudonne J, Rouch C. 1991. Quantitative determination of sugar cane sucrose by multidimensional statistical analysis of their mid-infrared attenuated total reflectance spectra. Appl Spectrosc. 45:166–172. doi: 10.1366/0003702914337470
- California Department of Food and Agriculture. 2012. Citrus. In: California code of regulations. Sacramento, CA: CDFA; Title 3. Food and agriculture; Division 3. Economics; Chapter 1. Fruit and vegetable standardization; Subchapter 4. Fresh fruits, nuts and vegetables; Article 22; Sections 1430.5–1430.6; 1430.35–1430.37.
- Camps C, Robic R, Bruneau M, Laurens F. 2010. Rapid determination of soluble solids content and acidity of Black Currant (Ribes nigrum L.) juice by mid-infrared spectroscopy performed in series. LWT—Food Sci Technol. 43:1164–1167. doi: 10.1016/j.lwt.2010.02.007
- Chace EM 1917. Maturity standard for Washington navel. California Citrograph. 2:7, 17.
- Cozzolino D, Cynkar WU, Shah H, Smith P 2011. Multivariate data analysis applied to spectroscopy: potential application to juice and fruit quality. Food Res Int. 44:1888–1896. doi: 10.1016/j.foodres.2011.01.041
- Dawes SN. 1970. Composition of New Zealand fruit juices. 2. Grapefruit, orange and tangelo juice. New Zeal J Sci. 13:452–459.
- de la Mata P, Dominguez-Vidal A, Manuel Bosque-Sendra J, Ruiz-Medina A, Cuadros-Rodríguez L, Ayora-Cañada MJ. 2012. Olive oil assessment in edible oil blends by means of ATR–FTIR and chemometrics. Food Control. 23:449–455. doi: 10.1016/j.foodcont.2011.08.013
- Dong X, Li Q, Sun D, Chen X, Yu X. 2015. Direct FTIR analysis of free fatty acids in edible oils using disposable polyethylene films. Food Analy Methods. 8:857–863. doi: 10.1007/s12161-014-9963-y
- Duarte IF, Barros A, Delgadillo I, Almeida C, Gil AM. 2002. Application of FTIR spectroscopy for the quantification of sugars in mango juice as a function of ripening. J Agr Food Chem. 50:3104–3111. doi: 10.1021/jf011575y
- Ferrao MF, Viera MS, Panta Panzos RE, Fachini D, Gerbase AE, Marder L. 2011. Simultaneous determination of quality parameters of biodiesel/diesel blends using HATR-FTIR spectra and PLS, iPLS or siPLS regressions. Fuel. 90:701–706. doi: 10.1016/j.fuel.2010.09.016
- Hineno M. 1977. Infrared spectra and normal vibrations of β–D–glucopyranose. Carbohyd Res. 56:219–227. doi: 10.1016/S0008-6215(00)83344-3
- Hruschka WR. 2001. Data analysis: wavelength selection methods. In: Williams P, Norris K, editor. Near–infrared technology in the agricultural and food industries. 2nd ed. St. Paul, Minnesota: American Association of Cereal Chemists; p. 39–58.
- Huang Y, Rasco BA, Cavinato AG. 2009. Fruit juices. In: Sun DW, editor. Infrared spectroscopy for food quality analysis and control. New York: Academic Press; p. 355–375.
- Irudayaraj J, Tewari J 2003. Simultaneous monitoring of organic acids and sugars in fresh and processed apple juice by Fourier transform infrared–attenuated total reflection spectroscopy. Appl Spectrosc. 57:1599–1604. doi: 10.1366/000370203322640242
- Jamshidi B, Minaei S, Mohajerani E, Ghassemian H. 2012. Reflectance Vis/NIR spectroscopy for nondestructive taste characterisation of Valencia oranges. Comput Electron Agr. 85:64–69. doi: 10.1016/j.compag.2012.03.008
- Jordan RB, Seelye RJ, McGlone VAM. 2001. A sensory-based alternative to brix/acid ratio. Food Technol. 55:36–44.
- Kefford JF. 1959. The chemical constituents of citrus fruits. Adv Food Res. 9:285–372. doi: 10.1016/S0065-2628(08)60278-5
- Kennedy BM, Schelstraete M. 1965. Ascorbic acid, acidity and sugar in Meyer lemons. J Food Sci. 30:77–79. doi: 10.1111/j.1365-2621.1965.tb00266.x
- Kimball DA. 1999. Citrus processing—a complete guide. 2nd ed. Gaithersburg, MD: Chapman & Hall, Aspen Publishers.
- Laurenson W. 2015. Navel orange grade standards. The Orchardist. September, 66.
- Leopold LF, Leopold N, Diehl HA, Socaciu C. 2011. Quantification of carbohydrates in fruit juices using FTIR spectroscopy and multivariate analysis. Spectrosc. 26:93–104. doi: 10.1155/2011/285890
- Nicolai BM, Beullens K, Bobelyn E, Peirs A, Saeys W, Theron KI, Lammertyn J. 2007. Nondestructive measurement of fruit and vegetable quality by means of NIR spectroscopy: a review. Postharvest Biol Tec. 46:99–118. doi: 10.1016/j.postharvbio.2007.06.024
- Obenland D, Collin S, Mackey B, Sievert J, Fjeld K, Arpaia ML. 2009. Determinants of flavor acceptability during the maturation of navel oranges. Postharvest Biol Technol. 52:156–163. doi: 10.1016/j.postharvbio.2009.01.005
- Obenland D, Sievert J, Arpaia ML. 2011. Evaluation of a rapid, portable and easy–to–use device to measure acidity in citrus. Citrograph. May/June: 41–43.
- Paradkar MM, Irudayaraj J. 2002. A rapid FTIR spectroscopic method for estimation of caffeine in soft drinks and total methylxanthines in tea and coffee. J Food Sci. 67:2507–2511. doi: 10.1111/j.1365-2621.2002.tb08767.x
- Rambla FJ, Garrigues S, Ferrer N, de la Guardia M. 1998. Simple partial least squares-attenuated total reflectance Fourier transform infrared spectrometric method for the determination of sugars in fruit juices and soft drinks using aqueous standards. Analyst. 123:277–281. doi: 10.1039/a704573e
- Rohman A, Man YBC, Yusof FM. 2014. The use of FTIR spectroscopy and chemometrics for the rapid authentication of extra virgin olive oil. J Am Oil Chem Soc. 91:207–213. doi: 10.1007/s11746-013-2370-5
- Shapaval V, Schmitt J, Moretro T, Suso HP, Skaar I, Åsli AW, Lillehaug D, Kohler A. 2013. Characterisation of food spoilage fungi by FTIR spectroscopy. J Appl Microbiol. 114:788–796. doi: 10.1111/jam.12092
- Song SY, Lee YK, Kim I-J. 2016. Sugar and acid content of Citrus prediction modelling using FTIR fingerprinting in combination with multivariate statistical analysis. Food Chem. 190:1027–1032. doi: 10.1016/j.foodchem.2015.06.068
- Yuan LM, Sun L, Cai JR, Lin H. 2015. A preliminary study on whether the soluble solid content and acidity of oranges predicted by near infrared spectroscopy meet the sensory degustation. J Food Proc E. 38:309–319. doi: 10.1111/jfpe.12104