
ABSTRACT
Conflicting reports of the responsiveness of carrots (Daucus carota L.) to nitrogen (N) fertiliser have been rationalised on the basis of the climatic zones in which the experiments were conducted. We tested this explanation with two experiments under temperate conditions, where yield increases were predicted to be unlikely, yet growers frequently apply N fertiliser. Our results show that in temperate regions carrot yields may indeed respond to N fertiliser when the yield potentials are c. 140 t ha−1 of fresh roots, if soil mineral N to 0.6 m depth and readily mineralisable N add to less than c. 190 kg N ha−1. With normal experimental precision, such responses may be undetected unless soil water deficit is kept small and variations in plant population are accounted for. Carrots have strong potential for luxury uptake of N. This has implications for marketing and the possible use of carrots as catch crops.
Introduction
There are conflicting accounts of the responses of carrot (Daucus carota L.) crop yields to fertiliser nitrogen (N). Much of the available information was summarised well by Westerveld et al. (Citation2006a, Citation2007), who divided the reports into two – those reporting positive responses, mainly from tropical or sub-tropical regions, and those from temperate regions where there was very little response. They suggested that the positive responses under the warmer conditions reflected greater rainfall and nitrate leaching in those experiments. The lack of response under temperate conditions was attributed to ample N supply arising from a combination of fast mineralisation of soil N, and a root system that under favourable conditions may penetrate to depths of 160 cm or more.
One must be cautious in interpreting the literature only in this way, however, as in most of the experiments reviewed by Westerveld et al. (Citation2006a, Citation2007), rooting depth, soil mineral N concentrations and N leaching losses were not measured or estimated. In at least one case where there was a positive response to N fertiliser under tropical conditions (Hochmuth et al. Citation1999) the soil was deep and sandy, so rooting depth was likely to be considerable and the reported weather conditions do not suggest an especially high risk of leaching losses below the root zone. In addition to the rooting pattern, soil mineral N concentrations and N leaching losses, there are other important factors to consider when evaluating previous reports of N fertiliser effects on carrot crops.
First, under some conditions, carrot yields may be influenced indirectly by N fertilisation practices, as N application is often effective at delaying canopy senescence and minimising canopy diseases (Westerveld et al. Citation2007).
Second, carrots are usually harvested to meet target root size criteria such as a mean root fresh mass. Final yield is determined by the product of plant population and mean root mass per plant. Under tropical or temperate conditions, crop growth rate might be slowed if N supply is sub-optimal, but the roots may still be able to reach their target size and yield much the same as optimally fertilised crops, only at a later date. In these circumstances, the apparent usefulness of N fertiliser applied earlier in the season will depend on whether there are pressures to adjust harvest dates to meet factory or marketing schedules, or to avoid crop quality, disease, and weather risks late in the season.
Third, crops with much the same potential yield in mass per unit area could differ in responsiveness to N fertiliser if they differ in plant population density. In densely planted crops, such as baby or table carrots, the individual plant mass may remain much smaller than in less densely planted crops grown for processing (Benjamin and Sutherland Citation1992; Reid and English Citation2000). The percentage of N in the plant dry matter that is critical for crop yield (Ncrit) declines noticeably with crop age, or more specifically, with increasing individual plant mass (Greenwood and Barnes Citation1978; Greenwood et al. Citation1980). In consequence the Ncrit may be substantially greater for densely planted crops, leading to greater responsiveness to N fertiliser applications even if total dry matter (biomass) yields end up similar to those with smaller populations. It is worth noting that in tropical or sub-tropical regions the carrot crops are mainly densely planted to produce table or baby carrots, but in temperate regions processing carrot crops are also grown and these are more sparsely planted.
Following on from this, one must be cautious in comparing responsiveness to N fertiliser of experimental crops that differed much in crop dry mass. Table or baby carrot crops may produce root yields of c. 2–10 t ha−1 of dry matter (Webster Citation1969; Hemphill and Jackson Citation1982; Gutezeit Citation1999; Hochmuth et al. Citation1999; Westerveld et al. Citation2006a), compared to c. 15–25 t ha−1 from processing carrot crops that have smaller populations but greater duration (Reid and English Citation2000; Reid and Gillespie Citation2017). Unfortunately, in the literature, changes in Ncrit for carrots are not well defined for plant dry masses greater than c. 38 g (Greenwood et al. Citation1980) but for process carrots individual plant dry masses may approach 100 g before they are considered acceptable for harvest. If the decline in Ncrit is slight once individual plant dry masses exceed 38 g, then total crop demand for N may continue to increase substantially in process carrot crops approaching their target root sizes. Under such circumstances, we might reasonably expect the growth rate to respond to N fertiliser, provided the supply of mineral N from the soil is not large. On the other hand, if the decline in Ncrit is considerable then such responses may be much less likely unless there is very little mineral N supplied by the soil.
There is a further reason to wonder whether yields of processing carrot crops may respond positively to N fertiliser applications under temperate conditions. Nitrogen uptake by these crops can be very large. Westerveld et al. (Citation2006b) measured total N uptake of up to 380 kg N ha−1 by a processing cultivar (‘Fontana’) that achieved a biomass of about 13 t ha−1. That crop was grown in an organic soil and received 60 kg N ha−1 as fertiliser. In a 2013–2014 survey of processing crops grown in sedimentary soils in Canterbury and Hawke’s Bay New Zealand, we measured total N content of 265–360 kg N ha−1 in five high-performing crops where dry biomass was 21–25 t ha−1 and fertiliser N applications were 22–72 kg N ha−1 (Johnstone, Hunt and Reid, unpublished data). We cannot be sure how much of that N content reflected luxury uptake. However, Chakwizira et al. (Citation2016) reported net uptake values of <330 kg N ha−1 for maize (Zea mays L.) grown in broadly similar environments. Maize is another deep-rooted species that produces dry matter yields similar to the 25–30 t ha−1 typical of process carrot crops in New Zealand, and in Chakwizira’s experiments its yield responded positively to N fertiliser applications of up to 200 kg N ha−1.
So, from a scientific viewpoint there is a reason to consider further Westerveld et al.’s (Citation2006a) proposal that under temperate conditions carrots require little fertiliser N to achieve optimal yield. There is some practical justification also. Under New Zealand conditions at least, most growers still apply fertiliser N to carrot crops. If less is needed, this would reduce growers’ costs and the risks of pollution via nitrate leaching to ground water. The aim of the experiments reported here was to explore the responsiveness to N fertiliser of process carrot crops grown under temperate conditions. An emphasis was placed on looking for responses at several times during the growing season, so there is a wide range of potential yields.
Materials and methods
Two experiments were conducted, the first during the summer of 2013–2014 (referred to as Expt 1314 hereafter), and the second during the summer of 2014–2015 (Expt 1415). Both were located at 39°36′S, 176°54′E, near Hastings, New Zealand. Expt 1314 was planted in an area that had previously been in 2 years of ryegrass pasture, followed by an oat crop that was cut and removed to reduce residual soil mineral N. Expt 1415 was planted in an area that had been in ryegrass pasture for the previous 3 years. Soil type at the site is a Mangateretere silt loam (Argillic Perch-Gley Pallic soil) with an available water capacity of about 180 mm to 1 m depth. Soil dry bulk density averaged 1.2, 1.3 and 1.47 g cm−3 for the 0–15, 15–30 and 30–60 cm depths, respectively.
In Expt 1314 carrots (D. carota L. ‘Carson’) were sown using a precision vacuum seeder on 11 November 2013. Plant spacing was 89 mm in eight rows on beds at 1.8 m spacing (bed tops were 1.5 m wide), aiming for a target density of 50 plants m−2. Expt 1415 was sown on 3 November 2014, using the same variety, method and bed arrangement but a within-row spacing was 85 mm aiming for a target density of 52 plants m−2. Plots were separated by a planted buffer area that was one bed wide, with a 1 m planted buffer at the end of each treatment plot. The crops in both experiments received herbicide, fungicide and insecticide applications to control weeds, disease and pests according to standard commercial practices. Nitrogen fertiliser was applied to the crop only as treatments to the specified plots. Individual plots were 15 m long × 1.8 m wide. For Expt 1314 only, agricultural lime was applied at 2 t ha−1 13 days before sowing and additional boron (B) and sulphur (S) was applied 5 weeks after sowing at rates of 1.5 and 45 kg ha−1, respectively. No other fertilisers were applied before or after sowing, reflecting the adequate background fertility.
Treatments and design
Primarily the experiments were designed to provide information on crop growth in response to the supply of N through the season, not to provide a small number of highly replicated harvests to give high precision measures of final yield. Nevertheless there was a facility to integrate information from successive harvests to gain insight on the likely agronomic performance of the different treatments.
There were five treatments in three replicate blocks for Expt 1314, and five treatments in four replicate blocks for Expt 1415. Within each replicate block there was a single plot of each treatment and the treatment locations were randomised. The treatments were the same in each experiment: five N fertiliser rates (0, 0.5, 1.0, 1.5 and 2.0 times a reference application rate). These treatments are referred to here as N0, N0.5, N1, N1.5 and N2, respectively.
In both years, the reference N rate (N1 treatment) was a total application of 90 kg N/ha. This rate is close to the mid-range found from a preliminary survey of process carrot growers in New Zealand (Johnstone, unpublished data, 2013). To minimise the risk of nitrate leaching, and reduce spatial and temporal variations in N availability, the N treatments were split equally across nine applications throughout the season. For Expt 1314, N fertiliser was applied at 25, 39, 57, 74, 86, 100, 115, 129 and 144 days after sowing (DAS). For Expt 1415, N fertiliser was applied at 47, 64, 79, 92, 106, 120, 140, 147 and 163 DAS. Treatments were applied as granular urea (46% N) broadcast on the surface, usually on the day following a biomass harvest. Irrigation from overhead sprinklers was applied during crop establishment, and after each fertiliser application to minimise the risk of volatilisation losses of ammonia. Individual applications varied from 5 to 30 mm, and experimental totals were 186 mm (Expt 1314) and 235 mm (Expt 1415).
Measurements
For Expts 1314 and 1415, respectively, we took samples for soil chemical characterisation 4 and 14 days before sowing. From each plot we took 15 core (2.5 cm diameter, 15 cm deep) samples of topsoil and bulked these for each replicate block before carrying out basic soil chemical analyses. The key measurements made were pH, Olsen P, cation exchange capacity and exchangeable cations (Cornforth and Sinclair Citation1984). For these samples we also measured the amount of N released by an anaerobic incubation for 7 days at 40°C (Keeney and Bremner Citation1966) to approximate the amount of N likely to be mineralised over the coming months. Sampling plans to measure mineral N in the soil differed between the two experiments. In both cases, in each plot a single 2.5 cm diameter core sample was taken from each of 0–30 cm and 30–60 cm depths. In Expt 1314, the cores from each depth were bulked for analysis at the replicate block level. In Expt 1415, the samples were not bulked, but were analysed for each plot individually. The core samples were extracted with 2 mol L−1 KCl solution and the concentrations of nitrate and ammonium were measured by ion chromatography. Total amounts of mineral N in the profile were calculated after correcting for soil dry bulk density.
For each observation date, we estimated total N supply to each plot by adding the amounts of fertiliser N applied to the measured mineral N in the soil to 60 cm depth around planting, and the readily mineralisable N to 15 cm depth.
Harvests for plant biomass were taken at two-week intervals from all plots starting from 24 to 170 DAS (Expt 1314) and from 44 to 203 DAS (Expt 1415). On each occasion the harvested area was 0.9 m2, representing a 0.5-m length of the bed, except that for the final measurements of Expt 1415 the sample area was doubled. On each harvest area we recorded the number of plants and then whole plants were weighed and divided into storage roots, green leaves and senesced leaves. Subsamples (approximately 0.3–1 kg fresh mass) were retained to determine the dry matter concentration of each component and leaf area. Dry masses were measured after oven drying for at least 7 days at 70°C. Harvest index was calculated as storage root dry yield divided by biomass (shoot plus storage root) dry yield. Leaf area was measured using a Licor-3100 leaf area meter (Licor, Lincoln, NE, USA). For Expt 1314, subsamples of green leaf and storage roots harvested at 156 DAS were dried, ground and analysed for their concentrations of N (by colorimetry following Kjeldahl digestion) and Ca, K, Mg, Na and S (by inductively coupled plasma emission spectroscopy). For Expt 1415, the same analyses were carried out on green leaf and storage root subsamples taken at 203 DAS.
Light interception by the crop canopy was measured prior to each biomass harvest using a Delta-T device (SunScan SS1 LAI meter, Delta-T Devices Ltd, Cambridge, UK). Measurements were taken above the canopy (ambient) and at four points below the crop canopy (intersecting the rows) within each plot. In some cases measurements were not possible because of unsuitable weather. For Expt 1314, light interception measurements ceased at 169 DAS; for Expt 1415 these measurements ceased at 206 DAS.
Daily rainfall, air temperature (minimum, maximum and mean) and solar radiation were measured within 150 m of the trial sites (NIWA Station No. 15876). The potential soil water deficit (Dø, mm) was computed using the model of Ritchie (Citation1972). This required values of leaf area index and potential evapotranspiration (calculated using the method of Priestley and Taylor (Citation1972)). The former were calculated for each day using polynomial equations fitted to the observations for the N1 treatment in each experiment. Any soil water in excess of field capacity was assumed to drain away within 24 h.
Analysis
Statistical analysis was carried out using R version 3.3.2 (31 October 2016).
Analysis of variance used linear models for main treatment effects with the replicate block as a covariate. For many analyses plant population (p, m−2) was also added as a covariate (see below), assuming no interaction with either main treatment or replicate block number. None of the data were transformed. Where there were multiple measures per plot these were averaged before the analysis of variance.
Carrot plant sizes and crop yields are usually strongly influenced by p (Benjamin Citation1993; Benjamin and Reader Citation1998; Reid and English Citation2000) which can vary greatly between and within experimental plots. Such variability may confound attempts to relate yield to fertiliser treatments. Here we examined the use of p as a covariate. This requires that the response of yield to p is linear within the observed range, and the validity of this assumption was checked during exploratory data analysis.
Generally, analysis of variance was carried out on the results from each measurement occasion separately. However, for some variables we also examined treatment differences averaged across all measurement occasions in each particular experiment. We did this by using DAS and DAS2 for each measurement occasion as additional covariates for the linear model (in effect fitting a quadratic covariate response of the variable in question to DAS). We used a covariate rather than repeated measures approach for this, because consecutive biomass measures on each plot were always destructive and carried out on plants from different areas. Furthermore, there was considerable variation in p within plots.
Least squares regression was also used to compare the effects on yield of p and Nsupply (that is the sum of the fertiliser N applied, the mineral N in the soil at planting and the readily mineralisable N, all in kg N ha−1). Both Nsupply and p varied within treatments and between measurement occasions on the same plot. In addition to examining simple relationships like y = a + bx, we also fitted coefficients for the model y = a + b1 x1 + b2 x2. These were carried out for each measurement occasion independently; we did not expand these models to include DAS explicitly.
Results
Weather
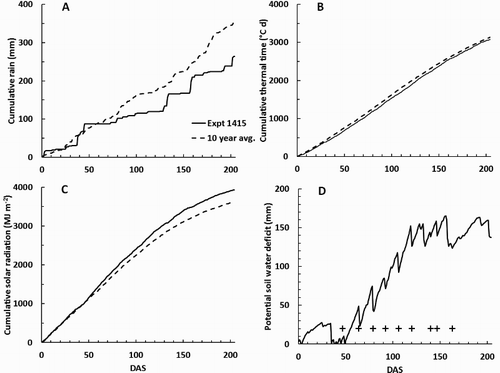
In Expt 1314, the weather was generally wetter than the average for the previous 10 years, although cumulative thermal time and solar radiation since sowing were close to the long-term average () . In Expt 1415, the weather was generally drier and with more sunshine than the average of the previous 10 years, but again cumulative thermal time differed little from the previous 10-year average (). Late in the season, Dø was generally less than during Expt 1314, largely reflecting more irrigation.
Figure 1. Weather observations at the site of Expt 1314 plotted against DAS carrots: A, cumulative rain; B, cumulative thermal time above a base of 0°C; C, cumulative solar radiation; and D, potential soil water deficit (Dø). In A–C, the solid lines indicate the observations for the 2013–2014 season and the pecked lines show the average for the previous 10 years. In B, the crosses indicate the days on which N fertiliser was applied.
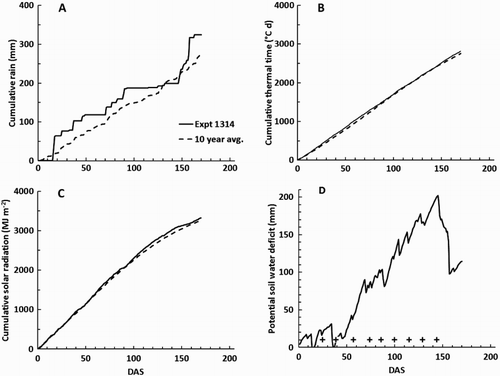
Figure 2. Weather observations at the site of Expt 1415 plotted against days after sowing carrots (DAS): A, cumulative rain; B, cumulative thermal time above a base of 0°C; C, cumulative solar radiation; and D, potential soil water deficit (Dø). In A–C, the solid lines indicate the observations for the 2014–2015 season and the pecked lines show the average for the previous 10 years. In D, the crosses indicate the days on which N fertiliser was applied.
Soil chemical measurements
Soil chemical properties prior to planting are summarised in . The amounts of mineralisable N in the top 15 cm soil differed little between the two experiments, but close to the time of planting the mineral N present down to 60 cm depth was about 39 kg N ha−1 greater in Expt 1415.
Table 1. Soil chemical properties at the experimental sites.
Plant populations
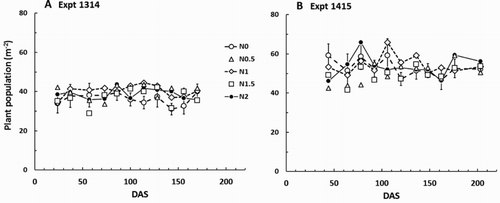
Plant population (p) varied considerably within and between plots. Across all sampling occasions in Expt 1314 p ranged from 19 to 53 m−2, with an average of 39 m−2 and a coefficient of variation of 17%. Similarly for Expt 1415, p ranged from 27 to 93 m−2, with an average of 52 m−2, and the coefficient of variation was 22%. During the period of destructive harvests there were no obvious time trends in p in either experiment (). The nitrogen fertiliser treatments did not significantly affect p in either experiment at any sampling date.
Figure 3. Carrot plant populations through the season for the 1314 and 1415 experiments. The control (N0) treatment means are shown ± the mean standard error (MSE) from the analysis of variance for that sampling occasion. For any individual occasion, the 95% confidence limit for comparisons between any two means is twice the MSE. Nitrogen fertiliser treatments are described in the text.
Plant population had important effects on biomass yield, shoot dry yield and root dry and fresh yields. These effects transcended any treatment effects, and the strength and slopes of the relationships varied between sampling times (). For Expt 1314 there were quite strong linear regressions of yield on p up to about 114 DAS. Thereafter, the R2 values of the regressions decreased with time and by the final harvest the slope term (b) was non-significant at P < 0.05. This is consistent with factors other than p limiting crop growth in the latter part of the season. However, for Expt 1415 there were significant linear relations between yield and p through to the final harvest at 203 DAS. Graphical analysis showed a linear response over the range of observed p for any sampling time. This supports the use of p as a linear covariate for the analysis of treatment effects on crop growth.
Table 2. Least squares regressions of biomass and storage root dry matter yields (t ha−1) on plant population (m−2) for carrots in the 1314 and 1415 experiments.
Effects of N treatments on plant mineral nutrition
For both experiments, there were no visible signs of nutrient deficiencies in any of the experimental treatments. The quantity of senesced leaves remained very small until shortly before the final harvests (see below). For both experiments, measured concentrations of Ca, K, Mg, Na, P and S in the shoots and storage roots were not within the ranges defined as deficient, marginal or deficient by Piggot (Citation1986).
In Expt 1314, compared with the control (N0) the N treatments substantially increased the uptake of N up to 156 DAS (). This was associated with increases in the N concentration in the storage roots, not in the leaves. There was a suggestion that leaf and root concentrations of Ca and S were greatest in the N0 treatment (results not shown), but this was probably a chance effect as it was not reflected in the net uptake of these nutrients, nor was it observed in Expt 1415.
Table 3. Effects of nitrogen (N) fertiliser treatments on N concentrations (% dry matter) in process carrots at 156 days after sowing (Expt 1314) and 203 days after sowing (Expt 1415).
In Expt 1415, by 203 DAS the N treatments had significantly and substantially increased uptake of N, but not any of the other nutrients measured (). The N treatments increased N concentrations in both the leaves and storage roots, but there was little effect on the concentrations of other nutrients. There was a suggestion that N fertiliser applications increased Mg and P concentrations in the storage roots (results not shown), but the apparent effects were small and may have been due to chance, as net uptake was unaffected.
In both experiments, there were positive effects of Nsupply on leaf N% and on storage root N% (). The strength of these relationships was greatest for the storage roots. Plots of net N uptake (Nup, kg N ha−1) vs. Nsupply clustered around the 1:1 line (). When data from both experiments were pooled and the regression was forced through the origin, we found:
Figure 4. Influence of nitrogen (N) supply on N concentration in green leaves (hollow symbols) and storage roots (solid symbols) of carrots: A, Expt 1314 at 156 days after sowing (DAS); and B, Expt 1145 at 203 DAS.
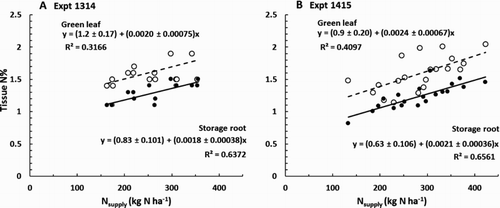
Figure 5. Influence on nitrogen supply (Nsupply) on the net uptake of N by carrot crops in Expt 1314 (at 156 days after sowing (DAS), hollow symbols), and Expt 1145 (at 203 DAS, solid symbols). The plotted line is that for uptake to equal supply.
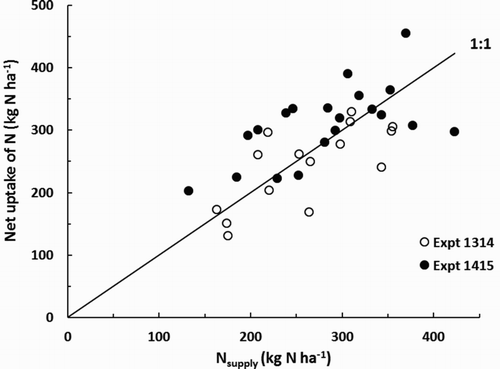
For Expt 1314, fitting the model Nup = a + b Nsupply yielded values of (63 ± 50), (0.7 ± 0.19) and 0.48 for a, b and R2, respectively (tolerances are standard errors). For Expt 1415, the equivalent values were (164 ± 45), (0.5 ± 0.15) and 0.35. Model performance was enhanced by including the effect of plant population. Fitting the model Nup = a + b1 Nsupply + b2 p yielded a = −(70 ± 67), b1 = (0.6 ± 0.16), b2 =(4 ± 1.6), R2 = 0.63 for Expt 1314. For Expt 1415 the values were a = (50 ± 59), b1 = (0.5 ± 0.13), b2 = (2.1 ± 0.83), R2 = 0.51.
Effects of N treatments on crop growth
In Expt 1314, when examined on the basis of individual sampling dates, the control (N0) treatment generally had the smallest green leaf area index (LG), green shoot yield, storage root yield and biomass yield (). These differences were significant (P < 0.05) only intermittently; twice for LG, and biomass yield, five times for green shoot dry yield, and only once for storage root dry yield. The N0 treatment generally intercepted the smallest fraction of incident light () but significant differences from the treatments that received N fertiliser occurred only at 85 and 169 DAS. In a commercial setting the most important index of crop performance is storage root fresh yield. This showed a reasonably consistent trend for the control (N0) treatment to yield least, although again there were no significant differences among the treatments that received N fertiliser (). The average increase in storage root fresh yield due to applying N fertiliser was about 25%. After pooling the results for all measurement occasions (), analyses of variance showed clearly that compared with the N0 treatment, applying N fertiliser significantly increased total leaf area index (LT), LG, green shoot dry yield, dead shoot dry yield, storage root dry yield, biomass yield and storage root fresh yield. For these same variables there was a suggestion that growth increased, and harvest index decreased, with N application rate up to about the N1.5 treatment. In the case of storage root fresh yield the average increase due to N fertiliser application was 17%. For the fraction of intercepted radiation, values for the N0 treatment were slightly, but significantly, smaller than those for the treatments that received N fertiliser. Leaf-specific area was unaffected by the experimental treatments.
Figure 6. Carrot crop growth through Expt 1314: A, Green leaf area index (LG); B, Green shoot dry yield; C, Storage root dry yield; and D, biomass yield. DAS = days after sowing. On each graph the crosses indicate times when nitrogen fertiliser was applied. Treatment means for the control (N0) treatment are plotted ± the mean standard error (MSE) from the analysis of variance for that day (using plant population and replicate block as covariates). The 95% confidence interval for separation between treatment means is approximately 2×MSE.
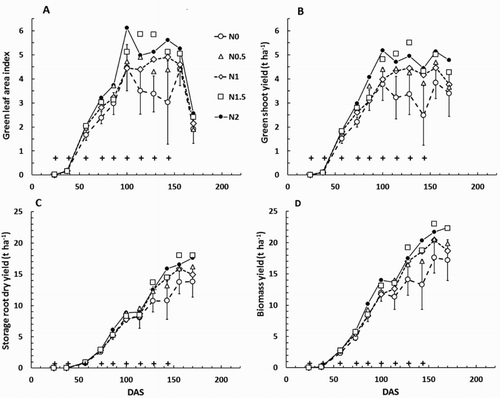
Table 4. Effects of nitrogen (N) fertiliser treatments on the fraction of incident light intercepted by carrot crops in Expt 1314 and Expt 1415.
Table 5. Analysis of variance for fresh storage root yields (t ha−1) of carrots in Expt 1314 and 1415.
Table 6. Analysis of variance for the effects of nitrogen (N) fertiliser treatments on growth and yield of carrots where data have been pooled for all observation dates.
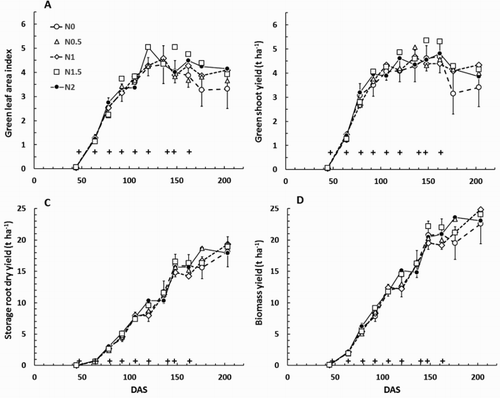
In Expt 1415, when examined on the basis of individual sampling dates, there were very few consistent, significant, differences among any of the treatments (, ). There was a suggestion that LG and green shoot yield decreased faster on the N0 treatments after about 170 DAS, but the LG values remained large enough that the fraction of light intercepted stayed close to 1 on all treatments (), and there was no sign of a corresponding decrease in storage root dry yield. There was a suggestion that storage root fresh yield was least on the N0 treatment at 176 DAS (), but the apparent effect was absent by the next measurement occasion and may have been simply a chance occurrence. On average, applying N fertiliser decreased storage root fresh yield by 1%. After pooling the results for all measurement occasions, analyses of variance indicated that N fertiliser applications affected shoot but not root growth; LG, LT and green shoot yield were significantly increased compared with values in the N0 treatment (). Even so the effect on shoot growth was insufficient to result in significant differences between the treatments in light interception or biomass yield.
Figure 7. Carrot crop growth through Expt 1415; A, Green leaf area index (LG); B, Green shoot dry yield; C, Storage root dry yield; and D, biomass yield. DAS = days after sowing. On each graph the crosses indicate times when nitrogen fertiliser was applied. Treatment means for the control (N0) treatment are plotted ± the mean standard error (MSE) from the analysis of variance for that day (using plant population and replicate block as covariates). The 95% confidence interval for separation between treatment means is approximately 2×MSE.
In both experiments, we noticed very little sign of canopy disease or pest pressure. The yield of dead leaves was generally small compared with total shoot yield, and there were no significant differences between treatments (). Most leaf senescence occurred during autumn, in the final 3 weeks of crop growth.
Relations between Nsupply and crop growth
In Expt 1314 there was a pattern of positive relationships between measures of crop growth and Nsupply and p. summarises these for biomass yield and storage root dry yield; very similar patterns were obtained for LT, LG, shoot dry yield and root fresh yield. The b2 coefficients (for the effects of p) were almost always significant at P < 0.05, whereas the b1 coefficients (for Nsupply) approached significance only after 128 DAS. Harvest index generally was unaffected by p but decreased with increasing Nsupply. This effect of Nsupply was significant (P < 0.05) at 73, 100, 114 and 128 DAS (results not shown).
Table 7. Least squares regressions of total dry matter (biomass) yield and storage root dry yield on nitrogen supply (Nsupply, kg ha−1) and plant population (p, m−2) for carrots in Expt 1314.
In Expt 1415 there were significant positive relationships between Nsupply and biomass yield and storage root dry yield at 92 and 120 DAS, but for the other measurement occasions such relationships were weak and non-significant (). A very similar pattern emerged for green shoot dry yield and root fresh yield (results not shown). For LT and LG, regression analyses indicated significant positive relationships with Nsupply at 120, 162, 176 and 203 DAS, but the b1 values were generally much smaller than those obtained for Expt 1314 (results not shown). Harvest index was generally unaffected by Nsupply and p; there was a suggestion that it was negatively affected by Nsupply at 176 DAS (P = 0.08) and 203 DAS (P = 0.04).
Table 8. Least squares regressions of total dry matter (biomass) yield and storage root dry yield on nitrogen supply (Nsupply, kg ha−1) and plant population (p, m−2) for carrots in Expt 1415.
Discussion
In both experiments, N fertiliser applications were very effective at increasing N uptake by the carrot crops. However, by the time of our late-season measurements, most of the increased N taken up was found in the storage roots, not in the leaves. There was no sign that leaf senescence was affected by N treatment in either experiment. Leaf area production was frequently increased by N fertiliser application in both experiments, but dry matter production and fresh root yield were improved significantly only in Expt 1314. These results indicate that N supply was a major limitation to crop growth only in Expt 1314.
We did not directly measure nitrate leaching in these experiments. Leaching of nitrate is most likely when the potential soil moisture deficit (Dø) is close to zero or falls substantially. In Expt 1314, these situations occurred only in the periods 0–37 and 157–170 DAS; only one of the nine fertiliser applications was made before 37 DAS, and although all the fertiliser had been applied before 157 DAS, crop growth had already greatly slowed by then. In Expt 1415 the only time when Dø was close to zero, or decreased substantially, was from 35 to 50 DAS, by which time only one of the nine fertiliser applications had been made. So in our experiments nitrate leaching is unlikely to have been a major factor influencing the response of our crops to fertiliser N application.
In Expt 1314 crop growth and yield were least in the N0 treatment, but in Expt 1415 there were very few increases in crop growth that could be attributed to the application of N fertiliser. Mineralisable N in the top 15 cm of soil did not differ significantly between the experiments, but compared with Expt 1314 the soil in Expt 1415 had on average 39 kg ha−1 more mineral N to 60 cm depth. It appears that these experimental sites straddled a critical range of soil N and water availability for process carrot crops grown in this temperate climate. Support for this possibility comes from comparisons of plant N concentrations with reported values in the literature.
First, the results of Sorensen (Citation1999) suggest carrot yield was reduced if the storage root concentration of N was less than c.0.1% on a fresh mass basis. Assuming the roots are 10% dry matter then this limiting value is c. 1% N in the root dry matter, close to the values found here for the N0 treatment. However, the yields reported by Sorensen et al. are rather small (23–50 t ha−1 of fresh roots) and other agronomic or environmental factors may limit the comparative value of those results here.
Second, Piggott (Citation1986) suggests a Ncrit of 1.5% and 0.8% for the youngest mature leaves and storage roots, respectively, of carrots ‘during peak harvest period’. A comparison with our results ( and ) suggests that the leaves on the N0 and perhaps N0.5 treatments may have contained less than the critical concentrations of N suggested by Piggott. As noted in the introduction, Ncrit declines with increasing plant mass and the masses appropriate for Piggott’s results were not presented.
Third, of Greenwood et al. (Citation1980) indicates Ncrit in both the leaves and storage roots is about 2% and falling gradually as the plant mass approaches the maximum recorded value of 38 g plant−1. Here, when samples were taken for plant nutrient concentrations the mean plant masses were a little larger at 40–52 g (Expt 1314) and 43–47 g (Expt 1415), but mean leaf and storage root concentrations of N were substantially less than 2% for all treatments ( and ). This implies that the plants on all treatments were seriously deficient in N, but the lack of response to N fertiliser in Expt 1415 in particular indicates that is not so. Greenwood et al. suggest typical 95% confidence limits for their graph would be 0.77–1.3 times each plotted value; it is possible that the confidence limits should be wider than this for plant masses at the extremes of the dataset. Greenwood et al. Citation1980 indicates Ncrit could be as small as 1.4% for a plant mass of 38 g. The value relevant to our experiments is probably slightly less because the plants were >38 g. Mean N concentrations in the plants of the N0 and N0.5 treatments were in the range 0.8–1.3, so again it seems likely that these treatments were close to or within the critical range of N supply for maximum yield under these conditions.
So our results suggest that when root yield potentials are in the vicinity of 15 t ha−1 of dry roots (c. 150 t ha−1 fresh), the yield of processing carrots is unlikely to respond to N fertiliser if Nsupply from the soil alone is greater than about 190 kg N ha−1. Better refinement of this ‘limiting’ value is advised, particularly because our estimates of Nsupply did not include an allowance for N mineralisation from depths >15 cm and mineral N in the soil at depths >60 cm.
It is also rather likely that our results may underestimate the responsiveness to N fertiliser of carrot crops grown in similar situations. Carrots are very sensitive to water deficits and it seems likely that water shortage suppressed the growth and responsiveness of the crops during both experiments. Reid and Gillespie (Citation2017) found that final storage root yield of the cultivar ‘Chantenay Red Core’ decreased linearly by about 0.22% for every mm that the maximum potential water deficit (Dømax) increased beyond about 75 mm (or about 39% of the soil’s available water capacity to 100 cm depth). That would correspond approximately to a value of 71 mm in these experiments. Here Dømax was 202 mm for Expt 1314 and 165 mm for Expt 1415, suggesting that water stress could have reduced final yields by 29% and 21%, respectively. It is difficult to compare % yield reductions between the three experiments directly, because crop durations differed. However, some further support comes from comparing the yields at final harvest for these experiments and those predicted using the potential yield model of Reid and English (Citation2000) (calibrated for a similar cultivar, ‘Chantenay Red Core’). The average measured yields for the treatments that received N fertiliser at 170 DAS were 31% below potential for Expt 1314. At 203 DAS the same treatments yielded 41% less than potential in Expt 1415. We might reasonably expect that water shortage would have limited the responsiveness of the crops to fertiliser N applications in our experiments.
Despite these complications, our results add useful extra information that can help to refine previous attempts to explain carrot crop responsiveness to N fertiliser mainly on the basis of factors associated with climate (Westerveld et al. Citation2006a; Westerveld et al. Citation2007). In particular, our results indicate that carrot crop yields may respond markedly to N fertiliser in temperate regions where the supply of N from the soil is already reasonably large and substantial leaching losses are not likely. However, within the precision of most field experiments the responses may be readily missed unless the account is made of variations in p and soil water deficits are kept small.
The confounding effect of p in the analysis of fertiliser response experiments will depend on sample size. Unless the sampling area is large, it is crucial that data analysis includes an allowance for the variability in p. Here we were able to do this using p as a covariate in analyses of variance, an approach that appears to have been little used in previous papers examining carrot yield responses to N fertiliser, even when the sampling areas were <3 m2 (Hipp Citation1978; Westerveld et al. Citation2004; Westerveld et al. Citation2006a; Caron et al. Citation2014).
There was a little detectable effect of the N treatments themselves on harvest index in Expt 1415, supporting the results of Prabhakar et al. (Citation1991). However, in Expt 1314, where the crop yield was more responsive to N fertiliser applications, these applications appeared to decrease harvest index. In both experiments there were indications that harvest index decreased as Nsupply increased. If confirmed, this effect of N has implications for our understanding of dry matter partitioning in carrots and other root crops, and so deserves further investigation.
It is important to note that Nup by these crops was large; calculated values for individual plots ranged from 131 to 468 kg N ha−1, with an average of 237 kg N ha−1 for Expt 1314 (at 156 DAS) and 321 kg N ha−1 for Expt 1415 (at 203 DAS). These are towards the top end of values reported by Chen et al. (Citation2004) and Westerveld et al. (Citation2006b) for carrots grown, respectively, in the North China Plain and Ontario, Canada. For our experiments, plots of Nup against estimates of Nsupply clustered around the 1:1 line. The accuracy of our estimates of Nsupply is unknown, especially because we did not measure readily mineralisable N below 15 cm depth, and the applicability of the mineralisation test itself was not independently checked. Where subsoil compaction or water tables are not limiting, rooting depth of carrots may be greater than 100 cm (Thorup-Kristensen Citation2006; Westerveld et al. Citation2007), so by measuring soil mineral N down to only 60 cm we may have underestimated Nsupply. However, for a soil with a similarly compact subsoil to that used here there was clear evidence of carrot root activity only to about 70 depth (Reid and Gillespie Citation2017) so our estimates of the initial amount of soil mineral N available to the crops may not be seriously in error. Overall, it is likely that the carrot root systems were quite efficient at taking up mineral N. Given the low responsiveness of yield to N fertiliser Expt 1415, it appears there was a considerable amount of luxury uptake of N in most of the treatments applied there. It is hard to reconcile our results with the conclusion of Westerveld et al. (Citation2006b) that carrots recover little of the N that is applied during the current growing season. However, we firmly concur with their suggestion that carrots have potential to be used as an N catch crop that could improve the N use efficiency of crop rotations.
Luxury accumulation of N in carrot roots as observed here may have implications for crop value. If much of the excess N is present in nitrate form, this may render the product less marketable where there are marketing or regulatory limits on the allowable nitrate concentration (Santamaria Citation2006). Previous work by Smoleń and Sady (Citation2009) and Gutezeit (Citation1999) showed some increase in nitrate concentration with nitrogen supply. However, nitrate concentrations were not measured in our work, and further investigation is required to elucidate the impact of luxury N uptake on root nitrate content.
Conclusions
Contrary to published expectation, but in line with grower practices, carrot crop yields may respond positively to N fertiliser in temperate climates. The likelihood of such a response will depend on crop age at harvest, plant population, the background supply of N from the soil and water stress experienced by the crops. The chances of detecting such responses in field experiments are increased if variability in plant populations is minimised or accounted for in the analyses techniques used.
Robust, reliable, recommendations for optimum N fertiliser rates for carrot crops need to be made using a system that integrates multiple influences, in particular, the ability of the soil to supply N, water and other nutrients, weather conditions, the achieved plant population, the target root sizes, and scheduling and quality constraints imposed by market requirements. There is still insufficient information published to build such a system.
Acknowledgements
The authors would like acknowledge Isabelle Sorensen, Christina Finlayson, Nathan Arnold and the late Brian Rogers for technical assistance, and to the late Colin Katz for stimulating concern about N applications.
Disclosure statement
No potential conflict of interest was reported by the authors.
ORCID
Jeff B. Reid http://orcid.org/0000-0002-3269-7151
Adrian G. Hunt http://orcid.org/0000-0003-0905-1181
Linley K. Jesson http://orcid.org/0000-0003-4969-160X
Additional information
Funding
References
- Benjamin LR. 1993. Experimental discrimination between contrasting models of neighbourhood competition. Journal of Ecology. 81(3):417–423. doi: 10.2307/2261520
- Benjamin LR, Reader RJ. 1998. A dynamic model for simulating edge effects in carrot crops. The Journal of Horticultural Science and Biotechnology. 73(6):737–742. doi: 10.1080/14620316.1998.11511041
- Benjamin LR, Sutherland RA. 1992. Control of mean root weight in carrots (Daucus carota) by varying within- and between-row spacing. The Journal of Agricultural Science. 119(1):59–70. doi: 10.1017/S0021859600071549
- Caron J, Rancourt GT, Bélec C, Tremblay N, Parent L-É. 2014. Nitrogen budget for fertilized carrot cropping systems in a Quebec organic soil. Canadian Journal of Soil Science. 94(2):139–148. doi: 10.4141/cjss2013-104
- Chakwizira E, Teixeira E, de Ruiter J, Maley S, George M. 2016. Harvest index for biomass and nitrogen in maize crops limited by nitrogen and water. 2016 International Nitrogen Initiative Conference, “Solutions to improve nitrogen use efficiency for the world”, Melbourne, Australia.
- Chen Q, Li X, Horlacher D, Liebig H-P. 2004. Effects of different nitrogen rates on open-field vegetable growth and nitrogen utilization in the North China plain. Communications in Soil Science and Plant Analysis. 35(11–12):1725–1740. doi: 10.1081/CSS-120038565
- Cornforth IS, Sinclair TR. 1984. Fertilizer recommendations for pastures and crops in New Zealand. Wellington: New Zealand Ministry of Agriculture and Fisheries; p. 76.
- Greenwood DJ, Barnes A. 1978. A theoretical model for the decline in the protein content in plants during growth. Journal of Agricultural Science Cambridge. 91:461–466. doi: 10.1017/S0021859600046566
- Greenwood DJ, Barnes A, Liu K, Hunt J, Cleaver TJ, Loquens SMH. 1980. Relationships between the critical concentrations of nitrogen, phosphorus and potassium in 17 different vegetable crops and duration of growth. Journal of the Science of Food and Agriculture. 31:1343–1353. doi: 10.1002/jsfa.2740311219
- Gutezeit B. 1999. Yield and nitrate content of carrots (Daucus carota L.) as affected by nitrogen supply. Acta Horticulturae. 506:87–92. doi: 10.17660/ActaHortic.1999.506.10
- Hemphill DD, Jackson TL. 1982. Effect of soil acidity and nitrogen on yield and elemental concentration of bush bean, carrot and lettuce. Journal of American Society of Horticultural Science. 107(5):740–744.
- Hipp B. 1978. Response by carrots of nitrogen and assessment of nitrogen status by plant analysis. HortScience. 13:43–44.
- Hochmuth GJ, Brecht JK, Bassett MJ. 1999. Nitrogen fertilization to maximize carrot yield and quality on a sandy soil. HortScience. 34:641–645.
- Keeney DR, Bremner JM. 1966. Comparison and evaluation of laboratory methods of obtaining an index of soil nitrogen availability. Agronomy Journal. 58:498–503. doi: 10.2134/agronj1966.00021962005800050013x
- Piggott TJ. 1986. Vegetable crops. In: Reuter DJ, Robinson JB, editors. Plant analysis: an interpretation manual. Melbourne: Inkata Press. p. 148–187.
- Prabhakar M, Srinivas K, Hegde DM. 1991. Effect of irrigation regimes and nitrogen fertilization on growth, yield, N uptake, and water use of carrot (Daucus carota L.). Gartenbauwissenschaft. 56:206–209.
- Priestley CHB, Taylor RJ. 1972. On the assessment of surface heat flux and evaporation using large-scale parameters. Monthly Weather Review. 100(2):81–92. doi: 10.1175/1520-0493(1972)100<0081:OTAOSH>2.3.CO;2
- Reid JB, English JM. 2000. Potential yield in carrots (Daucus carota L.): theory, test, and an application. Annals of Botany. 85:593–605. doi: 10.1006/anbo.2000.1108
- Reid JB, Gillespie RN. 2017. Yield and quality responses of carrots (Daucus carota L.) to water deficits. New Zealand Journal of Crop and Horticultural Science. 45(4):299–312. doi: 10.1080/01140671.2017.1343739
- Ritchie JT. 1972. Model for predicting evaporation from a row crop with incomplete cover. Water Resources Research. 8(5):1204–1213. doi: 10.1029/WR008i005p01204
- Santamaria P. 2006. Nitrate in vegetables: toxicity, content, intake and EC regulation. Journal of the Science of Food and Agriculture. 86(1):10–17. doi: 10.1002/jsfa.2351
- Smoleń S, Sady W. 2009. The effect of various nitrogen fertilization and foliar nutrition regimes on the concentrations of nitrates, ammonium ions, dry matter and N-total in carrot (Daucus carota L.) roots. Scientia Horticulturae. 119(3):219–231. doi: 10.1016/j.scienta.2008.07.030
- Sorensen J. 1999. Nitrogen effects on vegetable crop production and chemical composition. Acta Horticulturae (ISHS). 506:41–50.
- Thorup-Kristensen K. 2006. Root growth and nitrogen uptake of carrot, early cabbage, onion and lettuce following a range of green manures. Soil Use and Management. 22(1):29–38. doi: 10.1111/j.1475-2743.2005.00012.x
- Webster AB. 1969. Manuring and spacing experiments on vegetables. New Zealand Journal of Agricultural Research. 12:381–416. doi: 10.1080/00288233.1969.10421189
- Westerveld SM, McKeown AW, McDonald MR. 2004. Effect of nitrogen rate and residual soil nitrogen on yield and quality of carrots. HortScience. 39(4):795–795.
- Westerveld SM, McDonald MR, McKeown AW. 2006a. Carrot yield, quality, and storability in relation to preplant and residual nitrogen on mineral and organic soils. HortTechnology. 16(2):286–293.
- Westerveld SM, McKeown AW, McDonald MR. 2006b. Seasonal nitrogen partitioning and nitrogen uptake of carrots as affected by nitrogen application in a mineral and an organic soil. HortScience. 41(5):1332–1338.
- Westerveld SM, McDonald MR, McKeown AW. 2007. Nitrogen utilization timeline of carrot over the growing season. Canadian Journal of Plant Science. 87(3):587–592. doi: 10.4141/P06-159