
Abstract
Background
Concerns exist about the role of selection in the lack of diversity in health professions education (HPE). In The Netherlands, the gradual transition from weighted lottery to selection allowed for investigating the variables associated with HPE admission, and whether the representativeness of HPE students has changed.
Method
We designed a retrospective multi-cohort study using Statistics Netherlands microdata of all 16-year-olds on 1 October 2008, 2012, and 2015 (age cohorts, N > 600,000) and investigated whether they were eligible students for HPE programs (n > 62,000), had applied (n > 14,000), and were HPE students at age 19 (n > 7500). We used multivariable logistic regression to investigate which background variables were associated with becoming an HPE student.
Results
HPE students with ≥1 healthcare professional (HP) parent, ≥1 top-10% income/wealth parent, and women are overrepresented compared to all age cohorts. During hybrid lottery/selection (cohort-2008), applicants with ≥1 top-10% wealth parent and women had higher odds of admission. During 100% selection (cohort-2015) this remained the case. Additionally, applicants with ≥1 HP parent had higher odds, those with a migration background had lower odds.
Conclusions
Odds of admission are increasingly influenced by applicants’ backgrounds. Targeted recruitment and equitable admissions procedures are required to increase matriculation of underrepresented students.
Introduction
Diversity amongst health professions education (HPE) students and healthcare professionals is of fundamental importance for promoting excellence in health education and care (Marrast et al. Citation2014; Saha Citation2014). Diversity prepares HPE students for their role as care providers in a diverse society (Steven et al. Citation2016; Clayborne et al. Citation2021). It results in an improved educational experience for all students (Grafton-Clarke Citation2016; Alexander et al. Citation2017; Clayborne et al. Citation2021), contributes to their cognitive and affective development (Clayborne et al. Citation2021), and has positive effects on students’ attitudes regarding diversity-related issues (Steven et al. Citation2016). A diverse workforce in the health professions is linked to improved patient satisfaction (Clayborne et al. Citation2021), better communication and understanding between care provider and patient (Grafton-Clarke Citation2016; Parker et al. Citation2017; Clayborne et al. Citation2021) and improved culturally-sensitive care (Parker et al. Citation2017; Clayborne et al. Citation2021). It is also associated with a strengthened research agenda into diseases which primarily affect minority groups (Cohen et al. Citation2002), improved access to healthcare for underserved communities (Marrast et al. Citation2014; Clayborne et al. Citation2021), and the promotion of health equity (Marrast et al. Citation2014; Parker et al. Citation2017). Diversity amongst HPE students is therefore of great importance for society. However, the cohorts trained to become health professionals are often not representative of the populations they serve (Bowes et al. Citation2013; Alexander and Cleland Citation2018; Van den Broek et al. Citation2018). In many countries, they often belong to the ethnic majority, and often have highly educated and high-income parents who are more likely to work in the medical field (Puddey et al. Citation2011; Ferguson et al. Citation2012). When compared to the general university student population, the medical student population is also disproportionally from higher socio-economic status (SES) backgrounds (Van den Broek et al. Citation2018).
Practice points
In the transition from lottery-based to selection-based admission into Dutch health professions education (HPE) programs, applicants’ background characteristics increasingly played a significant role in their odds of admission.
Although selection is associated with increased inequality of opportunity in admission, returning to lottery-based admission is not a solution to achieve a representative HPE student population, due to a lack of diversity in the applicant pool.
In the long term, sustainable efforts to eliminate educational inequalities at early ages are required to achieve a representative applicant pool.
In the short term, improved recruitment efforts of underrepresented student populations and equitable selection procedures are required to improve the representativeness of HPE student populations.
Evidence suggests that opportunities to enrol in HPE programs are not equally available to all eligible students, due to self-selection and/or bias in the admissions procedures (Sianou-Kyrgiou and Tsiplakides Citation2011; Kelly et al. Citation2014; Simmenroth-Nayda and Görlich Citation2015; Wouters et al. Citation2018). Self-selection refers to students making a decision to apply or not based on how they estimate their chance of success in light of actual and perceived barriers and facilitators. Those from a lower SES background may face numerous barriers to apply (Steven et al. Citation2016; Niven et al. Citation2019), such as the perception that they will have lower chances of being selected (Greenhalgh et al. Citation2004; Southgate et al. Citation2015; Ball et al. Citation2020; Wouters Citation2020), fear of not fitting in because of their background (Greenhalgh et al. Citation2004; Mathers and Parry Citation2009; Martin et al. Citation2018), financial barriers (Cleland et al. Citation2015), or active discouragement by high school teachers (McHarg et al. Citation2007). Students who lack a network in the medical field may face barriers in developing the confidence that the HPE programme is the right study choice, in getting relevant work experience, or preparing for the medical school application process (Southgate et al. Citation2015; Hadinger Citation2017; Bassett et al. Citation2019; Ball et al. Citation2020). They can also become demotivated by the inequality they perceive (Wouters et al. Citation2017). Ethnic minority students may face inadequate institutional support and resources, limited personal resources, lack of access to adequate information, mentoring, and advising, and different societal barriers (Freeman et al. Citation2016). Selection procedures may also be biased unintentionally against certain groups of applicants (Kelly et al. Citation2014; Steven et al. Citation2016; Niven et al. Citation2019). For example, men tend to underperform on certain selection instruments (Schripsema et al. Citation2017). Universities across the world therefore take different measures to attempt to address these inequities and promote social accountability, for example by using Widening Participation programs and/or Widening Access policies (Powis et al. Citation2007; Cleland et al. Citation2015; Alexander et al. Citation2017; Martin et al. Citation2018), quota systems (Becak and Cirino Citation2018; Curtis Citation2018), and using selection tools which are known to not disadvantage underrepresented students (Jerant et al. Citation2015; Razack et al. Citation2015; Taylor et al. Citation2015).
There is academic debate about whether a lottery system could also be an instrument to reduce the possible inequality of opportunity in admission procedures (Hubbeling Citation2018; Mazer Citation2021; ten Cate Citation2021). Theoretically, in a random lottery, the background characteristics of applicants would have no influence on the outcome of admissions. However, solid large-scale quantitative evidence about which admission procedure would produce the most equitable outcome for society (i.e. an HPE professional workforce which reflects the diversity in the general population) is limited, because in most countries, there is no possibility to compare the two procedures.
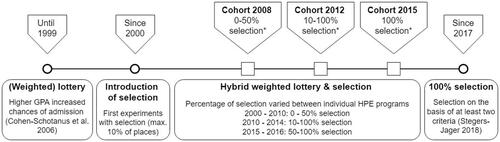
The case of The Netherlands offers a unique opportunity to investigate this matter and compare the level of HPE student diversity and possible unequal opportunities in admissions under two different admissions systems. The country used to have a lottery admission system weighted for previous academic performance (Cohen-Schotanus et al. Citation2006), but due to a perceived lack of fairness and lack of control of who gains admission (Wouters et al. Citation2018), the government decided on a gradual transition in the direction of selection from 2000 onwards. Since 2017, 100% of HPE students are admitted through selection (). Selection procedures are designed by universities themselves, and make use of at least two criteria, such as previous academic achievement, aptitude, or extracurricular activities (Stegers-Jager Citation2018).
Figure 1. Timeline of transition from lottery to selection. *Admissions situation at the time this cohort likely applies to an HPE programme.
In The Netherlands, the typical educational route to become an HPE student consists of several steps. In the transition from elementary to high school, pupils are placed in either the vocational (4 years), higher general (5 years), or pre-university (6 years) track around ages 11–12. If pre-university pupils follow the science-focused track (Nature and Health and/or Nature and Technology) with four science-focused subjects (Biology, Physics, Chemistry, and Mathematics) they are eligible to apply to HPE programs in their final year. Applicants with other educational backgrounds must prove that they meet equivalent educational levels (Wouters et al. Citation2018). Once students apply, they need to compete for the limited places available in the HPE programme. In each of these steps on the route to an HPE programme, diversity may be lost, which could result in underrepresentation in HPE. However, it is unknown to what extent this is the case, and which aspects of diversity are affected at different stages on this route. Therefore, this study aimed to answer the following questions: 1) Which demographic background variables are associated with an applicant’s odds of admission into HPE? 2) Has the representativeness of HPE student populations changed during the gradual transition in admissions procedures from hybrid lottery and selection to 100% selection, compared to: a) their age peers; b) the eligible student pool; and c) the applicant pool?
Our goal was to investigate which background variables influenced applicants’ odds of admission under different admissions situations, with different proportions of selection-based admission, which occurred during the transition from weighted lottery to selection.
Methods
Study design
We did a retrospective multi-cohort study using anonymised non-public microdata from Statistics Netherlands of all 16-year-olds who were registered in The Netherlands on 1 October 2008, 2012, and 2015, hereafter referred to as ‘age cohorts’. Within these age cohorts, we defined those with a science-focused pre-university education profile as the ‘eligible student pool’. Using anonymised data from Studielink – the Dutch organization where students submit their application for a study programme – we defined those who had applied to Medicine, Pharmacy, Clinical Technology or Dentistry as the ‘applicant pool’. Eligibility to apply to the 4 HPE programs in this study is not determined by high school GPA, score in a medical admissions test, or similar form of prior attainment. However, an applicant may fail their final high school exams and thus be unable to enrol in higher education that year. We have therefore performed our analyses on the applicants who, according to Statistics Netherlands microdata, had passed their high school exams and thus, in theory, were eligible for placement. Applicants who failed their high school exam in the year in which they applied, were excluded from our logistic regression analyses. Finally, out of these applicants who were eligible for placement, those who were registered as Medicine, Pharmacy, Clinical Technology or Dentistry students at a Dutch university three years later (in 2011, 2015, or 2018), at the age of 19 were termed ‘HPE students’.
Sample
All children, registered as living in The Netherlands, who were 16 years old on 1 October 2008, 2012, and 2015 were included. October 1st was chosen because this is the reference date at which student enrolment at each level of education is registered. At age 16, the majority of Dutch youth is still in high school. The average age of first-year bachelor students between 2008 and 2018 was 18.6 years old (Leijen et al. Citation2019). This means that the majority of university students in The Netherlands, including HPE students, enter university at age 17, 18, or 19. Therefore, in our research design, we had the highest likelihood that eligible students in the cohorts were still in high school, and that three years later, at age 19, they would have left high school and entered tertiary education. We selected the years of the three cohorts based on the availability of essential variables in Statistics Netherlands microdata, and the admissions context () at the time students entered higher education.
Variables
Variables in the study are described in . As proxy for SES, we used parental income percentiles, wealth percentiles, and social welfare recipient status. Income and wealth percentiles, rather than their values in euros, were included because percentiles indicate the relative position one occupies compared to the rest of the population. Statistics Netherlands-defined ethnic groups other than Dutch (without a migration background) are hereafter referred to as having either a Turkish, Moroccan, Surinamese, or Dutch Caribbean migration background (TMSD); or other migration background (OMB).
Table 1. Data recorded for each student.
Statistical analysis
We first performed univariable logistic regression analyses to examine which of the independent variables described in were associated with becoming an HPE student. Statistical level of significance was set at .05. We examined data for evidence of multicollinearity amongst the independent variables. Second, we used multivariable logistic regressions and applied stepwise forward selection to build a model for each cohort year (2008, 2012, and 2015). This resulted in three models in total. We also examined whether adding interaction terms (any possible combination) improved these models.
To determine the representativeness of HPE student populations throughout the transition from a hybrid weighted lottery and selection procedure to a 100% selection procedure, we used frequency tables to compare the distribution of students in each cohort and each reference group on all variables. To investigate the changes in proportions between cohorts, we used two different types of logistic regression analyses, where age cohort 2008 was used as a reference category. For binary variables such as gender, we used binary logistic regression analysis; for variables with more than two categories, such as migration background, we used multinomial logistic regression analysis. All analyses were performed using IBM SPSS software for Windows version 25.0 (IBM Corp, Armonk, NY).
Ethical considerations
The Ethics Committee at Amsterdam UMC, location VUmc declared the study (File no. 2019.719) exempt from approval under the Medical Research Involving Human Subjects Act (WMO). The statistical results are based on calculations by LM and JWRT (Amsterdam UMC) using non-public anonymised microdata from Statistics Netherlands and comply to all Statistics Netherlands privacy regulations and the Dutch law regarding use of their non-public microdata. Selected data from Studielink of the applicant pool was anonymised by Statistics Netherlands. The researchers had no access to identifiable information.
Results
Demographic variables associated with becoming an HPE student
Results from the univariable logistic regression (see in Supplementary Appendix) showed that all variables were associated with becoming an HPE student within at least one cohort. We examined data for evidence of multicollinearity. This led us to exclude one variable (number of parents born abroad) which was previously a part of our dataset, because the Pearson coefficient correlations between ‘migration background’ and ‘number of parents born abroad’ were >0.82 in each age cohort, which can be considered strong (Schober et al. Citation2018). We therefore excluded ‘number of parents born abroad’ from further analyses and did not include it in this article. Keeping the variable ‘migration background’ enabled us to investigate whether the transition to 100% selection impacted groups with or without a migration background in different ways. No evidence was found for multicollinearity in the remaining variables. All independent variables were, therefore, included in multivariable regression models for each applicant cohort independently (see in Supplementary Appendix for the full models and in this manuscript for the final models). No significant interactions were found.
Table 2. Results of multivariable logistic regression for the final model for each cohort, performed on applicants eligible for placement.
Applicant pool models
shows that the final models change between cohort 2008 and 2015. In cohort 2008, where 50–100% of students were admitted through weighted lottery (depending on each HPE faculty), only female gender (OR 1.15 [1.01–1.30]) and belonging to the highest wealth decile (OR 1.29 [1.10–1.51]) were significantly positively associated with becoming an HPE student. In cohort 2012, household wealth no longer contributed significantly to the model. Instead, an effect for parental income was found, with a positive association for the top-10 decile (OR 1.37 [1.18–1.60]). Female gender remained positively associated (OR 1.49 [1.28–1.73]), and migration background improved the model, with a negative association for having a TMSD migration background (OR 0.68 [0.52–0.89]). The model of cohort 2015 (100% selection) showed that having at least one HP as a parent (OR 1.27 [1.10–1.47]), female gender (OR 1.35 [1.19–1.53] and belonging to the top-10 wealth decile (OR 1.28 [1.10–1.49]) were positively associated. Negative associations were found for a TMSD migration background (0.72 [0.57–0.91]). Other variables did not contribute to the models in (p > .05) and were therefore not included (see in Supplementary Appendix for the result of the full model, that is before performing a stepwise forward logistic regression).
To investigate whether results related to migration background could be explained by differences in SES, we analysed the frequency distribution of income and wealth deciles for each migration background category (Dutch, TMSD and OMB). As income and wealth were distributed highly unequally between the three different categories, we performed additional analyses on the applicant pool, using recoded income and wealth groups to maximize balance. Within the lowest wealth group (percentiles 0–60), the negative association for a TMSD background remained significant in cohort 2012 and 2015 (see in Supplementary Appendix). In income percentiles group 0–70, the negative association for a TMSD background was significant in cohort 2015. In cohort 2012, this was true for income percentile group 71–100. This showed that the negative associations for TMSD migration background cannot be explained by SES: they remained negative even when compared to the Dutch reference category without a migration background from the same income/wealth groups.
Table 3. Summarised distribution of students in (sub-)cohorts, including statistically significant changes in applicant pools and HPE students.
Representativeness of HPE students
shows the distribution of students per variable in all (sub)cohorts. Women represented approximately half of all age cohorts and eligible student pools, but their proportion is significantly higher in the applicant pool and the HPE student population (). A 16.1% decrease was seen in the proportion of men in the HPE student population between cohort 2008 and 2015 (from 34.1 to 28.6%).
The proportion of HPE students with 1 or 2 HP parents decreased significantly between cohort 2008 and 2015, but compared to the age cohort, eligible pool, and applicant pool, students with such parents are still overrepresented amongst HPE student students.
The distribution of HPE students over the different income groups has not undergone major changes between cohort 2008 and 2015, but their distribution over the different wealth groups shows an increase in the proportion of students from the lowest 70 percentiles, and a decrease of the proportion of students from the top 10 decile. However, students from the highest income and wealth groups remained overrepresented amongst HPE students compared to the eligible and applicant pools, but especially compared to their age cohorts.
Those with at least one parent who receives social welfare are underrepresented in the eligible pool, but they do apply at relatively high rates: in each cohort, their proportion in the applicant pool is higher than their proportion in the eligible pool. However, they are admitted at lower rates, resulting in underrepresentation amongst HPE students compared to their age cohorts.
Relative to the age cohorts, TMSD students are underrepresented in the eligible pool, applicant pool, and HPE student populations for all cohorts, while OMB students are overrepresented amongst applicants and HPE students.
Discussion
The results of our retrospective multi-cohort study show that in the transition from hybrid lottery and selection to 100% selection, the number of background variables which significantly influenced applicants’ odds of admission increased from 2 (gender and wealth percentile) to 4 (gender, wealth percentile, number of HP parents, and migration background) in our multivariable logistic regression models. The lower odds of applicants with a TMSD migration background in a predominantly or 100% selection-based procedure, could not be explained by SES, as evidenced by in the Supplementary Appendix: odds ratios for TMSD applicants were also significantly lower compared to their Dutch peers belonging to the same income or wealth categories. This influenced the representativeness of HPE student populations, which changed during the transition to selection in comparison to the age cohorts, eligible pool, and applicant pool. Our results provide a nuanced picture of what happens in each step on the route to an HPE programme, affecting the level of representation of different student groups.
First, in the step from primary school to secondary school, the placement of pupils into either vocational, higher general or pre-university tracks is a process which affects pupils of different backgrounds in a different way (Dutch Inspectorate of Education Citation2021). Hence, at age 16, students who belong to high SES families, and have no TMSD migration background, are disproportionally represented in the pre-university track and thus in the future eligible student pool (). The resulting eligible student pools for HPE programs are far from representative of their age cohorts. The loss of ethnic and socio-economic diversity which occurs in this step, is much greater than the loss on these aspects of diversity which takes place in the step towards applying or being admitted, regardless of whether HPE admissions consist of hybrid lottery and selection or 100% selection. This suggests that it is the primary cause for the underrepresentation of lower SES and TMSD students in Dutch HPE programmes. This finding corresponds with the argument of Cohen et al. (Citation2002), who argued that the unequal access to educational opportunities in primary and secondary education for minority students of lower SES backgrounds was at the root of the lack of diversity in U.S. medical schools.
Second, in the step to applying for an HPE programme, the results show that compared to the eligible pool, men and students without parents in the health professions are underrepresented in the applicant pool: in cohort 2015 for example, men represent about half of the eligible pool, but less than 32% of the applicant pool. Students without HP parents represent 83% of the eligible pool, but 78.1% of the applicant pool. This suggests self-selection in the decision to apply, resulting in a loss of diversity and representativeness on these background characteristics. These findings support qualitative research by our research team (submitted), which suggested that a network in the medical field was of fundamental importance for high school students in making the study choice for an HPE programme and in preparing for the selection procedure. A pattern of self-selection by men and students without medical parents was also found by Simmenroth-Nayda and Görlich (Citation2015). It differs however with the U.S. context, in which between 2001 and 2015, the percentage of female applicants to medical school slightly declined from 49.7 to 46.5% (Zhang et al. Citation2021).
Students with a migration background applied at a higher rate than their share in the eligible pool. This suggests that self-selection in the step towards applying is not a reason for their underrepresentation in HPE populations. Our findings are in contrast with qualitative research into self-selection by ethnic minorities and/or lower SES students, relating to barriers in (preparing for) applying to an HPE programme (Greenhalgh et al. Citation2004; Mathers and Parry Citation2009; Freeman et al. Citation2016). This is not to say that Dutch eligible students with a migration background do not face systemic barriers, but these barriers do not translate to an underrepresentation in the applicant pool compared to the eligible pool.
Students from a lower SES background (measured on the basis of parental income, wealth, or social welfare recipient status) applied in similar or higher rates (detailed data not shown) compared to their proportion in the eligible student population. This suggests that self-selection in the step towards applying is not a main reason for their underrepresentation in HPE populations. This is in contrast with the increased ratio of applicants from high-income counties versus low-income counties in the United States, as found by Zhang et al. (Citation2021). However, lower SES applicants were slightly overrepresented in the population of applicants which failed their final exams in high school. Therefore, they were less often eligible for placement that year. These applicants could benefit from more guidance and targeted support, to ensure they pass their high school exams and thereby become eligible for placement without delay. The pool of applicants which was eligible for placement had a SES background which was more similar to that of the total eligible pool.
Third, in the step from applicant pool to HPE student pool, diversity is lost as applicants who were eligible for placement did not have the same odds of successful admission. We mainly attribute this to the use of selection, as the number of variables which influenced odds of admission increased from 2 to 4 in the period that the use of selection-based admission increased from 0-50% (depending on each faculty) to 100%. In cohort 2008 (hybrid lottery and selection procedure), students who are women and belong to the highest wealth groups had a significantly higher chance to be admitted. In cohort 2015 (100% selection), students who are women, have no TMSD migration background, whose parents are registered healthcare professionals, or who belong to the highest wealth groups, had a significantly higher chance to become HPE students. This negatively influenced the representativeness of the HPE student population, especially in comparison to the age cohorts.
The lower enrolment of men in HPE does not reflect their rates of university enrolment. Out of the 16-year-olds in cohort 2015 who were enrolled in the science-focused pre-university profile at age 16, their gender distribution in university is almost equal (49.5% men and 50.5% women, data not shown). Men in the eligible student population thus choose other university programs in greater proportions than the four HPE programs in our study.
Our results demonstrate that Dutch HPE students come from high-SES backgrounds at a more disproportionate level than previously thought. Van den Broek et al. (Citation2018), who used household income as a SES indicator, found that 30% of Dutch medical students came from the top-10 household income decile. In our cohorts, more than 60% of HPE students had at least one parent in the top-10 personal income decile (compared to 30–33% in the age cohorts), and more than 36% came from the top-10 household wealth decile (compared to 15–16% in the age cohorts). The differences in results between Van den Broek and our work could be attributed to our method of selecting the highest personal income decile of either parent, which is not averaged out by the possibly lower income decile of the other parent. The differences in our results between income and wealth deciles are caused by the fact that wealth percentiles are a combination of household income and household assets. Factors such as mortgage debts reduce household wealth levels.
The different odds of admission we found for different groups of applicants align with the Ottawa consensus statement by Prideaux et al. (Citation2011), which argued that several procedures used for HPE admission carry a risk for bias, and thus a lack of equal opportunity for all applicants. The finding that in the transition to 100% selection, the number of background variables which were significantly associated with the odds of admission increased from two to four, is concerning. It points to an increased level of inequality in opportunity, especially for lower SES and TMSD students. These students are already disadvantaged early on the route to an HPE programme, namely in the step from primary school to the pre-university track in high school. Our findings support Patterson et al., who argued that considering the impediments which certain social groups face, and the societal factors which may limit them from demonstrating sufficient academic excellence, selection systems which are dominated by measures of excellence perpetually maintain ‘the reproductive nature of medical education as elite’ (Patterson et al. Citation2018, 1095).
Implications
Our conclusions can provide a new dimension in the international debate on whether lottery or selection would result in fairness towards applicants and/or equitable outcomes for society. This is relevant to all countries and contexts in which there is a lack of diversity or representativeness in the HPE applicant pool and student population. It emphasises to the international HPE community, in which there is debate about lottery versus selection (Hubbeling Citation2018; Mazer Citation2021; ten Cate Citation2021) that a random or weighted lottery is not an easy solution to achieve fairness or equity in admissions as long as the applicant pool is not representative of their age cohort, due to accumulated disadvantage for certain groups in primary and secondary education. We therefore recommend HPE programmes around the world to gain insight into the diversity of the applicant pool in comparison to their age cohort and the eligible student population. After all, The Netherlands is not unique in that eligible pools for HPE programmes are not representative for the population as a whole (Steven et al. Citation2016). Cohen et al. (Citation2002) argued that fundamental reforms of the education system at the pre-college stage are the long-term solution to achieving a representative health professions workforce, but that until those reforms take place, affirmative action tools in HPE programmes are critical. Our study supports that argument, but such tools, or Widening Access policies in general, are currently not being used in the selection procedure in The Netherlands, nor are they permitted by law. Recently, the government made lottery-admission legal again, but a lottery system does not have a mechanism in place to create a level playing field for those who are already significantly underrepresented in the eligible student pool or applicant pool due to the known barriers resulting from a lower SES status or a TMSD migration background. These barriers, such as lower expectations being placed upon them by the education system (Dutch Inspectorate of Education Citation2021), discrimination (Dutch Inspectorate of Education Citation2021), and differential access to high-quality and highly resourced schools (Grafton-Clarke Citation2016; Kumwenda et al. Citation2017; Dutch Inspectorate of Education Citation2021), need to be addressed by all parties involved in primary and secondary levels of education. They are however beyond the scope of this article. Based on our findings and this broader context of educational inequality, we argue that a return to 100% lottery will not help in solving the problem of a lack of diversity in HPE, as long as eligible pools for HPE programmes are not representative of their age cohorts.
Our study design can be replicated globally, where HPE programmes aiming to admit a representative student population could consider the diversity of the age cohort, eligible pool, and the applicant pool when deciding on the most suitable type of admissions procedure to achieve this goal. Depending on each local context, different steps can be taken to admit a student population which is representative for their age cohort (i.e. the (future) patient population). Random lottery at best results in an HPE student population which is representative of the applicant pool, but in contexts where the applicant pool lacks diversity, lottery is not a solution. In such contexts, selection procedures could be implemented which have the explicit goal to prioritise equitable admissions. Successful international examples of Widening Access policies (Powis et al. Citation2007; Cleland et al. Citation2015; Alexander et al. Citation2017; Martin et al. Citation2018), quota systems (Becak and Cirino Citation2018; Curtis Citation2018), contextualised admissions (Medical Schools Council Selection Alliance Citation2018), using selection tools which are known to not disadvantage underrepresented students (Jerant et al. Citation2015; Razack et al. Citation2015; Taylor et al. Citation2015), and other instruments that can ensure a representative health professional workforce, could be studied and implemented where appropriate. Additionally, if there is insufficient diversity in the eligible pool compared to the age cohort, policies need to be developed to address this problem at the earliest possible stages by all parties involved in primary and secondary education. Where there is insufficient diversity in the applicant pool, interventions are necessary in the area of recruitment, such as pipeline programs and other Widening Participation efforts (Martin et al. Citation2018; Clayborne et al. Citation2021), which could be designed by universities and other parties.
On the basis of our findings, we advance the following suggestions for HPE programmes in the Dutch context: Equitable admissions procedures should be developed to prioritise increasing the admission of students from lower SES families, students with a TMSD migration background, students without HP parents, and men. Such admissions procedures need to become legally permitted, so HPE programs can implement them. We recommend developers of equitable admissions policies to be aware of intersectionality (Crenshaw Citation1991): applicants can belong to multiple underrepresented groups, e.g. a man with an ethnic minority and lower SES background and may thereby face accumulated disadvantages in the route to an HPE programme. Additional policy interventions at the pre-university stage are necessary to encourage and support men and those without HP parents to apply to HPE programmes in greater numbers, for example by providing them with access to a medical network (Wouters Citation2020). Furthermore, primary and secondary schools should support lower SES children and children with a TMSD background at an early stage to successfully enrol in the science-focused pre-university track, which would make them eligible to apply for an HPE programme in the future.
Limitations
Our sample consists of more than 600,000 individuals who were 16 years old on 1 October 2008, 2012, or 2015. The design and size of this sample are major strengths of the study. Another strength is that logistic regression was performed on those applicants who all had similar backgrounds: they were of the same age, and 98% of them (data not shown) had passed the examination of the science-focused pre-university track (meaning only 2% of this cohort applied through a different route (e.g. the higher vocational educational route). This reduces the risk of possible confounders. Additionally, we compared our three applicant pools who were eligible for placement with the combined applicant dataset of the 2009–2018 academic years, including the students who applied and were not part of our cohorts. We compared them on all variables included in the study, to see how representative the applicant pools within our cohorts were for the combined applicant pool of these nine years. Our applicant pools consisted more often of those who were Dutch without a migration background (78%) and with parents who belonged to the top-10 income decile (60%), compared to all applicants in the 2009-2018 period (71%, respectively, 55%), but were relatively comparable on the other variables.
We could not make a comparison with the students admitted through 100% lottery (before 2000), as data for several variables was not available. However, 50–100% of the HPE students of cohort 2008 was admitted through weighted lottery (depending on the specific programme and university), which does provide sufficient ground for comparison with a 100% selection procedure.
We could not compare the representativeness of HPE student populations between individual programs of Medicine, Pharmacy, Clinical Technology, and Dentistry offered at different Dutch universities. This is because Statistics Netherlands regulations do not allow for microdata research on the institutional level. To address this limitation, we hereby add the total number of seats in the academic year 2018–2019 for each HPE program on a national level (Studiekeuze123, Citation2017) as a proxy for their distribution in our dataset: Medicine: 2835 (78,9%); Pharmacy: 270 (7.5%); Dentistry: 259 (7.2%); Clinical Technology: 230 (6.4%); Total: 3594 (100%). These national proportions are the best proxy for the proportions within our dataset.
Finally, parental education levels could not be included due to this data being unstandardised, and unavailable for a part of the sample. We addressed this limitation by having three other indicators for SES.
Further research
Although data may indicate a need for change in admissions policies, evidence alone does not suffice. Depending on countries’ societal, political, and legal context, legislative adaptations and creating societal support may be needed. In a follow-up study, we investigated the level of institutional and societal support for widening access policies, to inform possible legislative and institutional changes.
Next to research into the most suitable designs for admissions procedures which would prioritise a representative student population, further research is required into the effects of individual selection tools, as well as combinations of tools, on student diversity.
Supplemental Material
Download PDF (98.4 KB)Acknowledgements
The authors thank the Equal Opportunities Alliance of the Ministry of Education, Culture, and Science for providing funds to support this research. The authors also wish to thank all involved people working at Statistics Netherlands, Studielink, and the Universities of The Netherlands (UNL) for their cooperation in making this research project possible. Finally, the authors also wish to thank their colleagues at Amsterdam UMC, location VUmc, Team Research in Education and Prof. Vinod Subramaniam, President of the University of Twente, for their valuable feedback on our manuscript. We would also like to extend our gratitude to the Nationaal Regieorgaan Onderwijsonderzoek, which provided funding for the PhD project within which this project is executed.
Disclosure statement
The authors report no conflict of interest.
Correction Statement
This article has been corrected with minor changes. These changes do not impact the academic content of the article.
Additional information
Funding
Notes on contributors
Lianne Mulder
Lianne Mulder, MA, MPhil, is a PhD student at Amsterdam UMC, Research in Education, Faculty of Medicine, Vrije Universiteit Amsterdam, The Netherlands; and LEARN! Faculty of Psychology and Education, Vrije Universiteit, Amsterdam.
Anouk Wouters
Anouk Wouters, PhD, is Assistant Professor at Amsterdam UMC, Research in Education, Faculty of Medicine, Vrije Universiteit Amsterdam, The Netherlands; and LEARN! Faculty of Psychology and Education, Vrije Universiteit, Amsterdam.
Jos W. R. Twisk
Jos W. R. Twisk, PhD, is Professor at the Department of Epidemiology and Data Science, Amsterdam UMC, Vrije Universiteit Amsterdam,Amsterdam Public Health, Amsterdam, The Netherlands.
Andries S. Koster
Andries S. Koster, PhD, is Associate Professor of Pharmacology at the Department of Pharmaceutical Sciences of Utrecht University, Utrecht, The Netherlands.
Eddymurphy U. Akwiwu
Eddymurphy U. Akwiwu, MSc, is a PhD student at the Department of Epidemiology and Data Science, Amsterdam UMC, Vrije Universiteit Amsterdam, Amsterdam Public Health, Amsterdam, The Netherlands.
Jan H. Ravesloot
Jan H. Ravesloot, PhD, is Professor at the Department of Medical Biology, Amsterdam UMC, Faculty of Medicine, University of Amsterdam, The Netherlands.
Gerda Croiset
Gerda Croiset, MD, PhD, is Dean of Education and Training at the Wenckebach Institute for Education and Training, University Medical Center Groningen, Groningen, The Netherlands.
Rashmi A. Kusurkar
Rashmi A. Kusurkar, MD, PhD, is Associate Professor and Research Programme Leader at Amsterdam UMC, Research in Education, Faculty of Medicine, Vrije Universiteit Amsterdam, The Netherlands; and LEARN! Faculty of Psychology and Education, Vrije Universiteit, Amsterdam.
References
- Alexander K, Cleland J. 2018. Social inclusion or social engineering? The politics and reality of widening access to medicine in the UK. In: Shah M, McKay J, editors. Achieving equity and quality in higher education: global perspectives in an era of widening participation. Cham, Switzerland: Springer; p. 143–172.
- Alexander K, Fahey Palma T, Nicholson S, Cleland J. 2017. 'Why not you?' Discourses of widening access on UK medical school websites. Med Educ. 51(6):598–611.
- Ball R, Alexander K, Cleland J. 2020. “The biggest barrier was my own self”: the role of social comparison in non-traditional students’ journey to medicine. Perspect Med Educ. 9(3):147–156.
- Bassett AM, Brosnan C, Southgate E, Lempp H. 2019. The experiences of medical students from First-in-Family (FiF) university backgrounds: a Bourdieusian perspective from one English medical school. Res in Post-Compulsory Educ. 24(4):331–355.
- Becak R, Cirino L. 2018. Affirmative actions as an instrument to balance access to superior education in Brazil: the quotas policy. In: Shah M, McKay J, editors. Achieving equity and quality in higher education: global perspectives in an era of widening participation. Cham, Switzerland: Springer; p. 219–233.
- Bowes L, Thomas L, Peck L, Nathwani T. 2013. International research on the effectiveness of widening participation. Report to HEFCE and OFFA by CFE and edge Hill University. https://webarchive.nationalarchives.gov.uk/ukgwa/20160702152239/http://www.hefce.ac.uk/pubs/rereports/Year/2013/wpeffectiveness/Title,92183,en.html.
- Clayborne EP, Martin DR, Goett RR, Chandrasekaran EB, McGreevy J. 2021. Diversity pipelines: the rationale to recruit and support minority physicians. J Am Coll Emerg Physicians Open. 2(1):e12343.
- Cleland J, Nicholson S, Kelly N, Moffat M. 2015. Taking context seriously: explaining widening access policy enactments in UK medical schools. Med Educ. 49(1):25–35.
- Cohen-Schotanus J, Muijtjens AM, Reinders JJ, Agsteribbe J, van Rossum HJ, van der Vleuten CP. 2006. The predictive validity of grade point average scores in a partial lottery medical school admission system. Med Educ. 40(10):1012–1019.
- Cohen JJ, Gabriel BA, Terrell C. 2002. The case for diversity in the health care workforce. Health Aff. 21(5):90–102.
- Crenshaw K. 1991. Mapping the margins: intersectionality, identity politics, and violence against women of color. Stanford Law Rev. 43(6):1241–1299.
- Curtis E. 2018. Vision 20:20 and indigenous health workforce development: institutional strategies and initiatives to attract underrepresented students into elite courses. In: Shah M, McKay J, editors. Achieving equity and quality in higher education: global perspectives in an era of widening participation. Cham, Switzerland: Springer; p. 119–142.
- Dutch Inspectorate of Education. 2021. The State of education 2021. The Netherlands: Ministry of Education, Culture and Science.
- Ferguson E, James D, Yates J, Lawrence C. 2012. Predicting who applies to study medicine: implication for diversity in UK medical schools. Med Teach. 34(5):382–391.
- Freeman BK, Landry A, Trevino R, Grande D, Shea JA. 2016. Understanding the leaky pipeline: perceived barriers to pursuing a career in medicine or dentistry among underrepresented-in-medicine undergraduate students. Acad Med. 91(7):987–993.
- Grafton-Clarke C. 2016. Is it too difficult for disadvantaged applicants to get into medical school? Med Teach. 38(11):1184.
- Greenhalgh T, Seyan K, Boynton P. 2004. “Not a university type”: focus group study of social class, ethnic, and sex differences in school pupils’ perceptions about medical school. BMJ. 328(7455):1541.
- Hadinger MA. 2017. Underrepresented minorities in medical school admissions: a qualitative study. Teach Learn Med. 29(1):31–41.
- Hubbeling D. 2018. The lottery is still an option. Med Educ. 52(5):574.
- Jerant A, Fancher T, Fenton JJ, Fiscella K, Sousa F, Franks P, Henderson M. 2015. How medical school applicant race, ethnicity, and socioeconomic status relate to multiple mini-interview-based admissions outcomes: findings from one medical school. Acad Med. 90(12):1667–1674.
- Kelly ME, Dowell J, Husbands A, Newell J, O‘Flynn S, Kropmans T, Dunne FP, Murphy AW. 2014. The fairness, predictive validity and acceptability of multiple mini interview in an internationally diverse student population- a mixed methods study. BMC Med Educ. 14(1):267.
- Kumwenda B, Cleland JA, Walker K, Lee AJ, Greatrix R. 2017. The relationship between school type and academic performance at medical school: a national, multi-cohort study. BMJ Open. 7(8):e016291.
- Leijen S, Nielen T, Steehouder L, Vlek de Coningh M. 2019. Internationalisering in het hoger onderwijs [Internationalization in higher education]. The Hague, the Netherlands: Ministry of Education, Culture and Science: Dienst Uitvoering Onderwijs.
- Marrast LM, Zallman L, Woolhandler S, Bor DH, McCormick D. 2014. Minority physicians’ role in the care of underserved patients: diversifying the physician workforce may be key in addressing health disparities. JAMA Intern Med. 174(2):289–291.
- Martin AJ, Beska BJ, Wood G, Wyatt N, Codd A, Vance G, Burford B. 2018. Widening interest, widening participation: factors influencing school students' aspirations to study medicine. BMC Med Educ. 18(1):117.
- Mathers J, Parry J. 2009. Why are there so few working-class applicants to medical schools? Learning from the success stories. Med Educ. 43(3):219–228.
- Mazer BL. 2021. Accepting randomness in medical school admissions: the case for a lottery. Med Teach. 43(10):1216–1218.
- McHarg J, Mattick K, Knight LV. 2007. Why people apply to medical school: implications for widening participation activities. Med Educ. 41(8):815–821.
- Medical Schools Council Selection Alliance. 2018. Indicators of good practice in contextual admissions. London: Medical Schools Council.
- Studiekeuze123 [Study Choice 123]. 2017. Overview of fixus programs with selection for the 2018–2019 academic year. The Netherlands: Ministry of Education, Culture and Science.
- Niven V, Andiappan M, Cabot L, Gallagher JE. 2019. Embarking on a professional career: social advantage in dentistry and medicine. UK dental and medical student applications and admissions, 1996–2011. Br Dent J. 227(5):411–418.
- Parker R, Stack S, Schneider S. 2017. Why diversity and inclusion are critical to the American college of emergency physicians’ future success. Ann Emerg Med. 69(6):714–717.
- Patterson F, Roberts C, Hanson MD, Hampe W, Eva K, Ponnamperuma G, Magzoub M, Tekian A, Cleland L. 2018. Ottawa consensus statement: selection and recruitment to the healthcare professions. Med Teach. 40(11):1091–1101.
- Powis D, Hamilton J, McManus I. 2007. Widening access by changing the criteria for selecting medical students. Teach Teach Educ. 23(8):1235–1245.
- Prideaux D, Roberts C, Eva K, Centeno A, Mccrorie P, Mcmanus C, Patterson F, Powis D, Tekian A, Wilkinson D. 2011. Assessment for selection for the health care professions and specialty training: consensus statement and recommendations from the Ottawa 2010 Conference. Med Teach. 33(3):215–223.
- Puddey IB, Mercer A, Carr SE, Louden W. 2011. Potential influence of selection criteria on the demographic composition of students in an Australian medical school. BMC Med Educ. 11(1):97.
- Razack S, Hodges B, Steinert Y, Maguire M. 2015. Seeking inclusion in an exclusive process: discourses of medical school student selection. Med Educ. 49(1):36–47.
- Saha S. 2014. Taking diversity seriously: the merits of increasing minority representation in medicine. JAMA Intern Med. 174(2):291–292.
- Schober P, Boer C, Schwarte LA. 2018. Correlation coefficients: appropriate use and interpretation. Anesth Analg. 126(5):1763–1768.
- Schripsema NR, van Trigt AM, Borleffs JC, Cohen-Schotanus J. 2017. Impact of vocational interests, previous academic experience, gender and age on situational judgement test performance. Adv in Health Sci Educ. 22(2):521–532.
- Sianou-Kyrgiou E, Tsiplakides I. 2011. Similar performance, but different choices: social class and higher education choice in Greece. Stud Higher Educ. 36(1):89–102.
- Simmenroth-Nayda A, Görlich Y. 2015. Medical school admission test: advantages for students whose parents are medical doctors? BMC Med Educ. 15(1):81.
- Southgate E, Kelly BJ, Symonds IM. 2015. Disadvantage and the ‘capacity to aspire’ to medical school. Med Educ. 49(1):73–83.
- Stegers-Jager K. 2018. Lessons learned from 15 years of non-grades-based selection for medical school. Med Educ. 52(1):86–95.
- Steven K, Dowell J, Jackson C, Guthrie B. 2016. Fair access to medicine? Retrospective analysis of UK medical schools application data 2009–2012 using three measures of socioeconomic status. BMC Med Educ. 16(1):11.
- Taylor C, Green K, Spruce A. 2015. Evaluation of the effect of socio-economic status on performance in a multiple mini interview for admission to medical school. Med Teach. 37(1):59–63.
- Ten Cate O. 2021. Rationales for a lottery among the qualified to select medical trainees: decades of Dutch experience. J Grad Med Educ. 13(5):612–615.
- Van den Broek A, de Korte K, Cuppen J, Wartenbergh F, Bendig-Jacobs J, Mulder J, Hellegers A. 2018. Monitor Beleidsmaatregelen 2017–2018: studiekeuze, studiegedrag & leengedrag in relatie tot beleidsmaatregelen in het hoger onderwijs, 2006-2017. [Monitor Policy measures 2017–2018: study choice, study behaviour & student loan behaviour in relation to policy measures in higher education, 2006–2017]. Nijmegen, Netherlands: ResearchNed.
- Wouters A. 2020. Getting to know our non-traditional and rejected medical school applicants. Perspect Med Educ. 9(3):132–134.
- Wouters A, Croiset G, Isik U, Kusurkar RA. 2017. Motivation of Dutch high school students from various backgrounds for applying to study medicine: a qualitative study. BMJ Open. 7(5):e014779.
- Wouters A, Croiset G, Kusurkar R. 2018. Selection and lottery in medical school admissions: who gains and who loses? MedEdPublish. 7(4):271.
- Zhang D, Li G, Mu L, Thapa J, Li Y, Chen Z, Shi L, Su D, Son H, Pagán JA. 2021. Trends in medical school application and matriculation rates across the United States from 2001 to 2015: implications for health disparities. Acad Med. 96(6):885–893.