
Abstract
This paper evaluates a range of measures commonly used to target and measure the success of efforts to widen access to higher education. We demonstrate empirically that the area-level widening access metrics advocated by England’s Office for Students, POLAR and TUNDRA, are unfit for purpose because they yield unacceptably high rates of false positives (individuals identified as socioeconomically disadvantaged when they are not). We argue that these and other demonstrably flawed area-level and school-level metrics should be replaced by officially verified individual-level indicators of socioeconomic disadvantage which yield few false positives, most notably receipt of free school meals. Unless and until this change is made, widen access efforts will be inefficient at best and counterproductive at worst, and associated statistics will give a misleading picture of how much progress is being made on widening access.
Introduction
Despite the expansion of the UK higher education system since the 1960s, relative rates of access to higher education have been slow to equalise, especially in relation to more prestigious higher education institutions (Boliver Citation2011, Citation2015). Consequently, achieving wider access in the sense of more equitable rates of participation in higher education across different socioeconomic groups remains a policy goal in the UK as in other nations with high participation systems of higher education (Marginson Citation2016). Numerous widening access initiatives have been pursued over the years. Throughout the 1990s and 2000s, these focused on the perceived need (since debunked) to ‘raise aspirations’ among those from socioeconomically disadvantaged backgrounds (Passy, Morris, and Waldman Citation2009; Rainford Citation2021). More recently, the focus has shifted to supporting disadvantaged students to realise their as-yet-unmet potential via engagement in pre-university academic support programmes (e.g. Barkat Citation2019) and the greater use of contextualised admissions practices which seek to take account of the impact of socioeconomic circumstances on prior attainment (Boliver, Gorard, et al. Citation2017; Boliver et al. Citation2020). The intended targets of these widening access initiatives have been those from socioeconomically disadvantaged backgrounds. However, there has been little prior systematic evaluation of the indicators commonly used to target and monitor widening access initiatives focusing on their effectiveness at distinguishing between those who are socioeconomically disadvantaged and those who are not.
A detailed evaluation of widening access measures has lately become a pressing concern in the UK context. The higher education regulator for England, the Office for Students (OfS), has set ambitious new national widening access targets that promise to usher in a new era of rapid progress on widening access following two decades of negligible change (Boliver Citation2015). The OfS is seeking a reduction in the ratio of young entrants to England’s most academically selective universities from areas with the highest and lowest rates of young participation in higher education, from 5:1 in 2017, to 3:1 by 2024–25, and to 1:1 by 2038–39 (Office for Students (OfS) Citation2019). These targets have been set using the area-level measure known as POLAR (short for Participation of Local Areas) and are now being monitored using a further an ‘enhanced area-based measure’ known as TUNDRA (short for tracking under-representation by area) released by the OfS in 2020. Ostensibly, these measures enable the OfS to perform its duty to ‘promote equality of opportunity in connection with access to and participation in higher education provided by English higher education providers’ (Higher Education Act Citation2017: 2, 1, e), and to exercise its powers to request statistical information from higher education providers on the socio-economic background (along with gender and ethnicity) of admitted students (Higher Education Act Citation2017 , 9, 3, p.7).Footnote1 If POLAR and TUNDRA are valid and reliable measures of whether or not individuals are socioeconomically disadvantaged, a radical equalisation of widening access chances may be afoot. If they are not, any progress made on widening access may be more apparent than real.
Against this backdrop, this paper presents a theoretically informed and empirically evidenced examination of the adequacy of POLAR and of TUNDRA as a means of identifying those from socioeconomically disadvantaged backgrounds for the purposes of widening access to higher education. We also examine several other area-level and school-level measures currently in use across the UK higher education sector to target and monitor the success of widening access initiatives (Boliver, Crawford, et al. Citation2017; Boliver and Powell Citation2021), as well as considering the suitability of a range of widening access indicators measured at the level of the individual. We begin by discussing the need to assess the validity and reliability of potential indicators of socioeconomic disadvantage, and highlight the importance of separately evaluating the extent to which metrics incorrectly identify individuals as socioeconomically disadvantaged although they are not (known as false positives) and/or incorrectly identify individuals as not socioeconomically disadvantaged although they are (known as false negatives). We make the case for the greater importance of minimising the rate of false positives than of minimising the rate of false negatives when it comes to identifying suitable widening access indicators. We then discuss the validity and reliability of a range of indicators measured at the level of the individual, area and school, distinguishing between the extent to which each metric is likely to produce false negatives and false positives. Finally, we draw on evidence from an analysis of the National Pupil Database for England to demonstrate empirically that the area-level measures POLAR and TUNDRA yield high rates of false negatives and, more importantly, high rates of false positives, making them unsuitable for use in targeting or monitoring widening access initiatives. Similarly concerning evidence is presented in relation to the area-based deprivation measures IMD, IDACI and ACORN, and a range of indicators measured at the level of the school. We conclude by calling for national widening access targets to be recast using verified individual-level indicators of socioeconomic disadvantage derived from administratively verified data, notably receipt of free school meals during secondary schooling.
Evaluating widening access indicators
Evaluating widening access indicators involves making judgements about their validity and reliability. In this case, we are concerned with the validity and reliability of indicators of socioeconomic disadvantage which we define as socially and economically challenging personal circumstances which are likely to have impacted negatively on educational achievement and progression. Because socioeconomic disadvantage is a multifaceted concept, it is unlikely that any single measure will fully differentiate between individuals who are disadvantaged and those who are not. Moreover, because the concept of socioeconomic disadvantage is relative as well as absolute, there is no hard boundary between the disadvantaged and non-disadvantaged, although it is still possible to identify those who are almost certainly disadvantaged and those who are almost certainly not.
The validity of an indicator refers to how accurately it operationalises the concept it purports to operationalise. Measures which operationalise socioeconomic disadvantage too broadly will be of limited validity in that some individuals will be identified as socioeconomically disadvantaged when in fact they are not, known as false positives or Type I errors. Conversely, measures which operationalise the concept of socioeconomic disadvantage too narrowly will be of reduced validity in the opposite direction in that some individuals will be identified as not socioeconomically disadvantaged even though in reality they are, known as false negatives or Type II errors.
The reliability of an indicator, on the other hand, refers to how consistently the measurement instrument captures the operationalised concept. Indicators which rely on self-reported information which is not, and perhaps cannot, be verified will be less reliable than information from verified sources since the reporter may give incorrect information, unintentionally or otherwise. The reliability of an indicator is also reduced in proportion to the amount of missing data, with missing data for genuinely socioeconomically disadvantaged individuals contributing to false negatives. As with indicators that have low validity, indicators with low reliability will tend to produce significant numbers of false positives and/or false negatives.
Measures that are of low validity and/or reliability are problematic in one or both of two ways: they produce a significant number of ‘false negatives’ – in the case of widening access metrics, individuals identified as not socioeconomically disadvantaged although they are – and/or they produce a significant number of ‘false positives’ – in this case, individuals identified as socioeconomically disadvantaged when they are not. Ideally an indicator would produce no false negatives and no false positives. However, in the context of widening access work, where the intention is to target a particular sub-population and/or resources may be finite,Footnote2 we argue that minimising the incidence of false positives is more important than minimising the incidence of false negatives. This is because a widening access initiative targeted using an indicator which produces no false positives but a substantial number of false negatives will fail to reach some of its intended beneficiaries and so will be less effective than it could have been, but at least does some good relative to the status quo. In contrast, a widening access initiative targeted using an indicator which produces no false negatives but a substantial number of false positives will reach a significant number of unintended beneficiaries as well as intended ones, at best giving a misleading picture of how much good is being done, and at worst doing more harm than good if most of the limited resources end up going to advantaged individuals rather than disadvantaged ones.
The greater importance of minimising the rate of false positives than of minimising the rate of false negatives when it comes to identifying suitable indicators of socioeconomic disadvantage for the purposes of widening access is illustrated . Each of the nine panels in contains two circles, one drawn using a solid line representing the hypothetical subset of individuals who are genuinely socioeconomically disadvantaged, and a second drawn using a dashed line representing a hypothetical widening access indicator. Each panel depicts a differing degree of overlap between the two circles, representing variation in the extent to which the hypothetical widening access indicator produces few, some or many false negatives (from left to right) combined with few, some or many false positives (from top to bottom). The overlapping portion of the two circles in each panel represents the true positives captured by the indicator, that is, those who are in fact disadvantaged and have been correctly identified by the indicator as such. In contrast, the non-overlapping portion of the solid line circle represents false negatives – those who have been incorrectly identified as not disadvantaged even though they are – while the non-overlapping portion of the dashed line circle represents false positives – those who have been incorrectly identified by the indicator as socioeconomically disadvantaged though they are in fact not. Finally, the portion of each panel surrounding both circles represents true negatives – those who have been correctly identified by the hypothetical widening access indicator as not disadvantaged.Footnote3
Figure 1. Venn diagrams showing illustrative combinations of rates of false negatives and false positives.
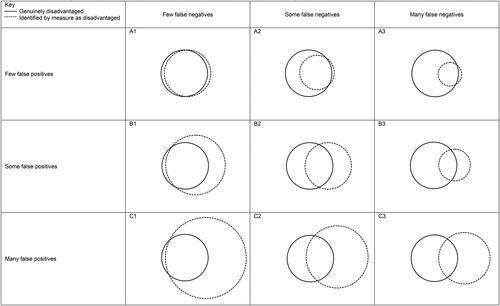
Panel A1 illustrates something close to the best-case scenario in which an indicator is near-perfect, producing few false positives and few false negatives. If such an indicator existed, it would be highly suitable for use alone and no other indicators would be needed. Panels A2 and A3 also represent indicators which produce few false positives, although they also produce some or many false negatives respectively. Clearly A2 and A3 type indicators will fail to reach some or many intended beneficiaries; however, because they will reach many more intended beneficiaries than unintended ones, they can be expected to be effective at widening access relative to the status quo. As such, while A1 represents the best single indicator, A2 and A3 are also suitable for use.
At the other extreme, panel C3 illustrates something close to the worst-case scenario in which an indicator is highly imperfect, producing many false positives and many false negatives. An indicator like that depicted in panel C3 clearly should not be used. Panels C1 and C2 also depict indicators which produce many false positives, together with few or some false negatives respectively. These indicators should not be used either, because as can be seen, they will reach more unintended beneficiaries than intended ones, rending widening access initiatives at best highly inefficient. At worse the use of such measures will in fact be counterproductive where the ratio of false positives to true positives exceeds that of the ratio of advantaged to disadvantaged individuals already enrolled in HE.
Indicators of the types represented in panels B1 and especially B2 and B3 should also be avoided, since all three yield a substantial number of false positives. Granted, the indicators in row B are not quite as problematic as those in row C, but they are nevertheless to be avoided in favour of those which resemble the panels in row A.
Widening access metrics currently in use
A range of widening access indicators are currently in use across the UK higher education sector (Boliver, Crawford, et al. Citation2017; Boliver and Powell Citation2021). These fall into three broad types: those measured at the level of the individual, the geographic area, or the school.
Individual-level indicators
Individual-level indicators refer directly to the personal circumstances of individuals and their immediate households. These include:
Receipt of free school meals, eligibility for which is restricted to low income households defined as households in receipt of one or more specific forms of income support;
From a low-income household, for example a household with an equivalised income that falls below 60% of the national median (DWP Citation2018);
From a lower social class background, typically operationalised as having parents who are not in professional or managerial jobs as indexed by the occupational social class measure NS-SEC;
Among the first generation of family members to go to university;
Has been in local authority care, defined as formal intervention by the state to place children at risk of harm in the care of foster families or a residential children’s home.;
Has been a young carer for an ill or disabled family member, an unofficial status which may entail support from a third sector organisation;
Has held refugee or asylum seeker status, defined as having been displaced from a previous country of residence and being currently without a legal right to remain in the current country of residence.
All other things being equal, individual-level measures are more valid measures of personal socioeconomic disadvantage than indicators measured at the level of the area or the school. Having been in receipt of free school meals (FSM) is a highly valid indicator of individual-level socioeconomic disadvantage because it refers directly to the economic circumstances of individuals. However, some false negatives are likely, since not all families eligible for free school meals take up this entitlement, and take-up rates decline as school children get older (CoWA Citation2016). Additional false negatives may occur with respect to individuals living in households with incomes only slightly above the threshold for FSM eligibility (Hobbs and Vignoles Citation2010).Footnote4 That said, the rate of false negatives can be minimised by measuring the number of years for which the individual received free school meals, or whether they were ever in receipt of free school meals, rather than their status in one particular year (Gorard Citation2012; Gorard et al. Citation2017 & Citation2019). Because it is possible to use the administrative records of schools, local authorities or government to verify whether or not someone received free school meals, this measure is highly reliable and likely to yield few false positives. Recognising the high validity and reliability of FSM data (most likely corresponding to Panel A2 in ), many high-tariff universities in England have called for FSM data to be made available to them via UCAS and in the meantime several have sought to collect FSM data directly from prospective students and their schools (Boliver and Powell Citation2021). In August 2021, UCAS began supplying individual level data relating to the free school meals status of university applicants through its modernised contextual data service (MDCS).
Like receiving free school meals, being from a low-income household is a highly valid indicator of individual-level socioeconomic disadvantage. Because it is administratively verifiable in theory, it is also potentially highly reliable. Prospective students applying for UK government-backed student maintenance loans are currently required to declare the incomes of those living in their household with information supplied being checked against HMRC records – information that could be utilised for widening access purposes. Alternatively, as with applicants to the Foundation Year programme at Lady Margaret Hall, Oxford, verified information on household income could be supplied via an Annual Tax Summary from HMRC (UK tax office) which lists taxable income from all sources not just employment (Fisher and Begbie Citation2019). For individuals whose parents are separated or divorced, HMRC data could in theory be obtained for both parents rather than solely for the main care giver. By virtue of its likely low rates of false positives from both a validity and reliability perspective, being from a low-income household, like FSM, is highly suitable for use as widening access indicators (likely corresponding to Panel A2 in ).
Being from a lower social class background is also a potentially valid indicator of individual socioeconomic disadvantage. However, because this indicator is based on self-reported information that is not readily verifiable, its reliability may be low if young people do not know exactly what jobs their parents hold and so provide inaccurate information or no information. If false information about parental occupation is given in order to appear to qualify for a widening access initiative, this will contribute to false positives. Even where accurate parental occupation data is provided this may be difficult to code to NS-SEC. All of these complications will contribute to at least some false positives and false negatives (akin to Panel B2). Because of reliability concerns the Higher Education Statistics Agency for the UK discontinued its use of parental social class as a widening access performance measure in 2017 (Pollard et al. Citation2013: 19). There are ways to improve the reliability of parental social class data. For example, the Foundation Year programme at Lady Margaret Hall, Oxford, currently uses parental occupation to select applicants, verifying this data by requesting a letters of confirmation from employers, and encouraging probity by requiring applicants to sign a declaration which commits them to covering the full cost of the free Foundation Year if they are found to have provided false information (Fisher and Begbie Citation2019). However, it is unclear whether this approach is feasible at scale. As such, in the current absence of an efficient and robust means of verifying self-reported social class background information, this indicator is not currently suitable for use as a widening access indicator.
Being among the first generation of family members to go to university is likely to be a somewhat less valid indicator of individual socioeconomic disadvantage than social class background because most people do not have graduate parents. Indeed, cohort data for England indicates that this is the case for eighty percent of all young people and more than two-thirds of all recent university graduates (Henderson, Shure, and Adamecz-Volgyi Citation2020; Adamecz-Volgyi, Henderson, and Shure Citation2020). As such, this category will include many socioeconomically advantaged individuals as well as disadvantaged ones, and so can be expected to produce many false positives (akin to Panel C1). Moreover, information about parental education is necessarily based on self-reports which are not readily verifiable and so may be unreliable; a concern that could perhaps be remedied by stipulating a penalty for providing false information. Nevertheless, verifying the claim that a person’s parents are not graduates is harder than verifying the claim that parents are employed in non-professional/managerial occupations since it is not possible to prove a negative (i.e. the absence of a degree). As such, on both validity and reliability grounds, being in the first generation of family members to go to university is not a suitable widening access indicator, although not being a first generation student might be a useful indicator that an individual is not part of the widening access target group.
Finally, within the set of individual-level indicators, having been in care, a young carer, or a refugee or asylum seeker, all relate to experiences of significant personal adversity and educational disruption during childhood often stemming from and/or resulting in socioeconomic disadvantage. There is clear evidence that having been in care is associated with a lower rate of educational achievement and progression (Harrison Citation2020), and this is likely to be the case also for young carers, refugees and asylum seekers. All three indicators are valid in the sense that they are likely to produce few, if any, false positives. However, since the vast majority of young people have not been in care, been young carers or held refugee or asylum seeker status, these indicators will inevitably yield a very large number of false negatives (e.g. Panel A3). Because it is possible to use administrative records to verify whether or not someone has been in local authority care, this is a highly reliable measure. An individual’s status as a carer for a family member, or as a refugee or asylum seeker is less straightforward to verify, but because of the small numbers involved it could be verified on a case by case basis. However, if some individuals do not disclose their status at least some false negatives will occur. Overall, by virtue of the few false positives these indicators are likely to yield, all three are suitable for use, with living in care currently the easiest to implement.
Area-level indicators
Area-level indicators use home postcodes to capture the average circumstances of individuals or households living in broadly the same locale. These include:
The Participation in Local Areas (POLAR4) metric which ranks areas according to the proportion of residents aged 18–19 who are participating in higher education (HEFCE Citation2017);
The Tracking Underrepresentation by Area (TUNDRA) metric which ranks areas according to the proportion of state-maintained school pupils wo progress to higher education (Office for Students (OfS) Citation2021);
The Index of Multiple Deprivation for England (IMD), Scotland (SIMD), Wales (WIMD) and Northern Ireland (NIMDM) which is a composite measure of deprivation across multiple domains including income, employment, education, health, housing, crime and access to local services (DCLG Citation2015a);
The Index of Deprivation Affecting Children Index (IDACI) which refers to the percentage of children aged under 16 living in families that are income deprived as measured by receipt of income support, income based jobseeker’s allowance or pension credit, or receipt of Child Tax Credit due to having an equivalised income below 60% of the national median before housing benefits and costs (DCLG Citation2015a);
ACORN, a consumer segmentation tool produced commercially by CACI Ltd and used under licence by the UK government Office for National Statistics (CACI Citation2018), which identifies two categories of deprived area, ACORN 4 (‘Financially Stretched’) and ACORN category 5 (‘Urban Adversity’), in which residents are among the most economically and socially deprived nationally with respect to income, qualification levels, skilled employment, unemployment and reliance on social security benefits.
Area-level widening access indicators tend to be popular not only with government but also with higher education providers (Boliver, Crawford, et al. Citation2017). Their appeal is perhaps because they only require residential postcode information, which is readily available for almost all individuals and can be matched consistently to easily accessible area-level data, making area-level measures appear highly reliable.Footnote5 However, area-level indicators are intrinsically of questionable validity as measures of individual socioeconomic disadvantage simply because the average characteristics of those living in the same broad locale may be a poor proxy for the characteristics of a given individual. This is known as the risk of ‘ecological fallacy’, that is, of drawing erroneous inferences about individuals from aggregated data (Harrison and McCaig Citation2015). Correspondingly, because of their limited validity as proxies for the circumstances of individuals, area-level measures can be expected to yield a substantial proportion of false negatives and false positives even when these indicators are deployed reliably (corresponding to somewhere in the region of Panels B2, B3, C2 or C3 in ). Although it would be possible to reduce the number of false positives by increasing the threshold at which an individual would begin to be counted as socioeconomically disadvantaged (e.g. within the two lowest quintiles of the distribution, rather than lowest quintile), this would necessarily come at the expense of an increase in the rate of false negatives (e.g. a shift from B2 to C1 of ).
The validity of POLAR and TUNDRA as measures of socioeconomic disadvantage is especially questionable since these measures concern the higher education participation rate of young people in a given area rather than the local degree of socioeconomic disadvantage. Moreover, the POLAR measure aggregates individuals and households into very large geographical units: the latest version, POLAR4, uses middle-layer super output areas (MSOAs), each containing 7,910 residents on average (ONS Citation2014). Analysis of an earlier version of POLAR found that young participation rates within census wards containing 5,500 residents on average were similar to those for sub-wards containing 1,500 individuals on average (HEFCE Citation2017). Nevertheless, the large geographical units POLAR uses have been shown to yield many false negatives and many false positives when contrasted with individual level measures of disadvantage, particularly in areas that are especially socioeconomically diverse (Harrison and Hatt Citation2010; Harrison and McCaig Citation2015), such as parts of London (Atherton, Boffey, and Kazim Citation2019). Although TUNDRA uses lower-layer super output areas which relate to a smaller number of residents, it too is likely to produce at least some false negatives and to be particularly prone to false positives (e.g. C2 or C3).
IMD, IDACI and ACORN also aggregate information for a large number of people living in the same broad locale, albeit not to the same extent as POLAR, and at least the information being aggregated relates directly to socioeconomic disadvantage. IMD and IDACI aggregate information for approximately 1,500 people per area, while ACORN uses full postcodes as its basic building block which typically relate to a smaller number of households.Footnote6 The documentation accompanying the IMD and IDACI metrics rightly warns that: ‘Within every area there will be individuals who are deprived and individuals who are not. The Index is not a suitable tool for targeting individuals’. (DCLG Citation2015b: 5). In other words, these area-level measures are likely to yield substantial numbers of false negatives and false positives (e.g. somewhere in the region of B2, B3, C2 or C3).
School-level indicators
School-level indicators relate to the characteristics of the school attended by an individual or the average characteristics of pupils who attended the same school. These include:
Attended a state-maintained school or college, rather than a private fee-paying school;
Attended a deprived school as measured by a high percentage of pupils in receipt of free school meals;
Attended a low achievement school as measured by low average levels of academic attainment at key stage 4 and/or key stage 5;
Attended a low progression school as measured by low rates of continuation from lower to upper secondary school and/or from upper secondary school into higher education.
Having attended a state sector school or college rather than a private fee-paying school – though currently a national widening participation performance indicator (HESA Citation2018) – it is not a particularly valid measure of socioeconomic disadvantage. This is because, although it is likely to yield very few false negatives – principally a relatively small number of low-income pupils attending private schools whose fees are covered by bursaries, and a slightly larger number of disadvantaged pupils using small, cheap almost statistically invisible private faith schools – it will produce a large number of false positives – namely that substantial number of advantaged pupils attending ‘good’ comprehensives or grammar schools in the state sector. As such, although school type is an individual-level measure and an officially verifiable piece of information, the high rate of false positives it yields due to its low validity renders it unsuitable for use (akin to Panel C1 in ). That said, having attended a private school could be used to determine ineligibility for a widening access interventions.
The three other school-level indicators listed above are derived from aggregated information about individual pupils attending the same school drawn from official records kept as part of the National Pupil Database (NPD) for England and comparable databases maintained by the devolved UK governments. Because information about the school an individual attended can be easily obtained in most cases, and can be matched consistently to school-level data from officially verified records, school level indicators are highly reliable. Some false negatives may occur where disadvantaged individuals were home-schooled or educated abroad, or where they left school some time ago and so relevant school-level data is unavailable, but the number of false negatives arising for these reasons is likely to be low. However, as with area-level measures, these three school-level indicators are intrinsically of limited validity when it comes to capturing the socioeconomic circumstances of specific individuals. This is especially the case for the last two school-level indicators listed, above since average levels educational attainment and progression are correlates of rather than direct measures of socioeconomic disadvantage. In any case, not all pupils attending schools with a high average level of pupil deprivation, a low rate of academic achievement, or a low rate of educational progression, will be personally disadvantaged, and not all pupils attending other schools will be personally advantaged. Even the indicator relating to the percentage of pupils in receipt of free school meals will inevitably produce at least some false positives and at least some false negatives; previous analysis of data for state school pupils in England found only a modest correlation between the number of years individual pupils had been in receipt of free schools meals and the average for all pupils in the same school (Gorard, Siddiqui, et al. Citation2017). As such, all three indicators are likely to produce a significant number of false positives and false negatives (corresponding at best to Panel B2 of ). It would be possible to reduce the number of false positives by increasing the threshold at which an individual would begin to be counted as socioeconomically disadvantaged, this would necessarily come at the expense of an increase in the rate of false negatives (e.g. a shift from B2 to C1 of ).
An empirical evaluation of widening access metrics
The foregoing suggests that area-level metrics, including the POLAR and TUNDRA measured favoured by the Office for Students, and school-level metrics are unsuitable for use as proxies for individual-level socioeconomic disadvantage, owing principally to the substantial number of false positives each is likely to produce. We demonstrate empirically that this is indeed the case by showing that these measures are only weakly statistically associated with an individual-level indicator that is known to produce only a negligible number of false positives and therefore captures what is an objectively socioeconomically disadvantaged group of individuals, namely those in receipt of free school meals. As already discussed, although not all disadvantaged individuals are FSM recipients, FSM recipients are indisputably disadvantaged, making FSM a highly suitable widening access indicator in its own right and a valuable reference point against which to test the adequacy of other metrics.
Our analysis draws on data from the National Pupil Database relating to all pupils attending state-funded or private free-paying schools in England who were in their final year of KS4 in 2016/17 or 2017/18 (N = 1,138,954).Footnote7 The variables included in the analysis relate to a range of individual-level, school-level and area-level measures currently used to identify disadvantaged young people for the purposes of widening access to higher education. Descriptive statistics for each of these variables are presented in .
Table 1. Descriptive statistics for analytical sample.
Our principal reference point is the individual-level measure which identified pupils in receipt of free school meals (FSM) who can unequivocally be said to be disadvantaged. We make use of two versions of the FSM variable available in the NPD:
(a) FSM vs. Not FSM and (b) Ever FSM vs. Never FSM. The first version of this variable indicates whether the individual was known to be eligible for free school meals during their final year of KS4 at age 15/16 and is based on the original NPD variable: KS4_FSM. The second version captures whether the pupil was known to be eligible for free school meals on any of the annual school census dates over the course of the six years leading up to the end of KS4 (based on KS4_FSM6). It should be noted that FSM data is not available within NPD for those who attended private schools. As such, for the purposes of our analysis we have coded all pupils in private schools at KS4 as Not FSM and Never FSM (a figure not far from the truth – see Henseke et al. Citation2021).
We contrast FSM with a set of area-level measures based on pupils’ home postcodes as reported in NPD at the end of KS4. It is important to note that the NPD lacks data on the home postcodes of pupils attending private schools; as such, each of the following measures refer to state-educated pupils only. It would also appear that the postcode data needed to derive these area level measures is much more likely to be missing at KS5 than at KS4, hence we use KS4 postcode data here.
POLAR4 quintile. This variable relates to the young higher education participation rate in the local area (middle-layer super output area) in which pupils were living at the end of KS4, divided into quintiles where quintile 1 represents those residing in low HE participation neighbourhoods.
TUNDRA quintile. This variable relates to the young higher education participation rate in the local area (lower-layer super output area) in which pupils were living at the end of KS4, divided into quintiles where quintile 1 represents those residing in low HE participation neighbourhoods.
IMD quintile. This variable captures the level of deprivation in the (lower-layer super output) areas where pupils were living at the end of KS4, divided into quintiles with quintile 1 representing the most deprived areas.
IDACI quintile. This variable captures the level of income deprivation affecting children in the (lower-layer super output) areas where pupils were living at the end of KS4, divided into quintiles with quintile 1 representing the most deprived areas.
ACORN category. This variable uses the CACI classification system to divide pupils home postcodes into five types of area each with distinctive sociodemographic characteristics, the two most disadvantaged of which are categories 4 (financially stretched) and 5 (urban adversity).
At the school-level we make use of four measures:
School type at the end of KS4. This variable distinguishes between those who attended state maintained schools and those who attended private fee-paying schools (based on a recoding of KS4_NEWTYPE, and excluding special schools).Footnote8
Percentage of FSM pupils in the school and (b) Percentage of Ever FSM pupils in the school, expressed as quintiles. These measures were derived by the authors using the individual-level variables KS4_FSM and KS4_FSM6 to calculate percentages for each educational establishment in the data. The resulting distribution was divided into quintiles, with an additional category indicating missing data for those attending schools with fewer than ten cases in the dataset. As with the individual-level FSM measures, it has been assumed that those attending private schools at KS4 were Not FSM and Never FSM.
School-average KS4 Attainment 8 score, divided into quintiles. This measure was derived by the authors by averaging across educational establishments individual-level GCSE Attainment 8 scores (KS4_ATT8) smoothed by rounding values to the nearest whole number). The resulting distribution was then divided into quintiles and an additional category created indicating missing data for those attending schools with fewer than ten cases in the dataset. It should be noted that this measure only includes those educated in state schools at KS4, since the GCSE Attainment 8 data in the NPD for privately educated pupils is known to be non-comparable (due to the high prevalence of iGCSE entries among private school pupils and their lack of comparability with ordinary GCSEs within the Attainment 8 framework).
School-average rate of progression from KS4 to KS5, divided into quintiles. This measure was derived by calculating for each KS4 educational establishment the percentage of pupils who had obtained at least some KS5 points two years later, again divided into quintiles with an additional category for cases with missing data.
Two individual-level measures of academic attainment are also included in the analysis:
GCSE Attainment 8 score. This variable measures pupils’ levels of academic achievement at KS4, and is based on a recoding of original variable KS_ATT8 with values rounded to whole integers and top coded at the value of 90. As noted previously, this measure is calculated only for those who attended state-maintained schools.
KS5 points, all qualification types. This variable captures the KS5 points achieved by pupils regardless of qualification type (i.e. includes vocational as well as academic qualifications at KS5), expressed in terms of its equivalence to grades achieved in three A-levels. A further category is included for those who achieved no KS5 qualifications.
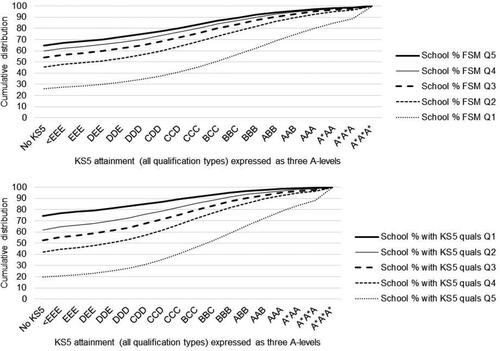
We begin by reporting the bivariate associations between each of the above measures and pupils’ levels of attainment at Key Stage 4 () and Key Stage 5 (). As can be seen, both of the individual-level measures relating to FSM, and all of the area-level and school-level measures, are associated with differing levels of attainment as measured by GCSE Attainment 8 score at Key Stage 4 and by progression to and points achieved in qualifications of all types at Key Stage 5. For example, pupils at the 50th percentile of the distribution for FSM/Ever FSM pupils achieved an Attainment 8 score of 36–38 on average (roughly equivalent to Cs and Ds across 8 GCSEs) compared to a score of 50–51 (roughly equivalent to Bs and Cs across 8 GCSEs) for pupils in the 50th percentile for pupils were Not/Never FSM. Similarly, at Key Stage 5 the highest-performing 10 percent of FSM/Ever FSM pupils had achieved points equivalent to BCC or better at A-level, compared to AAA or better for the highest-performing 10 percent of Not/Never FSM pupils. Because the distributions of key stage 4/5 attainment for FSM and Ever FSM pupils are so similar, and because the latter is a larger group (23.2% compared to 11.3% of all pupils), we focus hereafter on the Ever FSM measure.
Figure 2. Bivariate associations between measures of disadvantage and GCSE Attainment 8 score.

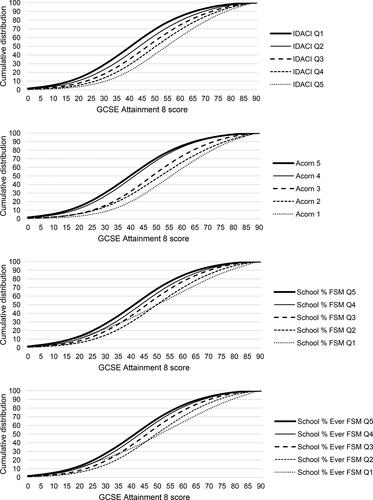
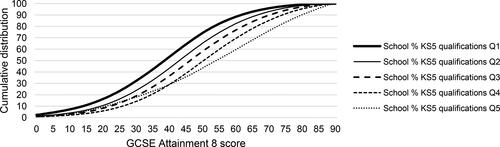
Figure 3. Bivariate associations between measures of disadvantage and KS5 attainment (including non-progression to KS5).
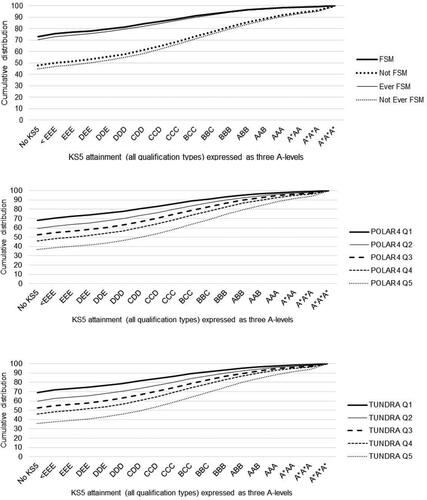
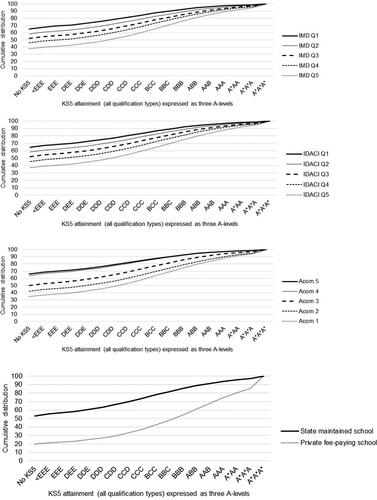
We turn next to explore the bivariate associations between the Ever FSM measure and each of the area-level and school-level measures listed earlier. The key findings are reported in numeric form in , and in graphical form in using the pvenn programme in Stata (Gong and Ostermann Citation2011). Taking Ever FSM as the reference point, it can be seen from that POLAR and TUNDRA are poor proxies for socioeconomic disadvantage at the individual level. Both the POLAR and TUNDRA quintile 1 categories fail to capture a considerable 70 percent of pupils who were Ever FSM (false negatives), and around 60 percent of POLAR and TUNDRA quintile 1 individuals were not Ever FSM (possible false positives). The term ‘possible false positives’ is used to indicate that some individuals in this category will be true positives – that is, disadvantaged individuals who did not claim their FSM entitlement or who are only a little above the threshold for entitlement. However, many are likely to be genuine false positives – that is, individuals erroneously identified as disadvantaged. Taking quintiles 1 and 2 of the POLAR and TUNDRA quintiles together reduces the incidence of false negatives to 50 percent, but simultaneously increases the incidence of possible false positives to 67 percent.
Figure 4. Venn diagrams showing bivariate relationships between Ever FSM and area-level and school-level measures of disadvantage.
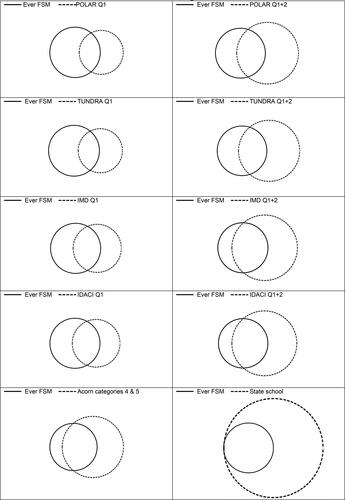
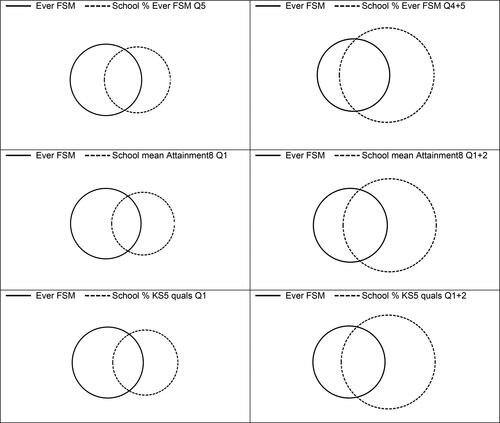
Table 2. Bivariate relationships between Ever FSM and various school-level and area-level measures of disadvantage.
As shown in , the other area-level measures IMD, IDACI and ACORN perform better than POLAR and TUNDRA, most likely because the former are based on aggregated data relating to socioeconomic disadvantage rather than the young HE participation rate. However, it is still the case that both the IMD and IDACI quintile 1 categories fail to capture a considerable 55 percent of pupils who were Ever FSM (false negatives), while around 50 percent of IMD and IDACI quintile 1 individuals were not Ever FSM (possible false positives). Taking quintiles 1 and 2 together reduces the incidence of false negatives to 30 percent, but also increases the incidence of possible false positives to 60 per cent. Of the area-level measures, the Acorn measure performs best with respect to minimising false negatives, failing to capture a comparatively modest (but sizeable nevertheless) 28 percent of Ever FSM individuals. However, the Acorn measure yields a large number of possible false positives, with 57 percent of all those in Acorn categories 4 and 5 not Ever FSM.
Turning next to the school-level measures, the state-school measure performs well with respect to false negatives but poorly with respect to possible false positives – of those who attended a state-maintained school, a considerable 75 were not Ever FSM. Schools with the highest proportions of pupils receiving free schools meals fail to account for some 60 percent of all Ever FSM pupils (false negatives), while around half of all pupils in such schools were not ever FSM (possible false positives). The corresponding figures when disadvantage is defined as attending a quintile 4 or 5 school on this measure are 34 and 61 percent respectively. Finally, schools in the lowest quintile with respect to GCSE Attainment 8 scores and the rates at which pupils subsequently achieve KS5 qualifications fail to capture around 70 of pupils who were Ever FSM (false negatives) while around 63% of pupils in such schools were not Ever FSM (possible false positives). The figures for false negatives decrease to around 45% when the bottom two quintiles are used, while the figures for possible false positives changes only slightly to around 67.
Conclusions
This paper demonstrates that widening access indicators which produce many false positives should not be used to target widening access initiatives or to monitor progress towards more equitable rates of access to university. The use of indicators which identify many individuals as socioeconomically disadvantaged even though they are not, will inevitably result in widening access initiatives being poorly targeted and generate widening access statistics that are highly misleading. In an extreme but plausible scenario, the use of such indicators may even do more harm than good, resulting in a narrowing rather than a widening of access where the ratio of false positives to true positives exceeds the ratio of advantaged to disadvantaged students currently enrolled in higher education. Alarmingly, the results presented in the preceding section of this paper show that many area-level indicators have the potential to create this perverse effect, not least the POLAR and TUNDRA metrics currently favoured by the Office for Students, and including many other area-level and school-level metrics in use across the UK HE sector. This is on top of the harm likely to be caused by these measures owing to their high rates of false positives, which means that many of the intended beneficiaries of widening access initiatives are likely to be overlooked.
The evidence could hardly be clearer that national widening access targets urgently need to be reset using individual-level indicators of socioeconomic disadvantage that are valid as well as reliable, most obviously (Ever) FSM. The urgency of this need to replace POLAR and TUNDRA (or SIMD in the Scottish context) with better indicators should not be underestimated. Many universities recognise that area-level measures are problematic (Boliver and Powell Citation2021) but are effectively compelled to use these metrics in efforts to meet widening access targets as a condition of their continued public funding and, in the case of English providers, their continued permission to charge maximum rate tuition fees. Consequently, much, though thankfully not all, of the widening access work currently being done by UK universities is being targeted using POLAR and other area-level or school-level metrics with a likely less than imagined positive impact on, and potentially harmful consequences for, genuinely wider access.
It is also clear what kinds of indicators are needed in place of area-level and school-level measures: namely individual-level indicators of socioeconomic disadvantage based on information that has or can be officially verified to ensure their validity and reliability. Among the individual-level indicators considered in this paper, being among the first generation of family members to go to university is currently an unsuitable indicator because its limited validity and reliability make it is likely to produce a high rate of false positives. A measure based on parental social class data would be more valid, but some means of verifying self-reports would be needed for this indicator to be sufficiently reliable for use. Having been in care, being a carer, and being a refugee or asylum seeker, are all statuses that are or could be officially verified; and all three are valid indicators of socioeconomic disadvantage, making them potentially suitable to be used to capture the relatively small numbers of individuals who are disadvantaged for these specific reasons. Of these, only living in care is currently practical with verified data available within the National Pupil Database.
Receipt of free school meals and low household income emerge as two highly suitable general indicators of socioeconomic disadvantage. Both are valid indicators of socioeconomic disadvantage and could be captured reliably using data from officially verified records held by government departments – especially Ever FSM which is available within the National Pupil Database and could be brought into use immediately. As already discussed, because not all socioeconomically disadvantaged families are eligible for free school meals and because not all eligible families claim them, this indicator will produce some false negatives. However, this should not prevent receipt of free school meals from being used as a widening access indicator; the few false positives it yields would ensure that widening access initiatives reach only their intended beneficiaries, and that apparent progress on widening access over time is real rather than illusory.
Low household income could be an even better measure than FSM, since the income threshold for counting as socioeconomically disadvantaged for widening access purposes could be set higher than is the case for free school meal eligibility, thus capturing the few false negatives that use of free school meals would produce. Low household income data could also be made available in theory for the purposes of targeting and monitoring widening access efforts, although the lead-in time will necessarily be longer than for free school meals since systems for collating and validating this data nationally would need to be put in place. We cannot rely on self-reports. This data is also more sensitive and so less likely to be given policy approval than a simple threshold measure like FSM that is already linked to welfare benefits.
In summary, it is clear that intrinsically flawed area-level and school-level metrics must be replaced with verified individual-level measures of socioeconomic disadvantage if the ambition to equalise access to higher education within a generation is to be achieved. In the meantime, this goal is unlikely to be achieved and widening access efforts informed by flawed measures may even unwittingly make matters worse.
Data availability
This work was produced using statistical data from ONS. The use of the ONS statistical data in this work does not imply the endorsement of the ONS in relation to the interpretation or analysis of the statistical data. This work uses research datasets which may not exactly reproduce National Statistics aggregates.
Disclosure statement
No potential conflict of interest was reported by the authors.
Additional information
Funding
Notes
1 The Act makes no mention of low participation areas generally or of the POLAR measure specifically.
2 To be clear, our arguments apply specifically to widening access and other interventions that by definition require intentional targeting of a particular sub-population in order to help ‘level the playing field’, such as contextual offers involving reductions in academic entry requirements for those whose prior attainment has been negatively affected by their disadvantaged socioeconomic circumstances. By limited resources we mean, for example, the financial and human resource constraints on an institution’s capacity to do outreach work with schools or to offer prospective students places on pre-entry support programmes.
3 In each Venn diagrams presented in this paper, the two circles are in proportion to their size relative to one another. However the rectangle surrounding the two circles, which delimits the total population at hand, has not been drawn to scale.
4 A recent analysis of linked data from the Longitudinal Study of Young People in England (LSYPE) and the National Pupil Database (NPD) found that only about half of all young people living in low-income households were ever recorded as in receipt of free school meals during their lower secondary school years (Ilie, Sutherland, and Vignoles Citation2017). This finding must be treated with caution, however, since the income data on which it is based is self-reported rather than officially verified and is missing for more than half of all young people in the survey (Siddiqui et al. 2019).
5 It is worth noting that the reliability of post-code based widening access measures could be compromised in the future if socioeconomically advantaged families were to buy or rent homes in low HE participation or deprived areas in order to secure the higher education access advantages accruing to those who live in such areas. This possible future scenario has some precedents, for example, some socioeconomically advantaged families buy or rent homes in particular geographic areas in order to reside within the catchment area of a ‘good school’ (Montacute and Cullinane Citation2018).
6 The commercial nature of ACORN means that its finer details are not publicly documented.
7 Pupils attending special schools are not included in the working sample.
8 Among the privately educated KS4 pupils in our data who went on to obtain KS5 qualifications, approximately 20% switched to state schools for KS5. This suggests that it is important to measure type of school attended at KS4 rather than KS5.
References
- Adamecz-Volgyi, A., M. Henderson, and D. Shure. 2020. “Is ‘First in Family’ a Good Indicator for Widening University Participation?.” Economics of Education Review 78: 102038.
- Atherton, G., R. Boffey, and T. Kazim. 2019. POLAR Opposite: How the Targeting of Learners for Widening Access to HE Work Could Be Improved. London: AccessHE.
- Barkat, S. 2019. “Evaluating the Impact of the Academic Enrichment Programme on Widening Access to Selective Universities: Application of the Theory of Change Framework.” British Educational Research Journal 45 (6): 1160–1185. doi:https://doi.org/10.1002/berj.3556.
- Boliver, V. 2011. “Expansion, Differentiation, and the Persistence of Social Class Inequalities in British Higher Education.” Higher Education 61 (3): 229–242. doi:https://doi.org/10.1007/s10734-010-9374-y.
- Boliver, V. 2015. “Lies, Damned Lies, and Statistics on Widening Access to Russell Group Universities.” Radical Statistics 113: 29–38.
- Boliver, V., C. Crawford, M. Powell, and W. Craige. 2017. Admissions in Context: The Use of Contextual Information by Leading Universities. London: Sutton Trust.
- Boliver, V., S. Gorard, M. Powell, and T. Moreira. 2020. “The Use of Access Thresholds to Widen Participation at Scottish Universities.” Scottish Affairs 29 (1): 82–97. doi:https://doi.org/10.3366/scot.2020.0307.
- Boliver, V., S. Gorard, and N. Siddiqui. 2015. “Will the Use of Contextual Indicators Make UK Higher Education Admissions Fairer?” Education Sciences 5 (4): 306–322. doi:https://doi.org/10.3390/educsci5040306.
- Boliver, V., S. Gorard, and N. Siddiqui. 2017. “How Can we Widen Participation in Higher Education? The Promise of Contextualised Admissions.” In The University as a Critical Institution?, edited by Deem, R. and Eggins, H., 95–110. Rotterdam: Sense Publishers.
- Boliver, V., and M. Powell. 2021. Fair Admission to Universities in England: Improving Policy and Practice. London: Nuffield Foundation.
- CACI. 2018. ACORN Technical Guide. CACI Ltd: London. https://www.caci.co.uk/sites/default/files/resources/Acorn_technical_guide.pdf.
- CoWA. 2016. A Blueprint for Fairness: The Final Report of the Commission on Widening Access. Edinburgh: Scottish Government.
- DCLG. 2015a. The English Indices of Deprivation 2015 – Technical report. Department for Communities and Local Government.
- DCLG. 2015b. The English Index and Multiple Deprivation (IMD) 2015 – Guidance. Department for Communities and Local Government.
- DWP 2018. Households below Average Income: An Analysis of the UK Income Distribution: 1994/95-2016/17. London: Department for Work and Pensions.
- Fisher, E., and J. Begbie. 2019. Using Individual-Level Contextual Indicators to Identify Disadvantaged Applicants: Evidence from the Foundation Year at Lady Margaret Hall, a College of Oxford University. Oxford: University of Oxford.
- Gong, W., and J. Ostermann. 2011. PVENN: Stata Module to Create Proportional Venn Diagram, Statistical Software Components S457368, Boston College Department of Economics.
- Gorard, S. 2012. “Who is Eligible for Free School Meals? Characterising FSM as a Measure of Disadvantage in England.” British Educational Research Journal 38 (6): 1003–1017. doi:https://doi.org/10.1080/01411926.2011.608118.
- Gorard, S., V. Boliver, N. Siddiqui, and P. Banerjee. 2019. “Which Are the Most Suitable Contextual Indicators for Use in Widening Participation to HE?” Research Papers in Education 34 (1): 99–129. doi:https://doi.org/10.1080/02671522.2017.1402083.
- Gorard, S., B. H. See, and N. Siddiqui. 2017. The Trials of Evidence-Based Education. Abingdon, Oxon: Routledge.
- Gorard, S., N. Siddiqui, and V. Boliver. 2017. “An Analysis of School-Based Contextual Indicators for Possible Use in Widening Participation.” Higher Education Studies 7 (2): 79. doi:https://doi.org/10.5539/hes.v7n2p79.
- Harrison, N. 2020. “Patterns of Participation in Higher Education for Care-Experienced Students in England: Why Has There Not Been More Progress?” Studies in Higher Education 45 (9): 1986–2000. doi:https://doi.org/10.1080/03075079.2019.1582014.
- Harrison, N., and S. Hatt. 2010. ““Disadvantaged Learners”: Who Are we Targeting? Understanding the Targeting of Widening Participation Activity in the United Kingdom Using Geo-Demographic Data from Southwest England.” Higher Education Quarterly 64 (1): 65–88. doi:https://doi.org/10.1111/j.1468-2273.2009.00431.x.
- Harrison, N., and C. McCaig. 2015. “An Ecological Fallacy in Higher Education Policy: The Use, Overuse and Misuse of ‘Low Participation Neighbourhoods.” Journal of Further and Higher Education 39 (6): 793–817. doi:https://doi.org/10.1080/0309877X.2013.858681.
- HEFCE. 2017. POLAR4 Classification: A Local Geography Classification for Young Participation in Higher Education. Bristol: HEFCE.
- Henderson, M., D. Shure, and A. Adamecz-Volgyi. 2020. “Moving on up: ‘first in family’ university graduates in England” Oxford Review of Education 46(6): 734–751.
- Henseke, G., J. Anders, F. Green, and M. Henderson. 2021. “Income, Housing Wealth, and Private School Access in Britain.” Education Economics 29 (3): 252–268. doi:https://doi.org/10.1080/09645292.2021.1874878.
- HESA. 2018. Widening Participation Summary: UK Performance Indicators 2016/17. Cheltenham: Higher Education Statistics Agency.
- Higher Education Act. 2017. https://www.legislation.gov.uk/ukpga/2017/29/contents
- Hoare, T., and R. Mann. 2011. The Impact of the Sutton Trust’s Summer Schools on Subsequent Higher Education Participation: A Report to the Sutton Trust. London: Sutton Trust. https://www.suttontrust.com/wp-content/uploads/2012/01/full-summer-school-report-final-draft-1.pdf.
- Hobbs, G., and A. Vignoles. 2010. “Is Children’s Free School Meal ‘Eligibility’ a Good Proxy for Family Income?” British Educational Research Journal 36 (4): 673–690. doi:https://doi.org/10.1080/01411920903083111.
- Ilie, S., A. Sutherland, and A. Vignoles. 2017. “Revisiting Free School Meal Eligibility as a Proxy for Pupil Socio-Economic Deprivation.” British Educational Research Journal 43 (2): 253–274. doi:https://doi.org/10.1002/berj.3260.
- Marginson, S. 2016. “The Worldwide Trend to High Participation Higher Education: Dynamics of Social Stratification in Inclusive Systems.” Higher Education 72 (4): 413–434. doi:https://doi.org/10.1007/s10734-016-0016-x.
- Montacute, R., and C. Cullinane. 2018. “Parent Power.” How Parents Use Financial and Cultural Resources to Boost Their Children’s Chances of Success. London: Sutton Trust.
- Office for Students (OfS). 2021. TUNDRA Methodology. Available at: https://www.officeforstudents.org.uk/media/1bb543b4-776d-4941-8018-dd3c17d62504/tundra-methodology_20210311.pdf
- Office for Students (OfS). 2019. Regulatory Notice 1: Access and Participation Plan Guidance. OfS 2019.05. Bristol: Office for Students.
- ONS. 2014. Population Estimates for the UK, England and Wales, Scotland and Northern Ireland: mid-2013. Statistical Bulletin. London: Office for National Statistics.
- Passy, R., M. Morris, and J. Waldman. 2009. Evaluation of the impact of Aimhigher and widening participation outreach programmes on learner attainment and progression: Interim report. NFER.
- Pollard, E., M. Williams, J. Williams, C. Bertram, J. Buzzeo, E. Drever, J. Griggs, and S. Coutinho. 2013. How should we measure higher education? A fundamental review of the Performance Indicators. Part One: The synthesis report. IES and NatCen.
- Rainford, J. 2021. “Are we Still “Raising Aspirations”? the Complex Relationship between Aspiration and Widening Participation Practices in English Higher Education Institutions.” Educational Review 1–18. doi:https://doi.org/10.1080/00131911.2021.1923461.
- Siddiqui, N., V. Boliver, and S. Gorard. 2019. “Reliability of Longitudinal Social Surveys of Access to Higher Education: The Case of Next Steps in England.” Social Inclusion 7 (1): 80–89. doi:https://doi.org/10.17645/si.v7i1.1631.