
 ?Mathematical formulae have been encoded as MathML and are displayed in this HTML version using MathJax in order to improve their display. Uncheck the box to turn MathJax off. This feature requires Javascript. Click on a formula to zoom.
Abstract
How have public sector austerity and the outsourcing of school provision under the Academies programme affected the state school workforce in England? Existing research claims that teachers are being substituted by cheaper support staff and that schools are becoming increasingly dominated by managers. However, these claims focus on the period before austerity-induced budget cuts and the outsourcing of more than 9,000 schools under the Academies programme. Using nationally comprehensive data sources, analyses reveal that changes under austerity have been drastic, far surpassing those associated with outsourced Academies. Long-term increases in the number of teachers and support staff have gone into reverse, while managerial teams have continued to grow. This research has important implications for our understanding of how marketization and austerity affect state school workforces.
Introduction
Since the 1980s a combination of economic, technological, and political change has transformed public sector workforces around the world (Hermann and Flecker Citation2012). Public sector employees are working longer and harder and the creation of new job roles has shifted established patterns in the division of labour (Felstead et al. Citation2012; Bach and Kessler Citation2011). In education, governments have sought to improve the efficiency and effectiveness of state school workforces through reforms inspired by the private sector (Verger, Fontdevila, and Zancajo Citation2016). These reforms have aimed at encouraging greater innovation and creativity in approaches to improving pupil outcomes by increasing school leaders’ flexibility in the deployment of financial and human resources (Ball Citation2013). Research has shown that these reforms have altered the division of labour in schools: the power of managerial teams has increased and the range of job roles in the workforce has expanded, particularly among non-teaching support staff (Sharma and Salend Citation2016; Hall et al. Citation2015; Blatchford, Russell, and Webster Citation2012; Bach, Kessler, and Heron Citation2006; Gewirtz Citation2002).
However, existing research has frequently focused on case studies in a small number of schools, drawing the representativeness of findings into question (Ainscow and Salokangas Citation2017; Carter and Stevenson Citation2012; Bach, Kessler, and Heron Citation2007). Moreover, much existing research draws on evidence which pre-dates the major political and economic changes that have occurred since the end of the Labour government in 2010. In particular, the consequences of the outsourcing of thousands of state schools under the Academies programme and the imposition of public sector austerity policies for the state school workforce are yet to be adequately assessed. Austerity policies have cut per pupil funding by 8% in real terms since 2010, placing schools under pressure to save money (Belfield et al. Citation2018). As staffing costs account for three-quarters of all school expenditure (Department for Education (DfE) Citation2019), austerity is likely to have had a considerable impact on school workforces.
The Academies programme, a major structural transformation of the English state school system, has greatly expanded since the end of the Labour government in 2010. Academies are privately-run, state-funded schools that now account for 30% of primary and 70% of secondary schools (DfE Citation2018a). Proponents of the Academies programme have sought to free schools from local government administration to allow them to adopt novel organizational and leadership practices to raise performance standards (Adonis Citation2012). While scholars have therefore speculated that workforce practices in Academies differ from non-Academy schools (Stevenson Citation2013), there has been little empirical research of the impact of programme on the school workforce (Bubb et al. Citation2019; Martindale Citation2019; Ainscow and Salokangas Citation2017; Earley et al. Citation2012).
Drawing on nationally comprehensive censuses of employees and pupils in English state schools, this article analyses the impact of austerity and outsourcing on a public sector workforce nearly one million strong. The article brings knowledge of the state school workforce up to date through the analysis of trends since the early 2000s. Contrary to the expectations of researchers who have viewed reforms to the school workforce through the theoretical lenses of Taylorism and workforce degradation (Carter, Stevenson, and Passy Citation2010), findings reveal that less-qualified support staff have not replaced professional teachers or contributed towards a cheapening of the school workforce. As the number of support staff increased rapidly between the early 2000s and the mid-2010s, the number of teachers also increased, substantially raising overall wage costs in state education. Results also reveal that teachers have been progressively and extensively incorporated into managerial hierarchies, further contributing towards higher wage costs. Since the imposition of austerity policies in the 2010s, the proportion of teachers in expensive senior management positions has, counterintuitively, continued to grow. However, the numbers of support staff and classroom teachers per pupil have entered very rapid declines, which will likely have a negative impact on pupils and the workload of the remaining workforce. For the first time, the analysis reveals that schools which have been outsourced under the Academies programme have accelerated the growth of senior managerial teams and cuts to the size of the teacher and teaching assistant workforce.
Growing managerialism
In an era of increasing international comparison of the effectiveness of state education systems, for example in the OECD’s PISA tests, states are seeking to reform their school systems in an attempt to improve their performance (Hall et al. Citation2015; Martens, Rusconi, and Leuze Citation2007). As evidence has consistently pointed towards the role of effective school management as second only in importance to the quality of classroom teaching for pupil outcomes (Day, Gu, and Sammons Citation2016; Earley et al. Citation2012), a major component of reforms to education workforces has been an increase in the prominence and authority of school-level managerial teams (Gewirtz Citation2002; Hall et al. Citation2015). In England, the power of school leaders has been enhanced by the increased use of performance targets, lesson observations, and the analysis of pupil performance data, initiatives that Gewirtz (Citation2002) has dubbed ‘managerialism’. Through this greater supervision of the content and execution of teachers’ tasks, school leaders have sought to align teachers’ efforts with the aim of improving public examination and school inspection results (Mather and Seifert Citation2011).
Researching the impact of workforce reforms in the first decade of the 2000s, Carter and Stevenson (Citation2012) have argued that the English government’s drive to improve school performance has led to an increase not only in the power of school leaders but also a growth in the size of school managerial teams. More managers have been required to carry out the increasing amount of work involved in controlling the workforce. In senior leadership, assistant headteacher positions were introduced in 2000 to complement existing deputy- and headteacher roles. In middle management, a new system of Teaching and Learning Responsibility (TLR) payments was created in 2006. Teachers receive TLRs for taking on additional responsibilities above those of a classroom teacher, for example as head of a subject area or as Key Stage coordinator. Permanent, higher-level TLR-1 and 2 awards involve managerial responsibilities, while this is not necessarily the case for cheaper, fixed-term TLR-3s (introduced in 2013) (DfE Citation2018b).
This ‘creeping managerialism’ (Carter and Stevenson Citation2012, 491) is argued to have had profound consequences for both teacher professionalism and the organization of the labour process in England’s schools. In drawing an increasing number of teachers into managerial positions, these reforms have Taylorized work in schools by concentrating workplace authority with a group of managers who plan and monitor the work of their subordinates, Braverman’s ‘separation of conception from execution’ (Braverman Citation1998, 86; Carter, Stevenson, and Passy Citation2010; Mather and Seifert Citation2011). However, an increase in the size of school managerial teams may not be compatible with the characterization that the school workforce has been Taylorized. According to the tradition of Labour Process analysis within which these suppositions are framed, control over the workforce under Taylorist management is exercised through a small, elite group of managers who design systems to monitor and control the work of their subordinates. Such systems increase control over the workforce but can lead to less need for direct management by other workers (Grint and Nixon Citation2015). Moreover, a large expansion in the number of expensive managerial positions runs counter to a core aim of Taylorist management: the reduction of production costs.
An alternative perspective sees the growth of school managerial teams as a way to cope with growing operational responsibility at school level. As the power of Local Authorities has been rolled back and individual schools have become increasingly responsible for their own governance, the work of senior school leaders has intensified. Even before the outsourcing of school provision under the Academies programme, state-funded schools in England had already been granted substantial operational autonomy from the state (OECD 2010). For Gronn (Citation2002), this process has led to more distributed forms of leadership, in which greater school-level operational responsibilities have been shared among a growing number of senior managers. Thus, school leadership teams have grown not out of a desire for greater control over the workforce, but to cope with the additional responsibilities that come with added school autonomy.
Irrespective of its cause(s), the extent to which managerial hierarchies have penetrated the teaching profession remains an important issue. The proliferation of formal roles of greater or lesser responsibility increases status differentiation among teachers and constitutes a shift from an egalitarian and collegial professionalism to a more hierarchical and managerial one (Evetts Citation2009). Increasing status differentiation may also serve to undermine professional solidarity among teachers by formally distancing those of different occupational grades (Stevenson Citation2013). For example, senior school leaders can join unions which exclude classroom teachers. However, rather than a threat to the teaching profession, increases in the number of managerial roles may be interpreted as enhancing professionalism: teachers increasingly receive recognition and payment for formally codified roles that go beyond traditional classroom responsibilities (Bach and Kessler Citation2011). Moreover, as the quality of school management is known to have a considerable influence on pupil outcomes (Day, Gu, and Sammons Citation2016), enhancing the capacity of managerial teams may be interpreted as an important step towards the improvement of English state school performance.
Despite this interest in changes to public sector professionalism and the rise of managerialism, nationally comprehensive data on school workforces available is yet to be used to assess claims of increasing managerialism in the existing literature. Moreover, falls in funding since the imposition of austerity policies may have led to cutbacks in expensive managerial positions. Indeed, the government has issued guidance to schools on ‘creating a leaner and more effective leadership team’ (Education Funding Agency Citation2016). Having grown at 5% per year in both primary and secondary phases under Labour, school spending was effectively frozen by the Coalition government between 2010 and 2015, when per pupil funding grew by only 3% in primaries and fell by 1% in secondaries (Belfield et al. Citation2018). Since then, per pupil funding has fallen rapidly, by 4% between 2015 and 2017 (Belfield et al. Citation2018). Assessing the extent to which managerial teams may have shrunk in response to austerity is important because of what this may reveal about the spending priorities of senior public sector managers and because of the impact changes may have had on the capacity of schools to improve and on the teaching profession itself.
Substituting teachers
The use of teaching assistants (TAs) to provide additional support to pupils and improve the inclusiveness of schools is increasingly common in state education systems (Giangreco Citation2013; Sharma and Salend Citation2016). In England, the number of TAs and support staff (pupil welfare officers, cover supervisors, administrative staff, technicians and site/facilities staff) grew rapidly from the early 2000s as the government attempted to address teachers’ concerns about rising workloads and related recruitment and retention problems (Bach and Kessler Citation2011; Ball Citation2013). As part of the 2003 Workload Agreement, the government granted funding for 50,000 extra support staff and formally removed twenty-five administrative tasks from teachers’ job roles. The growth in the number of TAs in school workforces has raised debate between researchers who view them as either a complement or a threat to teachers’ professionalism.
Bach et al. (Citation2006) found that teachers in England greatly valued the support they received from TAs and that there was minimal fear that they would encroach on core aspects of teaching, such as leading classes. Similarly, Blatchford, Russell, and Webster (Citation2012) found that teachers believed TAs had helped relieve their workloads, particularly in relation to administrative tasks. However, Carter and Stevenson (Citation2012, 489) have highlighted a ‘deliberately permissive system’ in England’s schools where there has been a clear ‘financial imperative’ to allow cheaper support staff to encroach on teachers’ work and substitute them in the workforce. Drawing on Labour Process Theory, Carter, Stevenson, and Passy (Citation2010) argue that, instead of employing more teachers, the government has sought to encourage school leaders to deploy their workforce more efficiently by reassigning lower value-added tasks (administrative, pastoral and some teaching activities) from teachers to cheaper support staff. The fragmentation and redistribution of teachers’ responsibilities have aimed at ‘dividing the craft’ of teaching and ‘cheapen[ing] its individual parts’ (Braverman 1974/1998, 55–56; Carter, Stevenson, and Passy Citation2010). Such changes in the division of labour represent a loss for teachers of their professional jurisdiction over core pastoral and teaching responsibilities in the shifting competition over occupational territory (Abbott Citation1988; Bach, Kessler, and Heron Citation2007)
The argument that more support staff have been hired instead of teachers to cheapen teaching labour implies that the number of teachers in the English state school workforce has either decreased or, at the very least, not increased relative to the number of pupils. An increase in the number of teachers per pupil would represent an overall increase in the costs of teaching, contrary to the aim of cheapening teaching labour. However, researchers have yet to exploit the wealth of nationally comprehensive data made available by the DfE on the evolution of the structure of the school workforce in England to address the extent to which this is the case. In addition, the existing debate on the role of TAs has focused on the period of New Labour’s remodelling of the workforce in the first decade of the 2000s, when funding for schools was rising. It remains unclear, therefore, whether the growth in the number of TAs has been sustained in a period of public sector austerity during which school spending was first frozen and then cut (Belfield et al. Citation2018).
Examining trends in the structure of school workforces under austerity contributes towards an understanding of how schools have approached spending priorities within their increasingly constrained budgets. Have school leaders prioritized retaining teachers over TAs? Or, if TAs are employed to cheapen the costs of teaching, have TAs been retained over teachers? Assessing the extent to which there have been staffing retrenchments in England’s schools is important both because of the potential negative consequences they have for pupils and because of the likely impact on the workloads of the staff who remain.
Outsourcing schools
Governments around the world are increasingly turning towards private-sector-style organizational practices to improve the performance of their state school systems (Verger, Fontdevila, and Zancajo Citation2016). Such reforms include the use of school league tables, increased parental choice, the deregulation of employment contracts, and the outsourcing of state school provision itself to private providers, as in the case of Charter Schools (US) and Free Schools (Sweden). In England, the major structural transformation of the state school system of the past two decades has the been the outsourcing of school provision under the Academies programme (Elwick Citation2018). Traditionally, Local Authorities (LAs), local government entities, have had responsibility for maintaining state-funded schools in England. Academies operate independently of LAs but are still state funded. The first Academies opened in 2002 and now account for 70% of secondary and 30% of primary schools in England (DfE Citation2018a). A range of individuals and organizations have founded the Academy Trusts that run Academies: entrepreneurs, businesses, religious institutions, schools, universities, charities and parents. Researchers have shown a wide variety of organizational cultures and structures operate within these Academy Trusts: e.g., individual, ‘standalone’ Academies in Single Academy Trusts; loose groupings of Academies in horizontal collaborative partnerships and ‘umbrella trusts’; hierarchical, centralized Multi-Academy Trusts exerting more or less tight control over their Academies (Greany and Higham Citation2018; Ainscow and Salokangas Citation2017).
The Academies programme aims to drive up pupil performance by intensifying competitive pressures between schools while freeing them to adopt novel organizational and leadership practices from outside the state sector (Adonis Citation2012; Greany and Higham Citation2018). The earlier introduction of quasi-market reforms to state education, such as school examination league tables and Ofsted inspection ratings, also aimed at encouraging school leaders to concentrate their resources on improving school performance through the intensification of competitive pressures (DfE Citation2016; Department for Education and Skills Citation2005). Researchers have argued that that these marketizing reforms have driven the trends identified above: the substitution of teachers by support staff and the growth of managerialism (Ball Citation2013; Stevenson Citation2013; Gewirtz Citation2002). Given that the Academies programme is itself a marketizing reform aimed at increasing competitive pressures, the outsourcing of schools under the Academies programme represents a most-likely case for those who believe that the school workforce is being restructured in this way. Indeed, supporters of the programme regard Academies’ exemption from national agreements on pay and working conditions and their freedom employ innovative leadership and staffing practices as fundamental to their role in transforming the English state education system, which they believe has been held back by restrictive employment and organizational practices (DfE Citation2016; Sturdy and Freedman Citation2007).
The organization of the workforce in Academies was therefore intended to diverge from established practices in LA maintained schools, but researchers have yet to devote adequate empirical attention to whether Academies have taken advantage of their greater autonomy to do so. For the year 2011-12, Earley and colleagues (Citation2012) have shown that school leadership teams were larger in Academies than in LA maintained schools. Using data from 2015-16, Bubb and colleagues (Citation2019) have shown that leadership teams were larger in secondary Academies than secondary LA maintained schools, but that the reverse held for primary schools. While these studies help to shed some light on the impact of the outsourcing of England’s schools, they do not attempt to assess whether differences between Academies and LA maintained schools are statistically significant. Nor do they control for the simultaneous influence of contextual factors, such as school size, location, poverty, or ethnic diversity, which affect school funding and, consequently, school workforces. Moreover, the cross-sectional nature of these studies means that they cannot address how workforces in schools change after being outsourced. This suggests the need for longitudinal and multivariate analysis of school workforces. Such longitudinal, multivariate research has previously shown that leaders in some Academies are taking advantage of their additional freedoms to make significant changes to their workforces, by increasing the proportion of teachers without formal teaching qualifications (Martindale Citation2019). As more and more schools convert to Academy status and systems of outsourced state schools expand around the world, it is increasingly important to investigate to what extent their workforces diverge from traditional state schools.
Data and analyses
Analyses draw on data from the Schools, Pupils and their Characteristics and the School Workforce in England annual censuses from the DfE. For all years since 2002-03 to 2018-19, the DfE has publicly released nationally aggregated and school-level data from the pupil census. The workforce census has been carried out in every November since 2010, when it replaced more disparate workforce data collection exercises. School-level workforce data are therefore only available since November 2010. For the years prior to the collection of the workforce census, nationally aggregated data on the school workforce is available from tables released with the post-2010 censuses. The analysis below is divided into two sections. The first investigates long-term trends in the structure of the school workforce in England using nationally aggregated data (2002-03 to 2018-19). The second analysis uses school-level data to assess the impact of outsourcing schools under the Academies programme on the school workforce (2010-11 to 2016-2017). In addition, the results of the second analysis allow for the assessment of workforce trends that are disaggregated by pupil demographics and location.
The school workforce in England
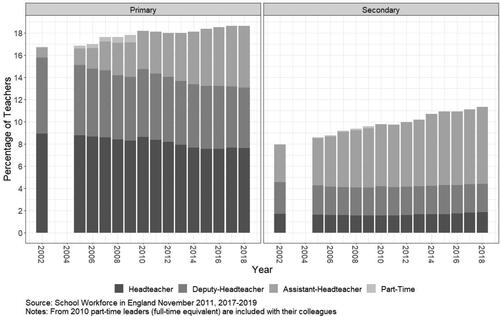
To calculate the percentage of teachers in senior managerial positions the number of teachers in assistant-, deputy- or headteachers positions (full-time equivalent) was divided by the total number of teachers (full-time equivalent). reveals that the percentage of teachers in senior management increased steadily between 2002-03 and 2018-19, from 17% to 19% in primaries and 8% to 11% in secondaries. Increases have continued in the period after 2015 when austerity policies have led to significant budget cuts. Assistant-headteachers are driving the growth: from 1% to 6% of teachers in primaries and from 3% to 7% in secondaries. While the percentage of teachers who are senior leaders has increased, the size of the school workforce has also grown. The proportion of managers in the whole school workforce may therefore not have increased as substantially as within the teaching profession itself. It is difficult to assess the proportion of the total school workforce in senior managerial positions because data on the number of non-teacher managers such as a bursars and business managers is not available from the School Workforce in England census. Nevertheless, it is possible to calculate that the number of teachers in leadership as a percentage of the total workforce fell by 2 percentage points in primaries between 2002-03 and 2018-19 and rose slightly (1 percentage point) in secondaries.
Figure 1. Types of leader as a percentage of all teachers (2002-03 to 2018-19).
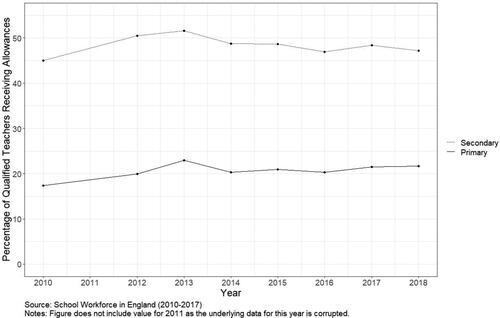
shows that the percentage of full-time, qualified teachers receiving middle-management TLR payments was large between 2010-11 and 2014-15, particularly in secondary schools. In primary schools in 2014-15, 19% of full-time qualified teachers in LA maintained schools and 18% in Academies received TLRs. In secondaries, 43% in LA maintained and 38% in Academies received the payments. There have been falls in the percentage of teachers receiving either TLR-1 or 2 payments only. These declines are offset by the increase in the percentage of teachers receiving ‘TLR-3 and Other’ payments, which include fixed-term TLR-3s, combinations of TLR-1 or 2 with TLR-3 and smaller payments. As TLR data are unavailable after 2014-15, to assess whether austerity has affected the proportion of teachers receiving the payments, shows the school-level data on ‘allowance’ payments (2010-11 to 2018-19). Allowances mainly include TLRs (70%) but also Special Educational Needs (SEN) and recruitment and retention payments.Footnote1 In primaries, the percentage of qualified teachers receiving allowances has been stable during the period since 2015-16 when budget cuts have affected primaries. In secondaries, there has been a slight decline of 3 percentage points since a peak in 2013-14, which may reflect that fact that spending per pupil has been falling in secondaries for longer (Belfield et al. Citation2018).
Figure 2. Percentage of full-time, qualified classroom teachers receiving managerial payments (2010-11 to 2014-15).
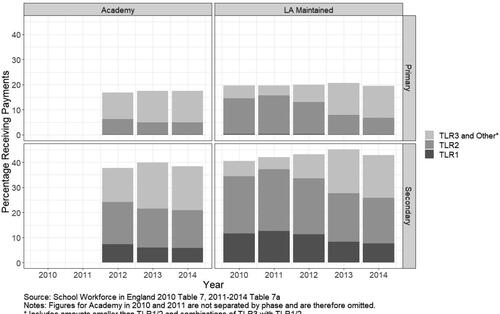
Figure 3. Percentage of qualified teachers receiving allowances (2010-11 to 2018-19).
To calculate teacher- and TA-to-pupil ratios the total numbers of teachers and TAs (full-time equivalent) in November workforce censuses were divided by the total number of pupils (full-time equivalent) in the pupil census of the same academic year, carried out each January. reveals that there was long-term growth in the number of TAs and other support staff per pupil in both primary and secondary phases between 2000-01 and the mid-2010s. However, the number of teachers per pupil also grew between 2000-01 and the mid-2010s, though primary growth plateaued around 2008-09. Increasing and stable teacher-to-pupil ratios run counter to the claim that TAs and other support staff were replacing teachers in the school workforce in this period. Rather increases in TAs and support staff have been additional to the state school workforce, substantially increasing its size relative to the pupil population. Staffing costs have therefore increased dramatically. Spending on teachers and support staff increased by 17% and 138% respectively between 2002 and 2016 (DfE Citation2018c).
Figure 4. Numbers of types of worker per 100 pupils (2000-01 to 2018-19).
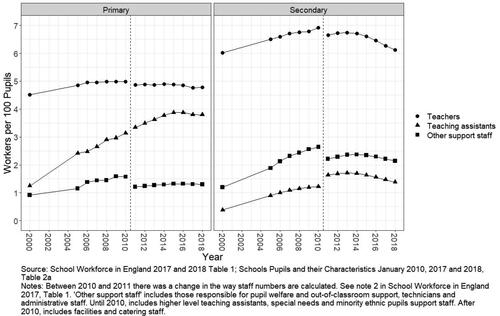
Increases in the primary teacher- and TA-to-pupil ratios since the early 2000s were due to increases in the primary pupil population being more than matched by increases in teachers and TAs. However, since the onset of budget cuts to primary schools in 2015-16, small increases in the number of teachers (2100) and TAs (2100) have not kept pace with the increase in the number of pupils (150,000). Teacher- and TA-to-pupil ratios have therefore declined in primaries. There were 5100 fewer teachers and 3500 fewer TAs in primary schools in 2018-19 than if the teacher- and TA-to-pupil ratios had remained at their 2015-16 levels.Footnote2 This equates to around one fewer teacher per three primary schools and one fewer TA per five primary schools. Changes have been more drastic in secondaries. Between 2015-16 and 2018-19, the pupil population increased by 107,000 but the number of teachers and TAs declined by 7200 and 6400, respectively. These declines equate to 16,100 fewer teachers and 8600 fewer TAs than if ratios to pupils had remained at their 2015-16 levels. This is the equivalent of each secondary school losing nearly five teachers and two and a half TAs.
Academies (2010-11 to 2016-17)
Since 2010 the DfE has publicly released school-level data from the School Workforce in England and Schools, Pupils and their Characteristics censuses. The period 2010-11 to 2016-17 saw a very rapid expansion of the Academies programme: from 0% of primary schools in 2010 to 20% in 2016 and from 6% to 65% of secondary schools (DfE Citation2018a). The analysis uses this data to assess whether the workforce in schools that became Academies diverges significantly from those that continued to be maintained by LAs. The analysis therefore includes schools that were recorded as LA maintained in 2010-11 and then as either LA maintained or Academies in 2016-17 (18,500 schools). Academies are linked with their predecessor LA maintained schools using the Open Academies dataset.
Model 1 below takes as its unit of observation the individual school, i, clustered by LA, j. The model is estimated separately for primary and secondary schools on three dependent variables measured in 2016-17: (i) the percentage of teachers on the leadership pay range: assistant-, deputy-, and headteachers (including executive headteachers at the school which holds their contract); (ii) the number of teachers per hundred pupils; and (iii) the number of TAs per hundred pupils. Descriptive statistics for the dependent variables can be found in .
(1)
(1)
Table 1. Descriptive statistics for workforce dependent variables.
The extent of any divergence between Academies and LA maintained schools is captured jointly by the variables Academyij and Academy_Yearsij. Academyij is a dummy variable for whether a school has become an Academy by 2016-17. Its coefficient captures a one-off association between schools that become an Academies by 2016-17 and the dependent variables. Academy_Yearsij is the number of years for which a school reports as an Academy between 2010-11 and 2016-17. Its coefficient captures the association between how long a school has been open as an Academy and the dependent variables. As these two variables are highly correlated (primaries: r = 0.88; secondaries: r = 0.90), their joint significance will be tested when attempting to assess whether Academies diverge significantly from LA maintained schools.
Apparent differences between the workforces of Academies and LA maintained schools may be the result of contextual differences between the two types of school. The Academies programme originally aimed at improving educational standards for pupils in deprived, often ethnically diverse, urban areas where school performance was below expected standards (Adonis Citation2012). Schools in these areas have tended to receive more funding per pupil than those in wealthier, more rural areas (Belfield et al. Citation2018). This may have differentially influenced Academies’ capacity to hire teachers, support staff and senior managers. A range of variables, are therefore included in the model to control for the potential effects of school contexts. All control variables are measured in the earliest year for which school-level data are available 2010-11. The model therefore seeks to explain the change in the number of teachers, TAs, and leaders in a school’s workforce between 2010-11 and 2016-17 as a combination of its baseline characteristics in 2010-11, whether the school went on to become an Academy and, if so, for how many years it was an Academy. Taking the earliest available year for the baseline maximizes the number of schools and years for which the impact of Academization may be observed.
Controls are included for the percentage of pupils receiving free school meals (a measure of poverty) and the percentage speaking English as an additional language (a measure of ethnic diversity), which affect the level of funding schools receive. Funding has been cut more severely for pupils in sixth forms. Models for secondary schools therefore include a control for the percentage of pupils aged over 16. When estimating the model for the percentage of teachers in leadership positions, a control is also included for the total number of pupils in the school, which directly affects school funding. In models for teachers and TAs per pupil the number of pupils is already taken into account in the denominators of the dependent variables. As a school’s performance is likely related to changes in its staffing structure, controls for Ofsted rating are included in the model. To control for differing labour market conditions due to location, models include Office for National Statistics rural/urban classifiers to control for the rural/urban nature of the constituency in which schools are located. A control for the dependent variable in the baseline year, is included because the number of leaders, teachers and TAs in a school in 2016-17 is likely to depend on the number in 2010-11. Finally, as the amount of funding that schools receive depends on the varying formulae used by England’s 152 Local Authorities, random effects at LA-level,
are included, which also control for unobserved effects due to location not captured by other variables.
and plot the combined estimated effects of Academyij and Academy_Yearsij on the three dependent variables. Full results are reported in . reveals that primary schools that became Academies have reduced the number of teachers per pupil relative to those that remained LA maintained (χ2 = 19.5; p < 0.001). However, the association for secondary Academies is not statistically significant (χ2 = 4.2; p = 0.121). The estimated divergence for primary Academies implies 700 fewer teachers than if these schools had remained LA maintained, or one teacher per five Academies.Footnote3 also reveals that primary and secondary Academies have reduced the number TAs per pupil relative to LA maintained schools and that the longer a school has been an Academy the greater the reduction (primaries: χ2 = 49.9; p < 0.001; secondaries: χ2 = 26.5; p < 0.001). Over an average of 3.2 years as an Academy, a primary school has 0.16 fewer TAs per hundred pupils. This substantively equates to 1300 fewer TAs in primary Academies than if they had remained LA maintained, or 0.4 fewer TAs per Academy. The estimated divergence in secondaries is much greater. A decrease of 0.14 TAs per hundred pupils in 4.8 years equating to an overall loss of 2400 TAs, or one and a half TAs per Academy.
Figure 5. Estimated divergence of academies from LA maintained schools in the number of TAs and teachers per pupil (with 95% confidence intervals).
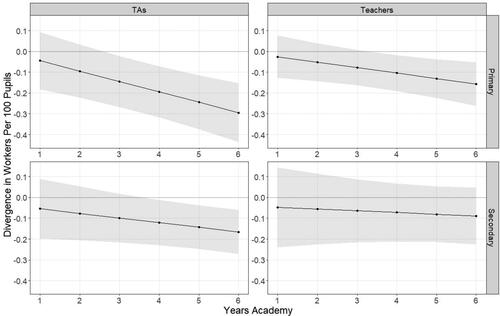
Figure 6. Estimated divergence of academies from LA maintained schools in the percentage of teachers in leadership positions (with 95% confidence intervals).
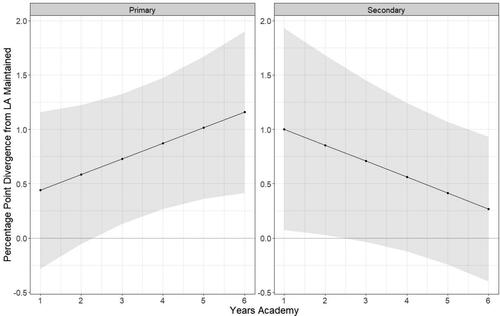
Table 2. Determinants of workforce characteristics in primary and secondary state schools in 2016.
In both primaries and secondaries, also reveals small but statistically significant increases in the number of teachers and TAs per pupil for schools with higher percentages of pupils receiving Free School Meals (FSM). For example, a primary school with 33 percentage points more pupils eligible for FSM is predicted to have one additional TA per hundred pupils (33 * 0.033) than an otherwise identical school by 2016. These increases are likely the result of the Pupil Premium funding which has followed pupils taking FSM since 2011. However, there are no significant differences for primaries based on the percentage of pupils speaking English as an Additional Language (EAL) and only negligible differences for secondaries. Geographically, the number of TAs and teachers per pupils in schools in more urban areas have declined modestly relative to rural schools. For example, between 2010 and 2016, there was a decrease of 0.34 teachers per hundred pupils in primaries in urban areas with major conurbations relative to identical schools in mainly rural settings.
shows that both primary and secondary schools that became Academies are associated with increases in the percentage of teachers in leadership positions relative to schools that remained LA maintained. Wald chi-squared tests for the joint significance of the coefficients on Academyij and Academy_Yearsij reveal that these relationships are statistically significant (primaries: χ2 = 25.2; p < 0.001; secondaries: χ2 = 9.8; p = 0.008). Among primaries, schools that have been Academies for longer have larger divergences. For secondaries, however, results suggest that on becoming an Academy the percentage of leaders in a school increases, but gradually returns to a level similar to that of consistently LA maintained schools. In both phases, the divergences are small. By 2016, the average primary Academy had been so for 3.2 years, implying an increase of 0.8 percentage points in teachers in leadership. This substantively equates to 300 more senior leaders in primary Academies by 2016 than if they had remained LA maintained, or one leader per ten primary Academies. The average secondary Academy had been so for 4.8 years by 2016, implying a 0.4 percentage point increase in teachers in leadership. This equates to 500 more senior leaders associated with secondary Academies, or one leader per three Academies. Results for Academies reported here (and above) are robust to alternative analyses which take baseline years later than 2010. Results are also robust to models which attempt to more strictly control for potential selection biases introduced by unobserved differences between schools that become Academies and those that remain LA maintained (Appendix).
There is little evidence for divergence in the percentage of teachers in leadership between schools in urban and rural settings over the period 2010–2016. However, there were contrasting changes in primaries and secondaries based on pupil characteristics. In primaries, higher percentages of EAL pupils are associated with increases in teachers in leadership, while the reverse holds in secondaries. In primaries, higher percentages of pupils eligible for FSM are associated with declines in teachers in leadership, while the reverse holds in secondaries. It is unclear why the phases have taken contrasting paths, but in neither case is the impact substantial. In the most substantial estimated association (secondary, FSM), a secondary school with 21 percentage points more pupils eligible for FSM has increased the percentage of teachers in leadership by 1 percentage point (21 * 0.048) between 2010 and 2016 relative to an otherwise identical school.
Discussion and conclusions
There has been a long-term growth in the number of TAs and other support staff in the school workforce in England, despite more recent reductions under austerity. The work of state school education has therefore become more distributed among non-teacher workers. However, it is unlikely that this has simply been a case of ‘dividing the craft’ of teaching or ‘cheapen[ing] its individual parts’ as has been claimed by advocates of Labour Process Theory (Carter, Stevenson, and Passy Citation2010, 141). As the number of teachers per pupil grew alongside the number of TAs and support staff, teachers have not been replaced in the school workforce and, therefore, a cheapening of the workforce has not been achieved. Instead, inflation-adjusted, per pupil spending on teachers and support staff increased substantially, by 17% and 138%, respectively, between 2002 and 2016 (DfE Citation2018c). The simultaneous growth in the numbers of these workers implies that changes to the workforce have enhanced the operational capacity of schools rather than simply dividing pre-existing tasks (Blatchford, Russell, and Webster Citation2012).
Evidence has revealed that teaching is a very managerial profession. A large percentage of teachers receive middle-management TLR payments and there has been a long-term increase in the percentage of teachers in senior leadership positions, driven by the growth of assistant-headteacher roles. The proliferation of managerial roles of different status is moving the teaching profession away from an egalitarian and collegial structure to one based on formal, hierarchical authority (Evetts Citation2009). Nevertheless, this development may also be considered an enhancement of the profession as a growing proportion of teachers are receiving formal recognition and additional pay for assuming responsibilities that go beyond those of the traditional classroom teacher (Bach and Kessler Citation2011). While the number of managers has grown, the size of the school workforce has also increased. The proportion of managers in the whole school workforce has therefore changed less dramatically than within the teaching profession itself, which had been overlooked in previous discussions of growing managerialism in schools (Gewirtz Citation2002; Ozga Citation2008). This is not to suggest that managerialist practices such as performance appraisals and lesson observations have not become more common (Clapham, Vickers, and Eldridge Citation2016; Mather and Seifert Citation2011), only that limited changes to the proportion of managers fit poorly with the idea of managerial responsibility deepening into the school workforce.
Schools have, nevertheless, become more stratified by occupational status: more teachers are occupying an increasingly differentiated range of managerial positions in a workforce with a growing number of non-teacher staff. This proliferation of roles of differing status and contractual conditions may serve to undermine collective solidarity among education workers (Stevenson Citation2013), particularly because of the existence of unions catering exclusively for senior school managers. However, this changing landscape has already led to changes in the way school unions are organizing the workforce. Since its formation via the amalgamation of the largest and third largest school unions in 2017, the National Education Union has welcomed non-teacher school workers as members, a key change in policy from its main predecessor, the National Union of Teachers. While increasing stratification may also be argued to resemble the fragmentation of labour processes associated with Taylorism, this has been achieved through substantial increases in both the size of the workforce and the costs per unit: more managers, more teachers, and more TAs.
For the first time, results have shown that outsourced Academy schools have increased the percentage of teachers in senior leadership and reduced the numbers of teachers and TAs per pupil in their workforces relative to non-outsourced schools. That differences between Academies and LA maintained schools remained after controlling for a range of factors associated with the structure of school workforces suggests that raw differences in the size of Academy and LA maintained managerial teams found in previous research (Bubb et al. Citation2019; Earley et al. Citation2012) cannot simply be accounted for by contextual differences between the two types of school. Differences between Academies and LA maintained schools were, nevertheless, small. There was one fewer teacher per five primary Academies, two fewer TAs per five primary Academies, and one and half fewer TAs per secondary Academy. Such declines in the number of TAs may reflect the greater recognition in Academies of concerns that TAs have often contributed towards the poorer performance of the pupils they support (Blatchford, Russell, and Webster Citation2012; Webster and Blatchford Citation2013). Increases in the numbers of senior leaders were substantively equivalent to one leader per three secondary Academies and per ten primary Academies. Such increases may only have been modest because many of the functions Academies take over from LAs are carried out by the staff of centralized (i.e. supra-school level) Multi-Academy Trusts or school-level administrators, a subject requiring further research. Moreover, it cannot be ruled out that overall change to the workforce has been modest due to the stringencies imposed by frozen and, latterly, declining budgets.
While findings for Academies are consistent with the expectation that outsourcing school provision would lead to greater managerialism and a redistribution of resources towards the upper end of the school hierarchy (Stevenson Citation2013), they may be better understood as evidence that Academy senior managerial teams have not prioritized the restructuring of their workforces as part of their efforts to improve the performance of their schools. These results are in line with previous research which has found only moderate changes to staffing levels in public sector services following outsourcing and privatization (Hermann and Flecker Citation2012; Martindale Citation2019). Indeed, results lend support to the theory that substantial change is unlikely in labour intensive industries which are less amenable to productivity increases through technological modernisation (Hermann and Flecker Citation2012).
Since the imposition of budget cuts under austerity, falls in the number of teachers and TAs per pupil have been much more drastic than those associated with the outsourcing of schools. There were 21,000 fewer teachers and 12,000 fewer TAs in the school workforce in 2018-19 than if the ratios of these workers to pupils had remained at their 2015-16 levels. While in primaries this equates to only one teacher fewer per three schools and one TA fewer per five schools, these reductions were achieved in only three years. In secondaries, the reductions have been much starker: five fewer teachers per school and two and a half fewer TAs. Austerity-induced reductions in the numbers of teachers per pupil are significant because, consequently, class sizes will have increased. The much faster decline in teacher- than TA-to-pupil ratios in both phases is evidence that school leaders have prioritized retaining TAs over more expensive teachers. This runs counter to the expectations of researchers who argued that, in the event of a deterioration in public finances, school leaders would have to reduce the number of TAs in their workforces to focus on fulfilling their statutory requirement to provide a teacher to lead each class (Bach, Kessler, and Heron Citation2006). Indeed, this development may represent a belated vindication of the view derived from Labour Process Theory that teachers are being substituted in the school workforce by cheaper, less qualified TAs (Carter and Stevenson Citation2012).
While the number of TAs and teachers per pupil has fallen, as might be expected as schools seek to save money from shrinking budgets, the percentage of teachers in senior leadership has, puzzlingly, continued to grow. The remaining teachers in the school workforce are therefore relatively more expensive. What can explain this tendency? In primaries, assistant-headteachers have at least partially supplanted more expensive deputy-headteachers, which may have made primary senior leadership teams less expensive. However, in secondaries, assistant-headteachers have been additional, raising costs. The continued growth could be a result of the imbalance of power between classroom teachers and senior leaders, who are more able to shape decisions on staffing or could reflect the continued priority given to managerially oriented reforms: more teachers as managers, despite the cost. Or, does the retaining of managers imply that, as LAs have been rolled back and schools have become more autonomous, schools have continued to need larger, distributed leadership teams to deal with their additional responsibilities (Gronn Citation2002)?
Overall, despite increases in the number of managers in the teaching workforce, pre-austerity trends were not very consistent with expectations from LPT. There was no evidence of teacher substitution and overall workforce costs increased substantially. Though the creation of TLRs 1 and 2 may have originally deepened managerial responsibility into the teaching profession, their increasing substitution by fixed-term TLR 3 s, which do not include managerial responsibility, revealed a countervailing trend. Nor was evidence from the most-likely case of outsourcing under the Academies programme supportive of expectations from LPT: greater presence of teachers relative to TAs and only very limited increases in managers. While trends since the imposition of austerity are more consistent with LPT - faster declines in teachers than TAs, the retention of managers – this reveals that changes to the workforce are far more political and contingent, and less straightforwardly the consequences of capitalism, than advocates of LPT have sometimes allowed for (Reid Citation2003). Therefore, increasing numbers of managers in the teaching profession since the early 2000s and their retention under austerity (despite their relative costliness) may be better understood as attempts to distribute the management of the additional responsibilities that successive governments have devolved to schools (Gronn Citation2002). The need to cope with additional responsibilities is consistent with the costly, pre-austerity increases in the numbers of both teachers and TAs that LPT struggled to account for. Such an approach is also consistent with modest increases in the size of leadership teams in Academies, which take over additional responsibilities from LAs.
This article has provided the first combined assessment of the impact of outsourcing and austerity on the school workforce in England. Findings contribute new evidence to growing international debates on the effects of economic crisis on public and private sector workforces (Bach Citation2016; Slater Citation2015) and the transformation of employment relations through the marketization of public services (Elwick Citation2018; Stahl Citation2017; Bach Citation2002). This is particularly important in an era of intense international policy cross-fertilization in state education (Gunter et al. Citation2016; Verger, Fontdevila, and Zancajo Citation2016; Lange and Alexiadou Citation2010). These findings are significant not only because of the evidence they bring to bear on the adequacy of theoretical orientations promoted in existing research to explain changes to the public sector workforce, but also because of the substantive impact the processes revealed here have had on the lives of the nearly one million employees in the state school system in England.
Disclosure statement
No potential conflict of interest was reported by the authors.
Notes
1 For breakdowns of allowance payments see School Workforce in England Table 7 (November 2010) and Table 7a (November 2011, 2012, 2013, 2014).
2 The numbers of teachers and TAs fewer in 2017 relative to if teacher- and TA-to-pupil ratios remained at 2015-16 levels are calculated by (i) multiplying the 2015-16 teacher- and TA-to-pupil ratios by the number of pupils in 2018-19 to give the number of teachers and TAs in 2018-19 if the ratios of these workers had remained at 2015-16 levels, (ii) calculating the difference between these numbers and the actual 2018-19 numbers of teachers and TAs. Figures per school divide these differences by the number of schools.
3 Estimates of the number of TAs and teachers fewer due to Academization are calculated by adding the Academyij coefficient to the Academy_Yearsij coefficient multiplied by the mean number of years Academies report as Academies and then multiplying the result by the total number of pupils in the Academies in the model in 2016-17.
Estimates of the number of additional leaders due to Academization are calculated by adding the Academyij coefficient to the Academy_Yearsij coefficient multiplied by the mean number of years Academies report as Academies, then dividing this by 100 and multiplying the result by the total number of teachers in the Academies in the model in 2016-17.
References
- Abbott, A. D. 1988. The System of Professions: An Essay on the Division of Expert Labor. Chicago; London: University of Chicago Press.
- Adonis, A. 2012. Education, Education, Education: reforming England’s Schools. London: Biteback.
- Ainscow, M., and M. Salokangas. 2017. Inside the Autonomous School: Making Sense of a Global Educational Trend. London: Routledge.
- Bach, S. 2002. “Public-Sector Employment Relations Reform under Labour: Muddling through on Modernization?” British Journal of Industrial Relations 40 (2): 319–339. doi:https://doi.org/10.1111/1467-8543.00235.
- Bach, S. 2016. “Deprivileging the Public Sector Workforce: Austerity, Fragmentation and Service Withdrawal in Britain.” The Economic and Labour Relations Review 27 (1): 11–28. doi:https://doi.org/10.1177/1035304615627950.
- Bach, S., and I. Kessler. 2011. The Modernisation of the Public Services and Employee Relations: Targeted Change. London: Macmillan International Higher Education.
- Bach, S., I. Kessler, and P. Heron. 2006. “Changing Job Boundaries and Workforce Reform: The Case of Teaching Assistants.” Industrial Relations Journal 37 (1): 2–21. doi:https://doi.org/10.1111/j.1468-2338.2006.00387.x.
- Bach, S., I. Kessler, and P. Heron. 2007. “The Consequences of Assistant Roles in the Public Services: Degradation or Empowerment?” Human Relations 60 (9): 1267–1292. doi:https://doi.org/10.1177/0018726707082848.
- Ball, S. J. 2013. The Education Debate. 2nd ed. Bristol: Policy Press.
- Belfield, C., C. Farquharson, and L. Sibieta. 2018. Annual Report on Education Spending in England. Accessed 12 October 2020, https://www.ifs.org.uk/uploads/publications/comms/R150.pdf.
- Blatchford, P., A. Russell, and R. Webster. 2012. Reassessing the Impact of Teaching Assistants: how Research Challenges Practice and Policy. New York: Routledge.
- Braverman, H. 1998. Labor and Monopoly Capital: The Degradation of Work in the Twentieth Century. New York: Monthly Review Press.
- Bubb, D. S., J. Crossley-Holland, J. Cordiner, D. S. Cousin, and P. Earley. 2019. Understanding the Middle Tier Comparative Costs of Academy and LA-maintained School Systems. Accessed 12 October 2020. https://discovery.ucl.ac.uk/id/eprint/10079272/1/Understanding%20the%20Middle%20Tier%20-%20Comparative%20Costs%20of%20Academy%20and%20LA-maintained%20School%20Systems%20%20-%20Sara%20Bubb%20Associates%2016%20July%202019.pdf
- Carter, B., and H. Stevenson. 2012. “Teachers, Workforce Remodelling and the Challenge to Labour Process Analysis.” Work, Employment and Society 26 (3): 481–496. doi:https://doi.org/10.1177/0950017012438579.
- Carter, B., H. Stevenson, and R. Passy. 2010. Industrial Relations in Education: Transforming the School Workforce: Bargaining for Change in the Education Industry. London: Routledge.
- Clapham, A., R. Vickers, and J. Eldridge. 2016. “Legitimation, Performativity and the Tyranny of a “Hijacked” Word.” Journal of Education Policy 31 (6): 757–772. doi:https://doi.org/10.1080/02680939.2016.1181789.
- Day, C., Q. Gu, and P. Sammons. 2016. “The Impact of Leadership on Student Outcomes: How Successful School Leaders Use Transformational and Instructional Strategies to Make a Difference.” Educational Administration Quarterly 52 (2): 221–258. doi:https://doi.org/10.1177/0013161X15616863.
- Department for Education (DfE) 2016. Educational Excellence Everywhere. 2016. Accessed 8 May 2020 https://www.gov.uk/government/publications/educational-excellence-everywhere.
- Department for Education (DfE) 2018a. Open Academies and Academy Projects in Development. 2018. Accessed 29 October 2020. https://www.gov.uk/government/publications/open-academies-and-academy-projects-in-development.
- Department for Education (DfE) 2018b. School Teachers’ Pay and Conditions: 2018. Accessed 2 November 2020. https://assets.publishing.service.gov.uk/government/uploads/system/uploads/attachment_data/file/740575/School_teachers__pay_and_conditions_document_2018.pdf
- Department for Education (DfE) 2018c. Trends in School Spending 2002 to 2016. Accessed 12 October 2020. https://assets.publishing.service.gov.uk/government/uploads/system/uploads/attachment_data/file/737155/Trends_in_school_spending_2002_to_2016.pdf
- Department for Education (DfE) 2019. LA and School Expenditure: 2018 to 2019 Financial Year. 2019. Accessed 3 January 2020. https://www.gov.uk/government/statistics/la-and-school-expenditure-2018-to-2019-financial-year.
- Department for Education and Skills 2005. Higher Standards, Better Schools For All: More Choice for Parents and Pupils. 2005. Accessed 24 April 2020. http://webarchive.nationalarchives.gov.uk/20070205131627/ http://dfes.gov.uk/publications/schoolswhitepaper/pdfs/DfES-Schools%20White%20Paper.pdf.
- Earley, P., R. Higham, R. Allen, T. Allen, J. Howson, R. Nelson, S. Rawal, et al. 2012. Review of the School Leadership Landscape. Nottingham: National College for School Leadership.
- Education Funding Agency 2016. Creating a leaner and more effective senior leadership team. 2016. Accessed 29 October 2020. https://www.gov.uk/government/case-studies/creating-a-leaner-and-more-effective-senior-leadership-team.
- Elwick, A. 2018. “New Forms of Government School Provision – An International Comparison.” Journal of Education Policy 33 (2): 206–225. doi:https://doi.org/10.1080/02680939.2017.1329551.
- Evetts, J. 2009. “The Management of Professionalism: A Contemporary Paradox.” In Changing Teacher Professionalism: International Trends, Challenges and Ways Forward, edited by S. Gewirtz, P. Mahony, I. Hextall, and A. Cribb, 19–30. London: Routledge.
- Felstead, A., D. Gallie, F. Green, F., and H. Inanc. 2012. Work Intensification in Britain: First Findings from the Skills and Employment Survey. Accessed 15 February 2021. http://orca.cf.ac.uk/67987/.
- Gewirtz, S. 2002. The Managerial School: post-Welfarism and Social Justice in Education. London: Routledge.
- Giangreco, M. F. 2013. “Teacher Assistant Supports in Inclusive Schools: Research, Practices and Alternatives.” Australasian Journal of Special Education 37 (2): 93–106. doi:https://doi.org/10.1017/jse.2013.1.
- Greany, T., and R. Higham. 2018. Hierarchy, Markets and Networks: Analysing the ‘Self-Improving School-Led System’ Agenda in England and the Implications for Schools. London: UCL IOE Press.
- Grint, K., and D. Nixon. 2015. The Sociology of Work. 4th ed. Malden, MA: Polity Press.
- Gronn, P. 2002. “Distributed Leadership.” In Second International Handbook of Educational Leadership and Administration, edited by K. Leithwood, and P. Hallinger, 653–696. Boston: Kluwer Academic Publishers.
- Gunter, H., E. Grimaldi, D. Hall, and R. Serpieri, eds. 2016. New Public Management and the Reform of Education. London: Routledge.
- Hall, D., E. Grimaldi, H. M. Gunter, J. Møller, R. Serpieri, and G. Skedsmo. 2015. “Educational Reform and Modernisation in Europe: The Role of National Contexts in Mediating the New Public Management.” European Educational Research Journal 14 (6): 487–507. doi:https://doi.org/10.1177/1474904115615357.
- Hermann, C., and J. Flecker. 2012. Privatization of Public Services: impacts for Employment, Working Conditions, and Service Quality in Europe. New York: Routledge.
- Lange, B., and N. Alexiadou. 2010. “Policy Learning and Governance of Education Policy in the EU.” Journal of Education Policy 25 (4): 443–463. doi:https://doi.org/10.1080/02680931003782819.
- Martens, K., A. Rusconi, and K. Leuze. 2007. New Arenas of Education Governance: The Impact of International Organizations and Markets on Educational Policy Making. Basingstoke: Palgrave Macmillan.
- Martindale, N. 2019. “Does Outsourcing School Systems Degrade Education Workforces? Evidence from 18,000 English State Schools.” British Journal of Sociology of Education 40 (8): 1015–1036. doi:https://doi.org/10.1080/01425692.2019.1647092.
- Mather, K., and R. Seifert. 2011. “Teacher, Lecturer or Labourer? Performance Management Issues in Education.” Management in Education 25 (1): 26–31. doi:https://doi.org/10.1177/0892020610388060.
- Ozga, J. 2008. “Governing Knowledge: Research Steering and Research Quality.” European Educational Research Journal 7 (3): 261–272. doi:https://doi.org/10.2304/eerj.2008.7.3.261.
- Reid, A. 2003. “Understanding Teachers’ Work: Is There Still a Place for Labour Process Theory?” British Journal of Sociology of Education 24 (5): 559–573. doi:https://doi.org/10.1080/0142569032000127134.
- Sharma, U., and S. Salend, 2016. “Teaching Assistants in Inclusive Classrooms: A Systematic Analysis of the International Research.” Australian Journal of Teacher Education 41 (8): 118–134. doi:https://doi.org/10.14221/ajte.2016v41n8.7.
- Slater, G. B. 2015. “Education as Recovery: neoliberalism, School Reform, and the Politics of Crisis.” Journal of Education Policy 30 (1): 1–20. doi:https://doi.org/10.14221/ajte.2016v41n8.7.
- Stahl, G. 2017. Ethnography of a Neoliberal School: Building Cultures of Success. New York: Routledge.
- Stevenson, H. 2013. “Teachers on Strike: A Struggle for the Future of Teaching?” FORUM 55 (3): 415. doi:https://doi.org/10.2304/forum.2013.55.3.415.
- Sturdy, E., and S. Freedman. 2007. Choice? What Choice? 2007. Policy Exchange. Accessed 24 April 2020. https://www.policyexchange.org.uk/wp-content/uploads/2016/09/choice-what-choice-nov-07.pdf.
- Verger, A., C. Fontdevila, and A. Zancajo. 2016. The Privatization of Education: A Political Economy of Global Education Reform. New York, NY: Teachers College Press.
- Webster, R., and P. Blatchford. 2013. The Making a Statement Project, Final Report: A Study of the Teaching and Support Experience by Pupils with a Statement of Special Educational Needs in Mainstream Primary Schools. London: Institute of Education.
Appendix
Analyses with different baseline years
Tables A1–A6 compare estimates of the model in the ‘Academies (2010-11 to 2016-17)’ section for different baseline years, 2010-11 to 2015-16. show results for primary schools for the three dependent variables, percentage of teachers in leadership, teachers per 100 pupils, and TAs per 100 pupils, respectively. show results for secondary Academies. shows results from Wald chi-squared tests for the joint significance of the Academy and Academy Years variables in Tables A1–A6.
Table A1. Primary state school determinants of percentage of teachers in leadership by baseline year.
Table A2. Primary state school determinants of number of teachers per 100 pupils by baseline year.
Table A3. Primary state school determinants of number of teaching assistants per 100 pupils by baseline year.
Table A4. Secondary state school determinants of percentage of teachers in leadership by baseline year.
Table A5. Secondary state school determinants of number of teachers per 100 pupils by baseline year.
Table A6. Secondary state school determinants of number of teaching assistants per 100 pupils by baseline year.
Table A7. Wald chi-squared test of joint significance statistics and significance levels for academy and academy type variables in .
Differences in differences analysis
The differences in differences approach controls for the effect of both time and unit-specific factors, here years and schools, using fixed effects. The aim is to control for unobserved school-level factors which could result in those schools which became Academies diverging from LA maintained schools in the workforce dependent variables for reasons other than becoming an Academy per se. Using school-level fixed effects (αi in EquationEquation (A1)) controls for differences in the characteristics of schools, including baseline values of the dependent variable. Using year fixed effects (γt in EquationEquation (A1)
) controls for trends affecting all schools over time. Therefore, the dummy variable for school i being an Academy in year t in EquationEquation (A1)
(Academyit), is an estimate for the time-averaged impact of becoming an Academy on the percentage of teachers without QTS in a school’s workforce. The model also controls for time-varying variables at school-level, Xkit. Results are reported in , odd numbered columns for primaries, even for secondaries.
(A.1)
Table A8. Differences in differences estimates of determinants of workforce characteristics in primary and secondary state schools (2010–2016).